Graphing a Function
Using the Call Grapher, you can graphically inspect the relationships of the functions in programs using ANSI C, C++, and Fortran. You can display the functions that either call or are called by one or more selected functions.
You must have a source browsing database to view function relationships (see "Source Browsing Databases").
Note -
You can graph virtual functions, but you should be aware that Sun WorkShop cannot determine the actual function that would be called. For example: If main calls b::d(), a virtual function that could actually call b1::d() or b2::d(), Sun WorkShop cannot tell which function is called. The graph shows main calling b::d(), but no connection between main and b1::d() or main and b2::d().
Call Graph Window
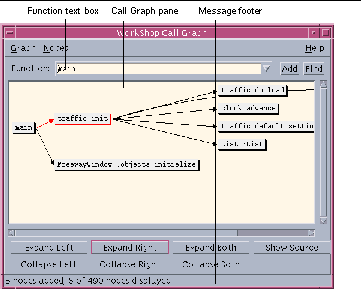
The Call Graph window provides a graphic representation of the call relationship of functions and subroutines. Figure 3-5 shows the Call Graph window.
To change the colors used for node background, graph pane background, node border, node text, and arrows between nodes in the Call Graph window, edit the WORKSHOP resource file (see "Call Graph and Class Graph Window Colors"). Any color changes you make apply to both the Call Graph and Class Graph windows (see "Class Graph Window").
Figure 3-5 Call Graph Window

|
Graph menu |
Provides commands for modifying the graph of the function call. |
|
Nodes menu |
Provides commands for modifying the nodes displayed. |
|
Function text box |
Allows you to enter the function or subroutine you want to graph. Click the arrow at the end of the Function text box to access the list of functions and subroutines previously graphed. |
|
Add button |
Adds a node with the given function to the Call Graph pane. |
|
Find button |
Moves the Call Graph pane to show the node for the given function or subroutine. |
|
Call Graph pane |
Displays the relationships of functions and subroutines in the source. You can select a single function or subroutine, or multiple functions and subroutines, and reposition them in the Call Graph pane. |
|
Expand Left button |
Shows all nodes that directly call the selected node (one level of parents). |
|
Expand Right button |
Shows all nodes called directly by the selected function or subroutine (one level of children). |
|
Expand Both button |
Shows all nodes directly called by and all nodes that directly call the selected node (one level of parents and children). Double-clicking on a node is equivalent to Expand Both. |
|
Collapse Left button |
Hides all nodes that directly call the selected node (one level of parents). |
|
Collapse Right button |
Hides all nodes called directly by the selected (one level of children). |
|
Show Source button |
Displays the source file containing the selected node in an editor window. Starts an editor if none is running. |
|
Message footer |
Reports the number of nodes displayed, the number of nodes added, and the number of nodes not displayed, as well as error messages. |
Graphing a Function or Subroutine Call
To graph a function or subroutine:
-
Click the Source Browsing radio button in the Browsing window.
-
Look in the Browsing window title bar to be sure you are in the correct browsing directory.
If not, choose Browse > Change Browsing Directory and use the Browsing Directory dialog box to select the directory that contains the source browser database.
-
Choose Browse > Graph Function Calls, or select a function in the source code or Debugging window and choose Browse > Graph Function Calls.
-
Type the name of a function or subroutine in the Function text box and click Add or press Return.
If you do not type a function or subroutine name in the text box, the Call Grapher defaults to main.
To display information about the function or subroutine:
-
Click a node to select it.
-
Click one of the buttons below the Call Graph pane to view the information you want. The footer of the window displays the number of nodes added and the number of nodes displayed out of the number that exist for the current application.
-
From the Nodes menu, choose commands for other viewing options such as showing, hiding, expanding, or collapsing nodes (see "Showing or Hiding Nodes").
-
Display the source of the class by selecting it in the Call Graph pane and choosing Show Source from the Nodes menu.
Note -
You can change the display of the Call Graph using the commands on the Graph menu (see "Changing the Look of a Call or Class Graph"). You can also print the Call Graph, as described in "Printing a Graph".
- © 2010, Oracle Corporation and/or its affiliates
