Chapter 3 Browsing Source Code
The Sun WorkShop browsing feature is a powerful tool. By browsing, you can find all occurrences of any symbol or string in a large program, including those found in header files.
This chapter is organized into the following sections:
Browsing uses a "what you see is what you browse" paradigm. The source code that you edit and compile is the same source code that Sun WorkShop uses in its searches.
Browsing can be used with multiple languages. When you browse a program that is written in more than one language, the browsing feature automatically determines the language in which each source file is written. The browsing operations do not change from one language to another.
Understanding Browsing
You browse source code written in C, C++, FORTRAN 77, and Fortran 90 by issuing queries that instruct Sun WorkShop to find all occurrences of the symbol, string constant, or search pattern that you have specified. You then view the occurrences or matches of the item you requested, with their surrounding source code.
You can also graph the function and subroutine relationships in your program. If your source code is written in C++, then you can browse and graph the classes defined in your program.
Browsing responds to queries by searching in a database that contains information about the files you are browsing. You create this database when you compile your source file with the Browsing option.
Browsing Window
To open the Browsing window, shown in Figure 3-1, click the Browsing button on the tool bar in the Sun WorkShop main window or choose a command from the Browse menu. The Graph Function Calls, Graph Classes, and Browse Classes commands open the Call Graph, Class Graph, and Class Browser windows, respectively (see Figure 3-5, Figure 3-6, and Figure 3-7).
Figure 3-1 Browsing Window
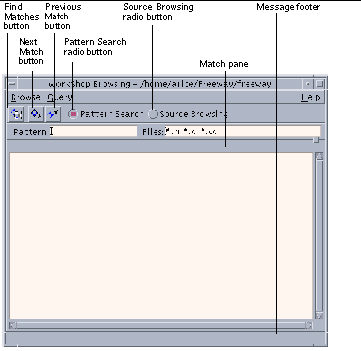
|
Browse menu |
Provides commands for changing directories, starting the graphers, rebuilding indexes, creating a tags database, exiting the source browsing server, and closing the browsing window. |
|
Query menu |
Provides commands for navigating matches, filtering matches, and displaying the query history. |
|
Find Matches button |
Starts the search for matches of your query. |
|
Next Match button |
Highlights the next match in the Match pane and shows the matching source code. |
|
Previous Match button |
Highlights the previous match in the Match pane and shows the matching source code |
|
Pattern Search radio button |
Sets the Browsing window to Pattern Search mode. |
|
Source Browsing radio button |
Sets the Browsing window to Source Browsing mode. |
|
Match pane |
Displays all matches in a scrollable pane. The total number of matches found for the current query is displayed immediately above the pane. Match information is displayed from left to right with the file name, the line number, and the text on that line. |
|
Message footer |
Displays the status of the current search or errors that occurred during a search. |
Using the Browsing Window
Two types of browsing are available through the Browsing window: pattern searches and source browsing.
Use pattern searching when you:
-
Want to do a quick search (grep-style) for a regular expression
-
Do not have a source browsing database in the directory you want to search
-
Do not want to graphically view function call relationships or class hierarchies
-
Do not want to examine the data or member functions of a class
Use source browsing when you:
-
Have a source browsing database created by adding the -xsb option to your compilation command or your makefile
-
Want to search for language elements such as subroutines, functions, classes, structs, unions, and records or for their usage, definitions, or assignments
-
Want to graphically view function and subroutine call relationships, or class hierarchies
-
Want to examine the data or member functions of a class
Pattern Search Mode
With pattern searching, you can search for regular expressions and simple text strings using the Browsing window.
Pattern searching searches all of the directories listed in the sb_init file (see "Importing Databases").
Browsing Window in Pattern Search Mode
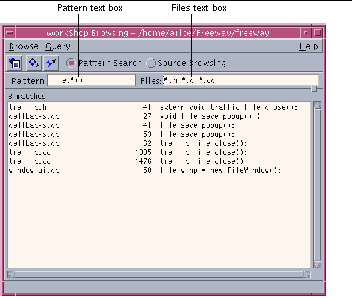
Figure 3-2 shows the Browsing window in Pattern Search mode (see Figure 3-1 to identify the other components of the window).
Figure 3-2 Browsing Window in Pattern Search Mode
|
Pattern text box |
Allows you to enter a regular expression to be matched |
|
Files text box |
Allows you to specify a file filter for the search |
Searching for a Pattern
To search for a pattern:
-
In the Sun WorkShop main window, choose Browse > Pattern Search or click the Browsing button; then click the Pattern Search radio button in the Browsing window.
-
Look in the Browsing window title bar to be sure you are in the correct browsing directory.
If not, choose Browse > Change Browsing Directory and select the correct directory in the Pattern Search Directory dialog box.
-
Type the pattern for which you want to search in the Pattern text box.
If you cannot remember the exact symbol for which you want to search, you can use wildcard characters (., *. ^, and $) in your pattern (see "Special Characters in Patterns").
-
Type a filter in the Files text box.
The default filter searches the current directory for all files ending in .h, .c, .cc, or .f. Sun WorkShop saves the filter in your WorkSet whenever you save the WorkSet.
Pattern searching uses the sb_init file to search multiple directories. It applies the Files filter to each directory.
-
Press Return, choose Query > Find Matches, or click the Find Matches button.
-
Move through the Match pane using the mouse, the Next Match and Previous Match buttons or menu items, or by pressing F5 and Shift+F5.
-
Click a match to view the source in the editor window.
Note -If you are overwhelmed by the number of matches found, restrict the types of files searched by changing the file types in the Files text box, and repeat the search.
You can search text displayed in the editor window. Double-click the text in the editor window to copy it, and paste it in the Browsing window's text box. If you are using vi or XEmacs as your text editor, you can also select text in the editor window and click the Find Refs button in the tool bar.
Special Characters in Patterns
Although you can enter a pattern exactly as it appears in the code, you can also use special characters to specify a set of patterns. You can use the special characters in Table 3-1 in patterns.
Table 3-1 Special Characters in Patterns|
Character | Meaning | Example |
|---|---|---|
|
Period (.) |
Matches any character |
l.nes matches all occurrences of lanes or lines. |
|
Asterisk (*) |
Matches any number of characters, including zero or more consecutive occurrences of the character that precedes it, except when it is the first character in the pattern |
file.*() matches any string that fcontains file followed by zero or more characters and (), such as traffic_file_close() and file_save_popup. *file. matches only strings that begin with file. |
|
Circumflex (^) |
Constrains the search to match the beginning of a line |
^tr* finds all lines that begin with traffic, truck, or any other string beginning with tr. |
|
Dollar sign ($) |
Constrains the search to match the end of a line |
lanes$ finds all the lines that end with the string lanes. |
For example, suppose you want to search for window_popup in the code, but only those instances that begin a line. You would type the following query:
^window_popup*
The circumflex (^) tells the browser to look only at those matches that start a line of code, while the asterisk (*) asks for all matches with window_popup, including window_popup_name_objects and window_popup1_objects.
Note -
Surrounding an expression with a circumflex and a dollar sign constrains the search to match the entire line.
Source Browsing Mode
Using source browsing, you can search for language elements such as functions, classes, structs, unions, and records or for their usage, definitions, or assignments. You can also graphically view function call relationships or class hierarchies. And you can examine the data or member functions of a class.
Source Browsing Databases
The Source Browser obtains the information it uses from a database that describes the static structure of your program. To use source browsing, you must first create a source browsing database by adding the -xsb option to your compilation command or your makefile.
The browser has different levels of functionality depending upon the database it accesses:
|
Compiler-generated database |
use full browser functionality |
|
Tags-generated database |
Allows queries on functions and global variables and can display function calls. Graphing features are not available. |
|
No database |
Must use the Pattern Search mode of the Source Browser. |
Using a tags-generated database has some advantages over using a database generated by a compiler:
-
You can always generate a tags database, even if the source code cannot be compiled because it is incomplete or semantically incorrect.
-
You can create a tags database much faster than running the compiler to generate a database.
-
A tags database is much smaller than a compiler-generated database.
Generating a Browser Database
When you compile your source files with the source browser option, Sun WorkShop creates a database containing information about the files. The Source Browser responds to queries by searching through this database.
When you create a compiler-generated database, you can access all browsing features.
To generate the browsing database, add the source browser option to your makefile:
|
Language |
Compiler Source Browser Option |
|---|---|
|
C++ |
-xsb or -sb |
|
ANSI C |
-xsb |
|
FORTRAN 77 |
-xsb or -sb |
|
Assembler |
-b |
Creating a Tags Database
A tags database provides a quick and convenient method for browsing source files without compilation. The database is based on a lexical analysis of the source file. It will not always correctly identify all language constructs, but it will operate on files that you cannot compile.
Note -
The source browsing tags are not in the same format as ctags; the tags discussed here are in a format that works specifically with source browsing.
If you browse using a tags database, you:
-
Cannot issue queries about local variables
-
Cannot browse classes
-
Have a limited ability to issue complex queries
-
Have a limited ability to focus queries
A tags database recognizes only global definitions for variables, types, and functions, and collects information on function calls. Function calls for C++ members are recognized only when called explicitly.
To create a tags database:
-
From the Browsing window, choose Browse > Create Tags Database.
-
In the Create Tags Database dialog box, click OK to accept the default file filter or enter the type of files you want to scan and click OK.
The browser creates the tags database.
Searching Multiple Directories
If you keep your source files in several different directories, you are likely to execute the compiler in each of these directories. As a result, the default compiler behavior generates a separate source browser database in each directory.
Since the Source Browser looks at only one database at a time, only the part of your application located in the current directory is searched. You can override this default behavior by importing databases.
Importing Databases
Instead of merging separate databases, you can import databases. Use the sb_init file to read more than one database. You can start browsing in the same directory that holds the sb_init file.
To import databases:
-
Identify where your sb_init file resides.
-
Add an import command to the sb_init file for each directory in which the compiler is executed:
import absolute_or_relative_pathname
-
Set your SUNPRO_SB_INIT_FILE_NAME environment variable to point to your sb_init file.
Add the following line to your .login file:
setenv SUNPRO_SB_INIT_FILE_NAME path to sb_init file/sb_init
Note -
Use the import option to search your entire source tree for source files and browser databases. Just add an import command to the sb_init file for each directory in your source tree.
Note -
Because pattern searching uses sb_init to search source files in multiple directories, and source browsing uses sb_init to search browser databases (which include object files) in multiple directories, you may want to include import commands for both source and object directories in your sb_init file.
Browsing Window in Source Browsing Mode
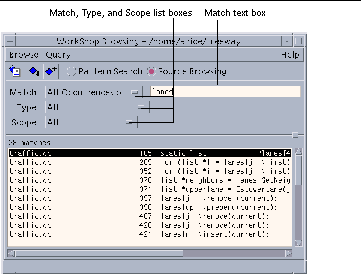
Figure 3-3 shows the Browsing window in Source Browsing mode (see Figure 3-1 to identify the other components of the window).
Figure 3-3 Browsing Window in Source Browsing Mode
|
Match list |
Allows you to filter the search to specific uses of the query. You can select from the following usage types: All Occurrences of--No restrictions on the match type of the given entry Uses of--Show all uses of the given entry Definitions of-- Show all definitions for the given entry Assignments to--Show all assignments to the given entry |
|
Match text box |
Contains the query on which you want to search. |
|
Type list |
Allows you to set a filter for the entry being queried. You can select from the following types: All--No restrictions on the language element type of the given entry Member/Field--Instances of the given entry as class member, or record fields Class/Struct/Record--Instances of the given entry as classes, structs, or records Static--Instances of the given entry as functions or variables that have static storage Function--Instance of the given entry as a function Symbolic Constant--Constant referred to by a symbolic name; for example, ENUM members, PARAMETER statement defined constants, set members, and #define macros (with or without arguments) |
|
Scope list |
Allows you to restrict the search to specific elements in the source. Enter the string for the element in the Scope text box. Shell-style expressions are supported. You can select one of the following components: All--No restrictions on the scope of the given entry Program/Library--Search only in the specified program or library files Class/Struct--Search only in the specified class or struct Function--Search only in specified functions Source File--Search only in the specified source files |
Using Source Browsing
To use source browsing:
-
Compile the application using the -sb or -xsb option, which instructs the compiler to generate a browsing database during compilation.
-
Choose Browse > Browse Sources, or click the Browsing button in the Sun WorkShop main window tool bar, and then click the Source Browsing radio button in the Browsing window.
-
Look in the Browsing window title bar to be sure you are in the correct browsing directory.
If not, choose Browse > Change Browsing Directory and use the Browsing Directory dialog box to select the directory that contains the source browser database.
Note -You can search files in multiple directories in the browsing database. See "Searching Multiple Directories".
-
Type a query in the Match text box and press Return, choose Query > Find Matches, or click the Find Matches button.
For details on writing a query, see "Composing a Query".
-
Restrict the number of matches returned by choosing a match, type, or scope from the appropriate pulldown list.
For information on the lists, see "Browsing Window in Source Browsing Mode". For detailed information on restricting a query, see "Restricting a Query" in the Sun WorkShop online help.
-
Move through the Match pane using the mouse, the Next Match and Previous Match buttons or menu items, or by pressing F5 and Shift+F5.
Each match line contains the name of the source file, the line number, and the text on that line. Matches are sorted with definitions first, declarations last, and everything else in between. Within each group, the matches are listed alphabetically by file name, then by line number.
-
Click a match to view the source in the editor window.
-
Start the Call Grapher, Class Grapher, or the Class Browser to view relationships in the source.
Composing a Query
When you use source browsing, a query instructs the browser to find all occurrences of the symbol, string constant, or search pattern entered in the search field. The item actively being searched for is called the current query.
All symbols in the code identical to the query are referred to as matches.
In general, you cannot query for reserved words. The exception is language-defined type names in ANSI C or C++. For example, you can query on int, float, double, or long in ANSI C or C++ programs; however, you cannot query on integer or print in Fortran programs.
You can search for a variable, function, type, constant or macro. If you are unsure of what to browse for, begin by selecting main or another identifier used early in your program.
Special Characters in Queries
Although you can enter a name or function exactly as it appears in the code, you can also use wildcard characters to specify a set of character strings.
Use the wildcard characters in Table 3-2 in queries you type in the Match text box:
Table 3-2 Special Character in Queries| Character | Meaning | Example |
|---|---|---|
|
period (.) |
Matches any character |
.ehicle matches all occurrences of vehicle or Vehicle |
|
asterisk (*) |
Matches any number of characters, including zero or more consecutive occurrences of the character that precedes it. |
vehi.* matches any string that begins with veh, such as vehicle_length(). vehi* matches veh but not vehicle_length(). |
Using the Double Colon Operator
The double colon operator (::) qualifies a C++ member function or top-level function with the following:
-
An overloaded name---the same name used with different argument types
-
An ambiguous name--the same name used in different classes
The syntax is as follows:
class_name::function_name
For example, hand::grasp.
To find RW::ListPtr::insert(), the following regular expressions will work:
| insert ListPtr::insert RW::ListPtr::insert |
The first two regular expressions are equivalent to .*::.*::insert and .*::ListPtr::insert and might match more symbols. The entry insert matches all functions or member functions with the name insert instead of requiring .*insert.
Source Browser Options Dialog Box
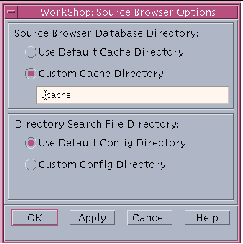
The Source Browser Options dialog box (see Figure 3-4) lets you specify:
-
The name of the cache directory that contains files that Sun WorkShop automatically creates when you build an application
-
The name of the directory that contains configuration files (both those generated by Sun WorkShop tools and those you may create manually)
Specifying these names sets the SUNWS_CACHE_NAME and SUNWS_CONFIG_NAME environment variables, respectively, for the source browser engine.
Note -
You can safely delete the cache directory to save disk space. It can be automatically regenerated. Do not delete the configuration directory; it cannot be regenerated.
If the SUNWS_CACHE_NAME or SUNWS_CONFIG_NAME variable is set to a directory that does not exist, the dialog box opens with the corresponding default directory selected even though you have specified a custom directory.
Figure 3-4 Source Browser Options Dialog Box
| Use Default Cache Directory radio button |
Allows you to choose to use the default cache directory (SunWS_cache). |
| Custom Cache Directory radio buton | Allows you to name a custom cache directory. If you select the radio button, a text box is displayed into which you can type the new directory name, which must not be a path name. |
| Use Default Config Directory radio button | Allows you to choose to use the default config directory (SunWS_config). |
| Custom Config Directory radio button |
Allows you to name a custom config directory. If you select the radio button, a text box is displayed into which you can type the new directory name, which must not be a path name. |
|
OK |
Applies changes and closes the Source Browser Options dialog box. |
|
Apply |
Applies changes without closing the Source Browser Options dialog box. |
|
Cancel |
Closes the Source Browser Options dialog box without applying changes. |
|
Help |
Displays help for the Source Browser Options dialog box. |
Graphing a Function
Using the Call Grapher, you can graphically inspect the relationships of the functions in programs using ANSI C, C++, and Fortran. You can display the functions that either call or are called by one or more selected functions.
You must have a source browsing database to view function relationships (see "Source Browsing Databases").
Note -
You can graph virtual functions, but you should be aware that Sun WorkShop cannot determine the actual function that would be called. For example: If main calls b::d(), a virtual function that could actually call b1::d() or b2::d(), Sun WorkShop cannot tell which function is called. The graph shows main calling b::d(), but no connection between main and b1::d() or main and b2::d().
Call Graph Window
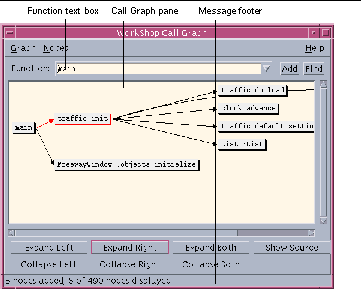
The Call Graph window provides a graphic representation of the call relationship of functions and subroutines. Figure 3-5 shows the Call Graph window.
To change the colors used for node background, graph pane background, node border, node text, and arrows between nodes in the Call Graph window, edit the WORKSHOP resource file (see "Call Graph and Class Graph Window Colors"). Any color changes you make apply to both the Call Graph and Class Graph windows (see "Class Graph Window").
Figure 3-5 Call Graph Window
|
Graph menu |
Provides commands for modifying the graph of the function call. |
|
Nodes menu |
Provides commands for modifying the nodes displayed. |
|
Function text box |
Allows you to enter the function or subroutine you want to graph. Click the arrow at the end of the Function text box to access the list of functions and subroutines previously graphed. |
|
Add button |
Adds a node with the given function to the Call Graph pane. |
|
Find button |
Moves the Call Graph pane to show the node for the given function or subroutine. |
|
Call Graph pane |
Displays the relationships of functions and subroutines in the source. You can select a single function or subroutine, or multiple functions and subroutines, and reposition them in the Call Graph pane. |
|
Expand Left button |
Shows all nodes that directly call the selected node (one level of parents). |
|
Expand Right button |
Shows all nodes called directly by the selected function or subroutine (one level of children). |
|
Expand Both button |
Shows all nodes directly called by and all nodes that directly call the selected node (one level of parents and children). Double-clicking on a node is equivalent to Expand Both. |
|
Collapse Left button |
Hides all nodes that directly call the selected node (one level of parents). |
|
Collapse Right button |
Hides all nodes called directly by the selected (one level of children). |
|
Show Source button |
Displays the source file containing the selected node in an editor window. Starts an editor if none is running. |
|
Message footer |
Reports the number of nodes displayed, the number of nodes added, and the number of nodes not displayed, as well as error messages. |
Graphing a Function or Subroutine Call
To graph a function or subroutine:
-
Click the Source Browsing radio button in the Browsing window.
-
Look in the Browsing window title bar to be sure you are in the correct browsing directory.
If not, choose Browse > Change Browsing Directory and use the Browsing Directory dialog box to select the directory that contains the source browser database.
-
Choose Browse > Graph Function Calls, or select a function in the source code or Debugging window and choose Browse > Graph Function Calls.
-
Type the name of a function or subroutine in the Function text box and click Add or press Return.
If you do not type a function or subroutine name in the text box, the Call Grapher defaults to main.
To display information about the function or subroutine:
-
Click a node to select it.
-
Click one of the buttons below the Call Graph pane to view the information you want. The footer of the window displays the number of nodes added and the number of nodes displayed out of the number that exist for the current application.
-
From the Nodes menu, choose commands for other viewing options such as showing, hiding, expanding, or collapsing nodes (see "Showing or Hiding Nodes").
-
Display the source of the class by selecting it in the Call Graph pane and choosing Show Source from the Nodes menu.
Note -
You can change the display of the Call Graph using the commands on the Graph menu (see "Changing the Look of a Call or Class Graph"). You can also print the Call Graph, as described in "Printing a Graph".
Graphing Classes
Using the Class Grapher, you can graphically inspect the inheritance structure of classes in C++ programs.
Class Graph Window
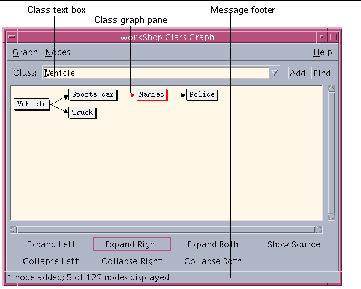
The Class Graph window provides a graphic representation of class hierarchies. Figure 3-6 shows the Class Graph window.
To change the colors used for node background, graph pane background, node border, node text, and arrows between nodes in the Class Graph window, edit the WORKSHOP resource file (see "Call Graph and Class Graph Window Colors"). Any color changes you make apply to both the Class Graphi and Call Graph windows (see "Call Graph Window").
Figure 3-6 Class Graph Window
|
Graph menu |
Provides commands for modifying the graph of the class hierarchies. |
|
Nodes menu |
Provides commands for modifying the nodes displayed. |
|
Class text box |
Allows you to enter the class you want to graph. Click the arrow at the end of the Class text box to access the list of classes previously graphed. |
|
Add button |
Adds a node with the given class to the Class Graph pane. |
|
Find button |
Moves the ClassGraph pane to show the node for the given class. |
|
Class Graph pane |
Displays a graphical presentation of class hierarchies. |
|
Expand Left button |
Shows all parent classes of the selected class (one level of parents). |
|
Expand Right button |
Shows all child classes of the selected class (one level of children). |
|
Expand Both button |
Shows all parent and child classes of the selected class (one level of parents and children). |
|
Collapse Left button |
Hides all parent classes of the selected class (one level of parents). |
|
Collapse Right button |
Hides all child classes of the selected class (one level of children). |
|
Collapse Both button |
Hides all parent and child classes of the selected class (one level of parents and children). |
|
Show Source button |
Displays the source file containing the selected class in an editor window. Sun WorkShop starts an editor if one is not presently open. |
|
Message footer |
Reports the number of nodes displayed, the number of nodes added, and the number of nodes not displayed, as well as error messages. |
Graphing a Class Hierarchy
To graph a class hierarchy:
-
Choose Browse > Graph Classes, or select a class in the source code or Debugging window and choose Browse > Graph Classes.
-
Type a class name in the Class text box and click Add Current Class or press Return.
To display information about a class:
-
Click a node to select it.
-
Click one of the buttons below the Class Graph pane to display the information you want. The footer of the window displays the number of nodes added and the number of nodes displayed out of the number that exist for the current function.
-
From the Nodes menu, choose commands for other viewing options such as showing, hiding, expanding, or collapsing nodes (see "Showing or Hiding Nodes").
-
Select a node and click Show Source to view the source in the editor window.
Note -
You can change the display of the Class Graph window using the commands on the Graph menu (see "Changing the Look of a Call or Class Graph"). You can also print the class graph, as described in "Printing a Graph".
Changing and Printing Graph Displays
The commands in the Graph and Nodes menus of the two grapher windows allow you to magnify or shrink the graph; expand, collapse, show, or hide nodes; and print the graph.
Changing the Look of a Call or Class Graph
You can change the magnification and rearrange the layout of your nodes to vary your view of the graph. If you want to get a birds-eye view of a graph, you can shrink it. You can also fit the entire graph into the window.
To enlarge the graph, choose Graph > Magnify. Use the scrollbars to view the entire display or resize the window. You can incrementally enlarge the graph with the Magnify command.
To reduce the graph, choose Graph > Shrink. You can shrink the graph until it is reduced to a dot on the pane. Reset it to a readable size with the Reset Magnification command.
To see the entire graph, choose Graph > Fit to Window. The graph shrinks or enlarges to fit within the pane. If you resize the window, choosing Fit to Window will resize the graph to fit within the new size of the pane.
To reset the magnification, choose Graph > Reset Magnification. If you changed the size of the graph, use this command to reset the display to its original size. You might have to use the scrollbars to find the location of the graph in the pane.
Showing or Hiding Nodes
You can simplify a complicated graph by showing only relevant nodes and hiding the rest of the nodes in the background. You can view just nodes that have nodes connected to them, or those with connected nodes in only one direction.
Expanding Nodes
Nodes that are expandable appear with a thicker box border. Double-clicking these nodes displays the child and parent nodes (do the same thing by choosing Expand Both).
To expand nodes:
-
Select one or more nodes by holding down the Shift key and clicking on each node.
-
From the Nodes menu, choose one of the Expand commands, or double-click on the node to expand a single node in both directions.
Showing Nodes
To show all nodes in the database, choose Nodes > Show All.
To restore a previous node:
-
Click the arrow button at the end of the Function or Class text box to open the history list.
-
Click the desired function name or class name to return the node to the pane.
Only the original nodes for the selected item are redisplayed in the pane. The relationship of the chosen node to other nodes must be reconstructed.
Hiding Nodes
To hide nodes, choose one of the following commands from the Nodes menu:
|
Hide Selected |
Hides the selected nodes from view. |
|
Hide Non-Selected |
Hides all nodes but selected nodes from view |
|
Hide Unconnected |
Hides all nodes that do not have connections to another node. You don't have to select a node to use this command. |
To clear all nodes from the pane, choose Nodes > Clear All.
Changing the Node Layout
You can set default options to:
-
Display the nodes vertically instead of using the horizontal default.
-
Change the lines connecting the nodes to arrows to exemplify the directional flow from one node to another.
-
Display function names in short or long form. The long form shows the function name and its argument-type signature. For example:
Short form
handler_load_save
Long form
handler_load_save(unsigned long, inputevent)
To change the layout of the nodes:
-
Choose Graph > Options.
-
Choose from among the following:
Graph Layout Select horizontal or vertical Use Arrowheads Select yes or no Function Names Select short or long (Call Grapher only) -
Click OK.
To reset the layout, choose Graph > Reset Layout. All nodes return to their original positions in the graph. You can select nodes and drag them to other positions in the pane.
To select multiple nodes in the graph, hold down the Shift key and click each additional node.
Printing a Graph
You can print the graph display from either the Call Graph or Class Graph window.
To print the graph:
-
Choose Graph > Print to open the Print Graph dialog box.
-
Type the number of copies and select the print parameters.
-
Type the name of the printer or the name of a file to which to print.
-
Click OK.
Browsing Classes
Using the Class Browser, you can:
-
Browse a class--Show the class list and data function members. View class interfaces and relationships.
-
Examine class relationships--Select a class and examine its base, derived, and friend classes. Browse classes, structs, and unions referenced in the current class.
-
Graph a class--Graph the class hierarchy of a class selected in the Class Browser window.
-
Show the source of a class--Show the source of a particular class in an editor window.
Class Types that Can Be Examined
When you open the Class Browser window (see Figure 3-7), the Browser list contains all classes of the type Class or Struct in the current source browser database.
Using the two checkboxes to the right of the Browser list, you can show all types, just the classes and structs, or just the Unions.
Class Browser Window
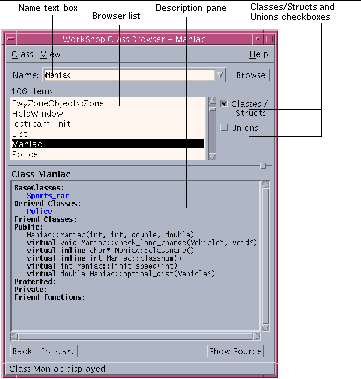
You can view information about classes and their member and friend functions in the Class Browser window. By navigating through the classes in the source code and libraries, you can understand how the classes were defined and used. Figure 3-7 shows the Class Browser window.
Figure 3-7 Class Browser Window
|
Class menu |
Provides commands for opening another Class Browser window, displaying the source for a selected class, and closing the Class Browser window. |
|
View menu |
Provides a list of member and friend functions to examine. |
|
Name text box |
Allows you to enter the name of the class, struct, or union to examine. Click the arrow at the end of the text box to access a list of previously entered items. |
|
Browse button |
Displays information about the selected class in the Description pane. |
|
Browser list |
Displays all of the class types you can examine. Click a class in the list to select it and the class name appears in the Name text box. The Classes/Structs and Unions checkboxes determine the class types shown. |
|
Classes/Structs checkbox |
Shows user-definable types, and any class declared with the class-key struct, in the Browser list. All C and C++ style structs are listed. Its members and base classes are public by default. |
|
Unions checkbox |
Shows classes declared with the class-key union in the Browser list; it can contain objects of different types at different times. All C and C++ style unions are listed. |
|
Description pane |
Displays information about the given language element. |
| Back button | Displays information about the class you selected before the currently displayed class. |
| Forward button | Displays information about the class you selected after the currently displayed class. |
|
Message footer |
Displays messages about operations in the Class Browser window. |
Browsing a Class
To browse a class, do the following:
-
Choose Browse > Browse Classes, or select a class in the source code or Debugging window and choose Browse > Browse Classes.
-
Type the name of a class in the Name text box, or select a class from the Browser list. Click the Classes/Structs and Unions checkboxes to filter the classes and data function members listed, and click Browse.
To view information about the class, click an underlined base or derived class in the Description pane. Use the Back and Forward buttons to redisplay information about about the class you selected before or after the currently displayed class, respectively.
To view the source in the editor window, select a line (or a portion of a line) containing a data member or friend function in the Description pane and click Show Source.
Browsing Classes in Multiple Windows
Opening multiple browsing windows can help you examine and compare several classes at a time. Any Class Browser windows opened in the same browsing session share the same class list but do not share properties or class histories.
To open a new Class Browser window, do one of the following:
Relationship of Browsers and Graphers
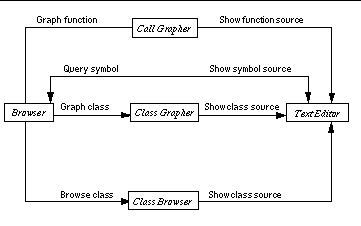
Figure 3-8 shows how the Browsing window, the Call Graph window, the Class Graph window, and the Class Browser window interrelate.
Figure 3-8 How Browsing, the Graphers, and the Class Browser Interrelate
Exiting Browsing
To quit the current browsing process and close all browsing windows, choose Browse > Exit Browsing in the Browsing window.
If you want to close the Browsing windows without killing the current browse process, choose Browse > Close.
- © 2010, Oracle Corporation and/or its affiliates
