| C H A P T E R 2 |
|
Learning to Use the Performance Tools |
This chapter shows you how to use the Collector and the Performance Analyzer by means of a tutorial. The tutorial has three main purposes:
Five example programs are provided that illustrate the capabilities of the Performance Analyzer in several different situations.
|
Note - The data that you see in this chapter might differ from the data that you see when you run the examples for yourself. |
The instructions for collecting performance data in this tutorial are given only for the command line. For most of the examples you can also use the IDE to collect performance data. To collect data from the IDE, you use the dbx Debugger and the Performance Toolkit submenu of the Debug menu.
The examples are provided with the Sun ONE Studio 8 software release. The source code and makefiles for each of the example programs are in the Performance Analyzer example directory.
install-directory/examples/analyzer |
The default for install-directory is /opt/SUNWspro. The Performance Analyzer example directory contains a separate subdirectory for each example, named synprog, jsynprog,omptest, mttest and cachetest.
To compile the examples with the default options:
1. Ensure that install-directory/bin appears in your path before any other installation of the Sun ONE Studio or Forte Developer software.
2. Copy the files in one or more of the example subdirectories to your own work directory.
% mkdir -p work-directory/example % cp -r install-directory/examples/analyzer/example work-directory |
Choose example from the list of example subdirectory names given above. This tutorial assumes that your directory is set up as described in the preceding code box.
3. Type make to compile and link the example program.
% cd work-directory/example % make |
The following requirements must be met in order to run the example programs as described in this chapter:
The default compiler options have been chosen to make the examples work in a particular way. Some of them can affect the performance of the program, such as the -xarch option, which selects the instruction set architecture. This option is set to native so that you use the instruction set that is best suited to your computer. If you want to use a different setting, change the definition of the ARCH environment variable in the makefile.
If you run the examples on a SPARC platform with the default V7 architecture, the compiler generates code that calls the .mul and .div routines from libc.so rather than using integer multiply and divide instructions. The time spent in these arithmetic operations shows up in the <Unknown> function; see The <Unknown> Function for more information.
The makefiles for all four examples contain a selection of alternative settings for the compiler options in the environment variable OFLAGS, which are commented out. After you run the examples with the default setting, choose one of these alternative settings to compile and link the program to see what effect the setting has on how the compiler optimizes and parallelizes code. For information on the compiler options in the OFLAGS settings, see the C User's Guide or the Fortran User's Guide.
This section describes some basic features of the Performance Analyzer.
The Performance Analyzer displays the Functions tab when it is started. If the default data options were used in the Collector, the Functions tab shows a list of functions with the default clock-based profiling metrics, which are:
The function list is sorted on exclusive CPU time by default. For a more detailed discussion of metrics, see How Metrics Are Assigned to Program Structure.
Selecting a function in the Functions tab and clicking the Callers-Callees tab displays information about the callers and callees of a function. The tab is divided into three horizontal panes:
In addition to exclusive and inclusive metrics, additional data can be viewed with the following tabs.
For a complete description of each tab, see Chapter 5, The Performance Analyzer Graphical User Interface.
This example is designed to demonstrate the main features of the Performance Analyzer using four programming scenarios:
Read the instructions in the sections, Setting Up the Examples for Execution and Basic Features of the Performance Analyzer, if you have not done so. Compile synprog before you begin this example.
To collect data for synprog and start the Performance Analyzer from the command line, type the following commands.
% cd work-directory/synprog % collect synprog % analyzer test.1.er & |
You are now ready to analyze the synprog experiment using the procedures in the following sections.
This section examines CPU times for two functions, cputime() and icputime(). Both contain a for loop that increments a variable x by one. In cputime(), x is a floating-point variable, but in icputime(), x is an integer variable.
1. Locate cputime() and icputime() in the Functions tab.
You can use the Find tool to find the functions instead of scrolling the display.
Compare the exclusive user CPU time for the two functions. Much more time is spent in cputime() than in icputime().
2. Choose File  Create New Window (Alt-F, N).
A new Analyzer window is displayed with the same data. Position the windows so that you can see both of them.
3. In the Functions tab of the first window, click cputime() to select it, then click the Source tab.
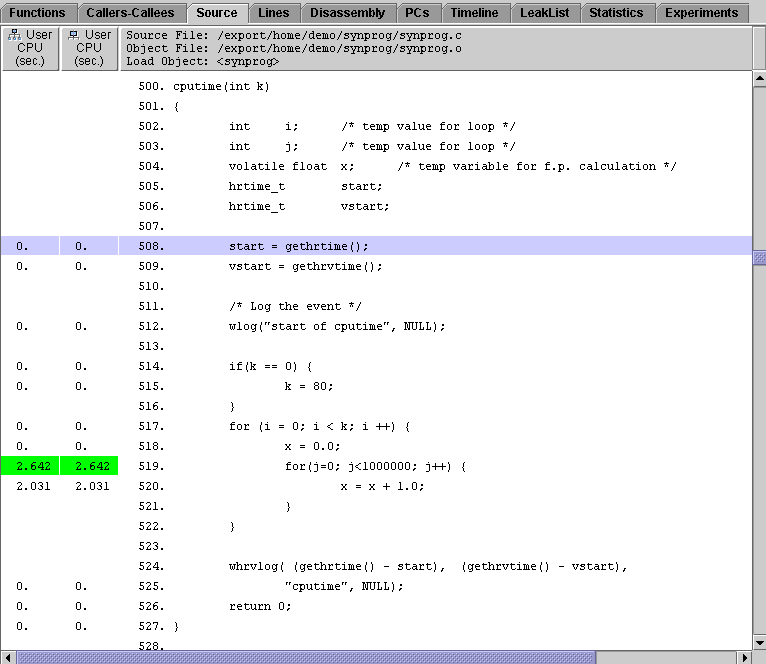
4. In the Functions tab of the second window, click icputime() to select it, then click the Source tab.
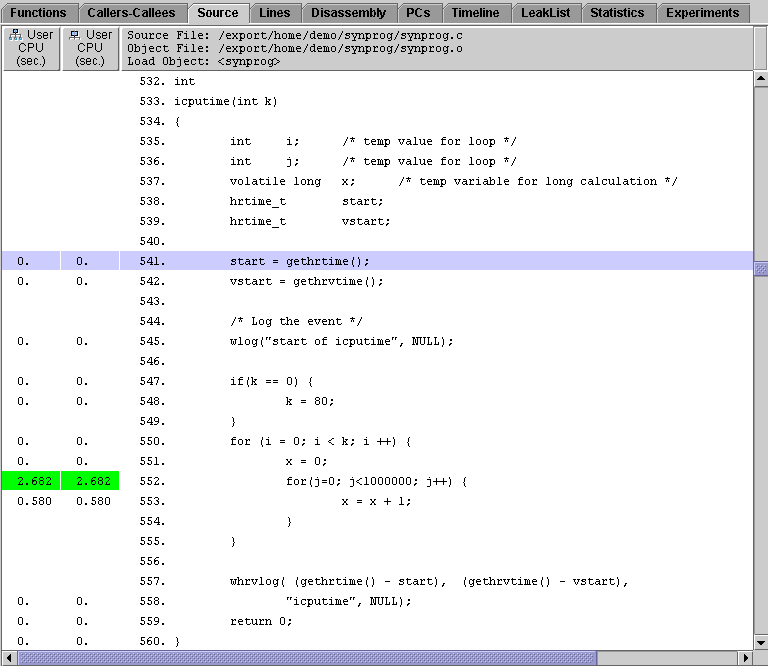
The annotated source listing tells you which lines of code are responsible for the CPU time. Most of the time in both functions is used by the loop line and the line in which x is incremented.
The time spent on the loop line in icputime() is approximately the same as the time spent on the loop line in cputime(), but the line in which x is incremented takes much less time to execute in icputime() than the corresponding line in cputime().
5. In both windows, click the Disassembly tab and locate the instructions for the line of source code in which x is incremented.
You can find these instructions by choosing High Metric Value in the Find tool combo box and searching.
The time given for an instruction is the time spent waiting for the instruction to be issued, not the time spent executing the instruction.
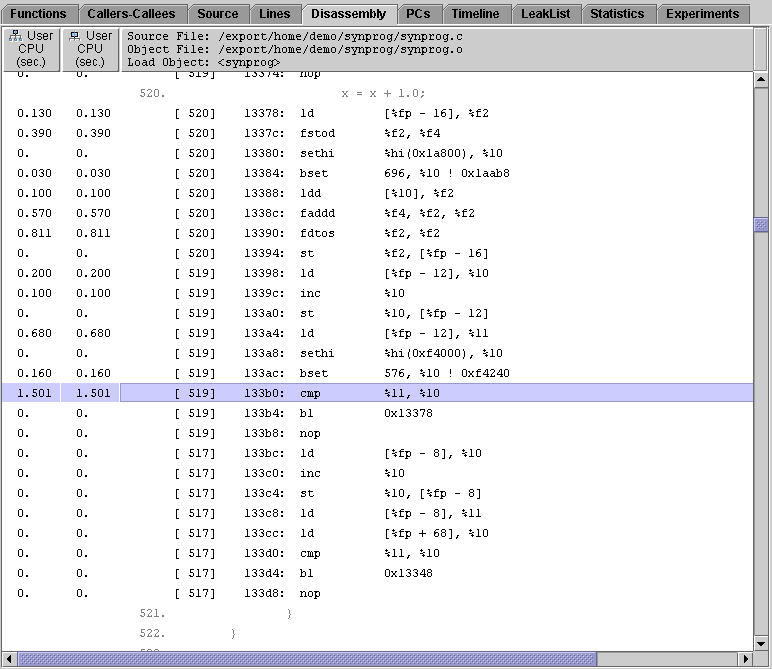
In cputime(), there are six instructions that must be executed to add 1 to x. A significant amount of time is spent loading 1.0, which is a double floating-point constant, and adding it to x. The fdtos and fstod instructions convert the value of x from a single floating-point value to a double floating-point value and back again, so that 1.0 can be added with the faddd instruction.
In icputime(), there are only three instructions: a load, an increment, and a store. These instructions take approximately a third of the time of the corresponding set of instructions in cputime(), because no conversions are necessary. The value 1 does not need to be loaded into a register--it can be added directly to x by a single instruction.
6. When you have finished the exercise, close the new Analyzer window.
Edit the source code for synprog, and change the type of x to double in cputime(). What effect does this have on the time? What differences do you see in the annotated disassembly listing?
This section examines how time is attributed from a function to its callers and compares the way attribution is done by the Performance Analyzer with the way it is done by gprof.
1. In the Functions tab, select gpf_work() and then click Callers-Callees.
The Callers-Callees tab is divided into three panes. In the center pane is the selected function. In the pane above are the callers of the selected function, and in the pane below are the functions that are called by the selected function, which are termed callees. This tab is described in The Callers-Callees Tab and also in Basic Features of the Performance Analyzer of this chapter.
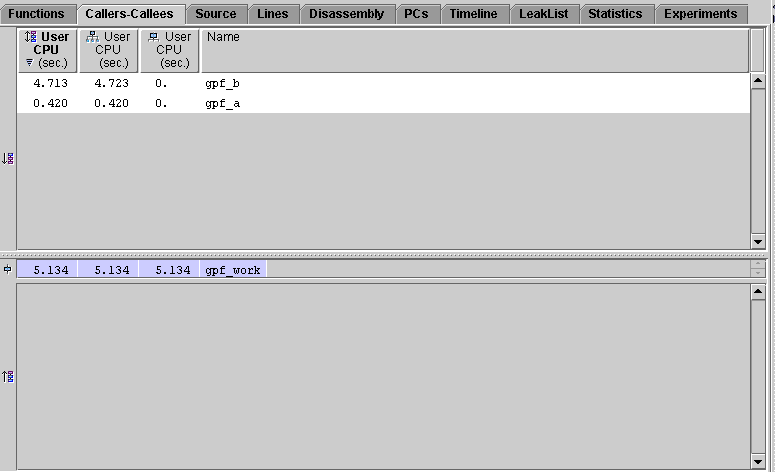
The Callers pane shows two functions that call the selected function, gpf_b() and gpf_a(). The Callees pane is empty because gpf_work() does not call any other functions. Such functions are called "leaf functions."
Examine the attributed user CPU time in the Callers pane. Most of the time in gpf_work() results from calls from gpf_b(). Much less time results from calls from gpf_a().
To see why gpf_b() calls account for over ten times as much time in gpf_work() as calls from gpf_a(), you must examine the source code for the two callers.
2. Click gpf_a() in the Callers pane.
gpf_a() becomes the selected function, and moves to the center pane; its callers appear in the Callers pane, and gpf_work(), its callee, appears in the Callees pane.
3. Click the Source tab and scroll down so that you can see the code for both gpf_a() and gpf_b().
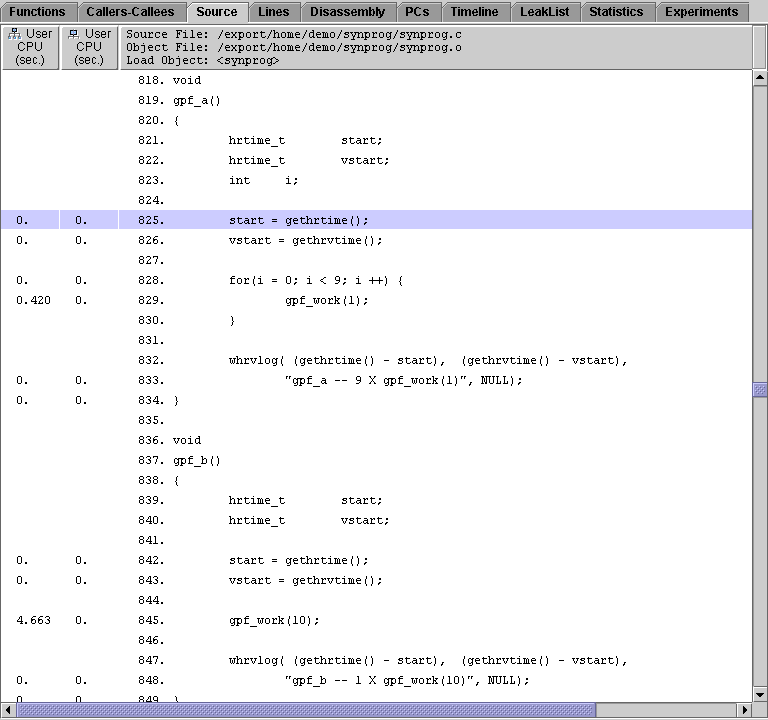
gpf_a() calls gpf_work() ten times with an argument of 1, whereas gpf_b() calls gpf_work() only once, but with an argument of 10. The arguments from gpf_a() and gpf_b() are passed to the formal argument amt in gpf_work().
Now examine the code for gpf_work(), to see why the way the callers call gpf_work() makes a difference.
4. Scroll down to display the code for gpf_work().
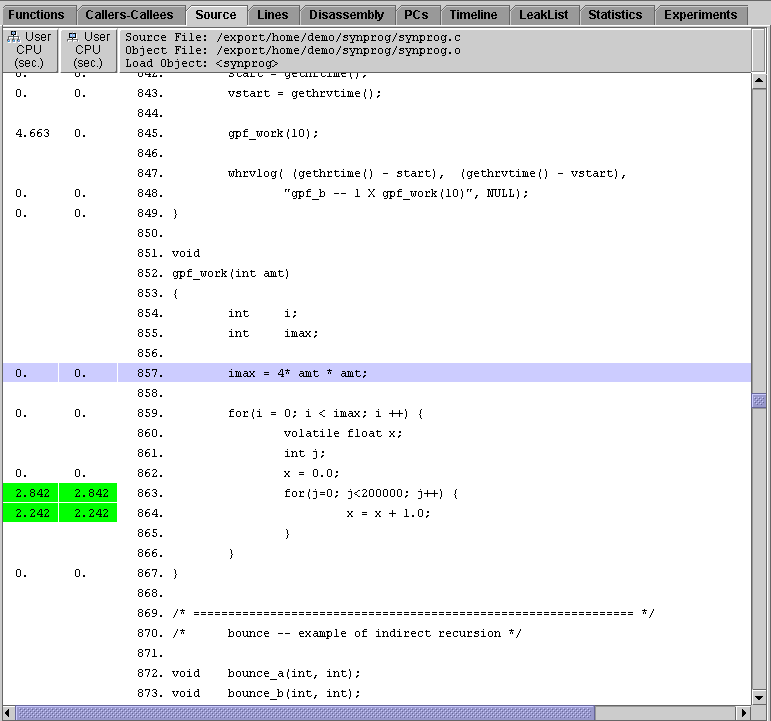
Examine the line in which the variable imax is computed: imax is the upper limit for the following for loop.The time spent in gpf_work() thus depends on the square of the argument amt. So ten times as much time is spent on one call from a function with an argument of 10 (400 iterations) than is spent on ten calls from a function with an argument of 1 (10 instances of 4 iterations).
In gprof, however, the amount of time spent in a function is estimated from the number of times the function is called, regardless of how the time depends on the function's arguments or any other data that it has access to. So for an analysis of synprog, gprof incorrectly attributes ten times as much time to calls from gpf_a() as it does to calls from gpf_b(). This is the gprof fallacy.
This section demonstrates how the Performance Analyzer assigns metrics to functions in a recursive sequence. In the data collected by the Collector, each instance of a function call is recorded, but in the analysis, the metrics for all instances of a given function are aggregated. The synprog program contains two examples of recursive calling sequences:
In either case, exclusive metrics belong only to the function in which the actual work is done, in these cases real_recurse() and bounce_a(). These metrics are passed up as inclusive metrics to every function that calls the final function.
First, examine the metrics for recurse() and real_recurse():
1. In the Functions tab, find function recurse()and select it.
Instead of scrolling the function list you can use the Find tool.
Function recurse() shows inclusive user CPU time, but its exclusive user CPU time is zero because all recurse() does is execute a call to real_recurse().
2. Click the Callers-Callees tab.
The selected function, recurse(), is shown in the center pane. The function real_recurse(), which is called by recurse(), is shown in the lower pane. This pane is termed the Callees pane.
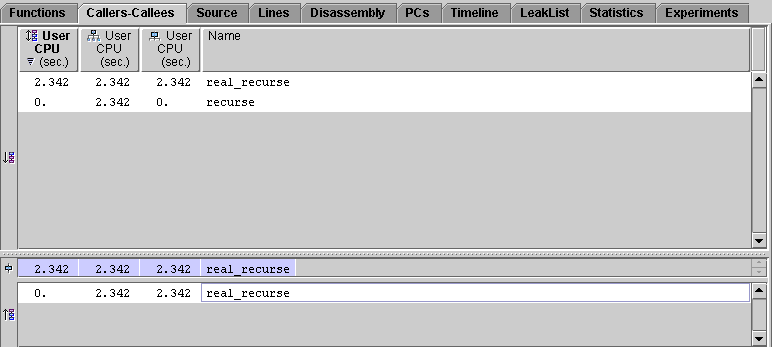
The Callers-Callees tab now displays information for real_recurse():
Now examine what happens in the indirect recursive sequence.
1. Find function bounce() in the Functions tab and select it.
Function bounce() shows inclusive user CPU time, but its exclusive user CPU time is zero. This is because all bounce() does is to call bounce_a().
2. Click the Callers-Callees tab.
The Callers-Callees tab shows that bounce() calls only one function, bounce_a().
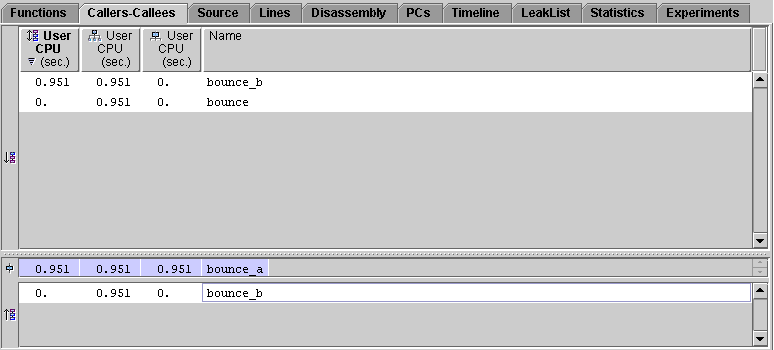
The Callers-Callees tab now displays information for bounce_a():
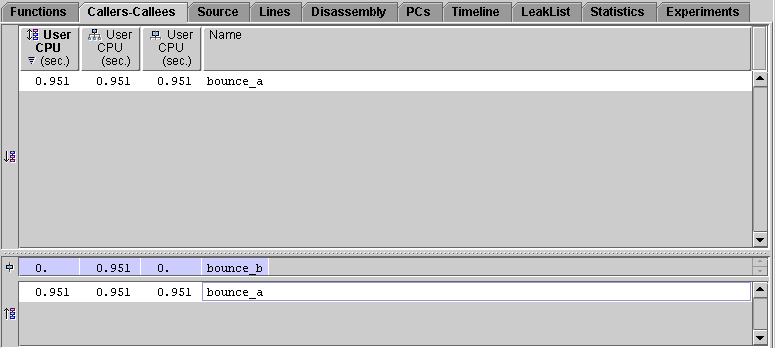
The Callers-Callees tab now displays information for bounce_b(). Function bounce_a() appears in both the Callers pane and the Callees pane. The callee attributed time is shown correctly, because bounce_b() is not a leaf function, and accumulates inclusive time from its call to the instance of bounce_a() in which the work is done.
This section demonstrates how the Performance Analyzer displays information for shared objects and how it handles calls to functions that are part of a dynamically linked shared object that can be loaded at different places at different times.
The synprog directory contains two dynamically linked shared objects, so_syn.so and so_syx.so. In the course of execution, synprog first loads so_syn.so and makes a call to one of its functions, so_burncpu(). Then it unloads so_syn.so, loads so_syx.so at what happens to be the same address, and makes a call to one of the so_syx.so functions, sx_burncpu(). Then, without unloading so_syx.so, it loads so_syn.so again--at a different address, because the address where it was first loaded is still being used by another shared object--and makes another call to so_burncpu().
The functions so_burncpu() and sx_burncpu() perform identical operations, as you can see if you examine their source code. Therefore they should take the same amount of User CPU time to execute.
The addresses at which the shared objects are loaded are determined at run time, and the run-time loader chooses where to load the objects.
This example demonstrates that the same function can be called at different addresses at different points in the program execution, that different functions can be called at the same address, and that the Performance Analyzer deals correctly with this behavior, aggregating the data for a function regardless of the address at which it appears.
2. Choose View  Show/Hide Functions.
The Show/Hide Functions dialog box lists all the load objects used by the program when it ran.
3. Click Clear All, select so_syx.so and so_syn.so, then click Apply.
The functions for all the load objects except the two selected objects no longer appear in the function list. Their entries are replaced by a single entry for the entire load object.
The list of load objects in the Functions tab includes only the load objects for which metrics were recorded, so it can be shorter than the list in the Show/Hide Functions dialog box.
4. In the Functions tab, examine the metrics for sx_burncpu() and so_burncpu().

so_burncpu() performs operations identical to those of sx_burncpu(). The user CPU time for so_burncpu() is almost exactly twice the user CPU time for sx_burncpu() because so_burncpu() was executed twice. The Performance Analyzer recognized that the same function was executing and aggregated the data for it, even though it appeared at two different addresses in the course of program execution.
This part of the example illustrates different ways of creating descendant processes and how they are handled, and demonstrates the Timeline display to get an overview of the execution of a program that creates descendant processes. The program forks two descendant processes. The parent process does some work, then calls popen, then does some more work. The first descendant does some work and then calls exec. The second descendant calls system, then calls fork. The descendant from this call to fork immediately calls exec. After doing some work, the descendant calls exec again and does some more work.
1. Collect another experiment and restart the Performance Analyzer.
% cd work-directory/synprog % collect -F on synprog icpu.popen.cpu so.sx.exec system.forkexec % analyzer test.2.er & |
This command loads the founder and all of its descendant experiments, but data is only loaded for the founder experiment. To load data for the descendant experiments, choose the View->Filter Data, then select "Enable All", then click "OK" or "Apply". Note that you could also open the experiment test.2.er in the existing analyzer and then add the descendant experiments. If you do this you must open the Add Experiment dialog box once for each descendant experiment and type test.2.er/descendant-name in the text box, then click OK. You cannot navigate to the descendant experiments to select them: you must type in the name. The list of descendant names is: _f1.er, _f1_x1.er, _f2.er, _f2_f1.er, _f2_f1_x1.er, _f2_f1_x1_x1.er. You must add the experiments in this order, otherwise the remaining instructions in this part of the example do not match the experiments you see in the Performance Analyzer.
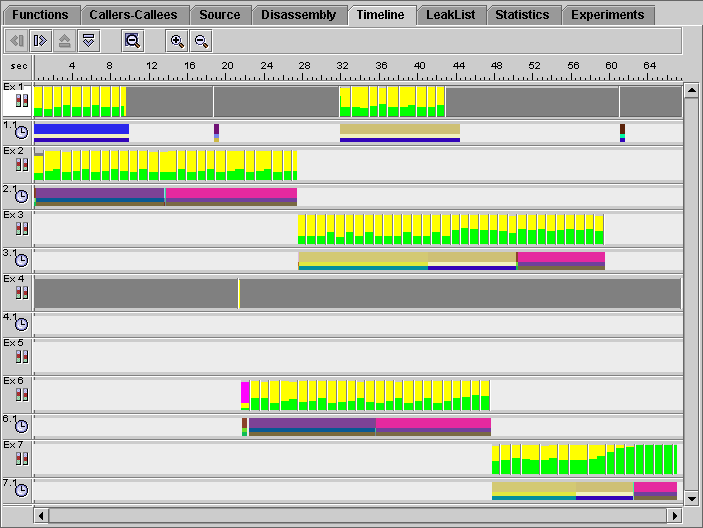
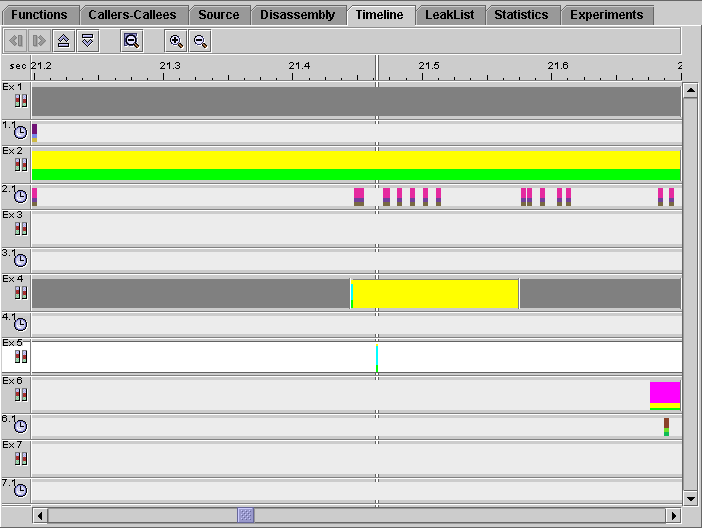
The topmost bar for each experiment is the samples bar. The next bar contains the clock-based profiling event data.
Some of the samples are colored yellow and green. The green color indicates that the process is running in User CPU mode. The fraction of time spent in User CPU mode is given by the proportion of the sample that is colored green. Because there are three processes running most of the time, only about one-third of each sample is colored green. The rest is colored yellow, which indicates that the process is waiting for the CPU. This kind of display is normal when there are more processes running than there are CPUs to run on. When the parent process (experiment 1) has finished executing and is waiting for its children to finish, the samples for the running processes are half green and half yellow, showing that there are only two processes contending for the CPU. When the process that generates experiment 3 has completed, the remaining process (experiment 7) is able to use the CPU exclusively, and the samples in experiment 7 show all green after that time.
3. Click the sample bar for experiment 7 in the region that shows half yellow and half green samples.
4. Zoom in so that you can see the individual event markers.
You can zoom in by dragging through the region you want to zoom in to, or clicking the zoom in button  , or choosing Timeline
  Zoom In x2, or typing Alt-T, I.
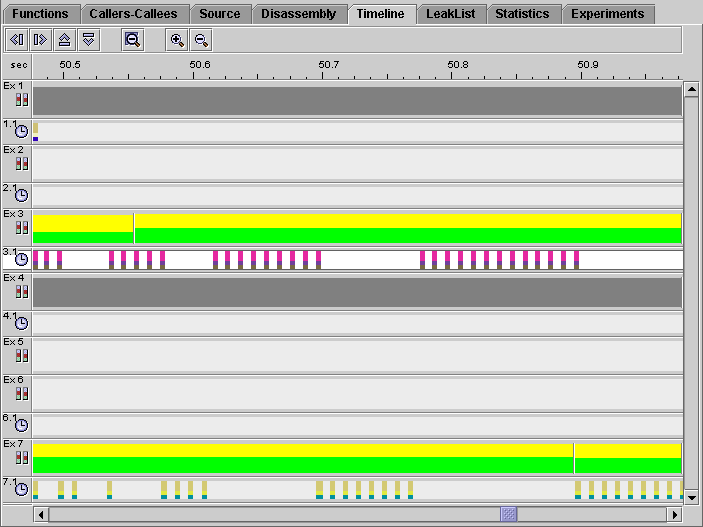
There are gaps between the event markers in both experiment 3 and experiment 7, but the gaps in one experiment occur where there are event markers in the other experiment. These gaps show where one process is waiting for the CPU while the other process is executing.
5. Reset the display to full width.
You can reset the display by clicking the Reset Display button  , or choosing Timeline
  Reset Display, or typing Alt-T, R.
Some experiments do not extend for the entire length of the run. This situation is indicated by a light gray color for the regions of time where these experiments do not have any data (see FIGURE 2-11). Experiments 3, 5, 6, and 7 are created after their parent processes have done some work. Experiments 2, 5, and 6 are terminated by a successful call to exec. Experiment 3 ends before experiment 7 and its process terminates normally. The points at which exec is called show clearly: the data for experiment 3 starts where the data for experiment 2 ends, and the data for experiment 7 starts where the data for experiment 6 ends.
6. Click the Experiments tab, then click the turner for test.2.er.
The experiments that are terminated by a successful call to exec show up as "bad experiments" in the Experiments tab. The experiment icon has a cross in a red circle superimposed on it.
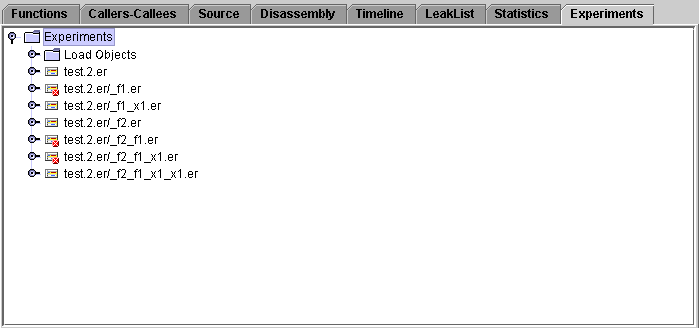
7. Click the turner for test.2.er/_f1.er.
At the bottom of the text pane is a warning that the experiment terminated abnormally. Whenever a process successfully calls exec, the process image is replaced and the collector library is unloaded. The normal completion of the experiment cannot take place, and is done instead when the experiment is loaded into the Analyzer.
The dark gray regions in the samples bars indicate time spent waiting, other than waiting for the CPU or for a user lock. The first dark gray region in experiment 1 (the experiment for the founding process) occurs during the call to popen. Most of the time is spent waiting, but there are some events recorded during this time. In this region, the process created by popen is using CPU time and competing with the other processes, but it is not recorded in an experiment. Similarly, the first dark gray region in experiment 4 occurs during a call to system. In this case the calling process waits until the call is complete, and does no work until that time. The process created by the call to system is also competing with the other processes for the CPU, and does not record an experiment.
The last gray region in experiment 1 occurs when the process is waiting for its descendants to complete. The process that records experiment 4 calls fork after the call to system is complete, and then waits until all its descendant processes have completed. This wait time is indicated by the last gray region. In both these cases, the waiting processes do no work and have no descendants that are not recording experiments.
Experiment 4 spends most of its time waiting. As a consequence, it records no profiling data until the very end of the experiment.
Experiment 5 appears to have no data at all. It is created by a call to fork that is immediately followed by a call to exec.
9. Zoom in on the boundary between the two gray regions in experiment 4.
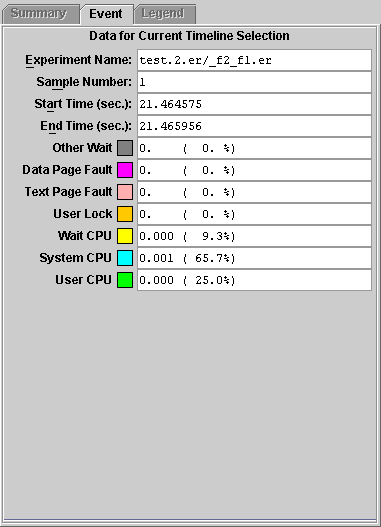
At sufficiently high zoom, you can see that there is a very small sample in experiment 5.
10. Click the sample in experiment 5 and look at the Event tab.
The experiment recorded an initial sample point and a sample point in the call to exec, but did not last long enough to record any profiling data. This is the reason why there is no profiling data bar for experiment 5.
If you have access to a computer with more than one processor, repeat the data collection. What differences do you see in the Timeline display?
This example shows how to collect and analyze performance data for an application written in the Java programming language that calls C++ methods. It illustrates the timeline of the program execution and how performance data for the program is presented in the Performance Analyzer GUI. The process for collecting/analyzing data as described in this chapter can be used for mixed-language applications and programs written entirely in the Java programming language.
The jsynprog experiment is a simple application designed to demonstrate the amount of time it takes to perform various tests, such as vector/array manipulation, recursion, integer/double addition, memory allocation, system calls, and calls to native code using JNI. The experiment consists of the following individual source files:
Control flow through the experiment begins and ends with jsynprog.main. While in main, the program performs the following individual tests, in the following order, by calling methods of other classes such as Routine.memalloc and Sub_Routine.add_double.
Read the instructions in the sections, Setting Up the Examples for Execution and Basic Features of the Performance Analyzer, if you have not done so. Compile jsynprog before you begin this example.
To collect data for jsynprog and start the Performance Analyzer, type the following at the command line:
% cd work-directory/jsynprog % make collect % analyzer test.1.er & |
Loading the performance data takes a few seconds, and no information will appear in the GUI until all data has finished loading. A progress bar in the upper right corner of the screen will keep you informed of the data currently being loaded.
You are now ready to analyze the jsynprog experiment using the procedures presented in the following section.
Analyzing jsynprog Program Data
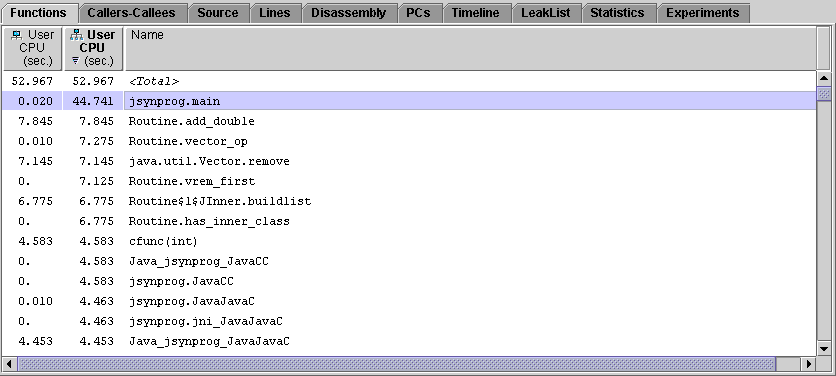
The Functions tab contains a list of all functions for which performance data was recorded, together with metrics that are derived from the performance data. The performance data is aggregated to obtain metrics for each function. The term "functions" includes both Java and C++ methods.
In the default display, the first column of metrics is Exclusive User CPU time: time spent inside a function. The second column of metrics is Inclusive User CPU time: time spent inside a function and in any function that it calls. The list is sorted by the data in the first column.
When all experiment data has finished loading, the functions tab will be selected, showing the most costly routines (ranked in terms of user CPU time), and many of the various tests are shown to take several seconds. At the top of the function list is an artificial function, <Total>. This artificial function represents the entire program.
In the Java representation, the artificial function <no Java callstack recorded> indicates that the Java virtual machine did not report a Java callstack, even though a Java program was running. (The JVM will do so when necessary to avoid deadlocks, or when unwinding the Java stack will cause excessive synchronization).
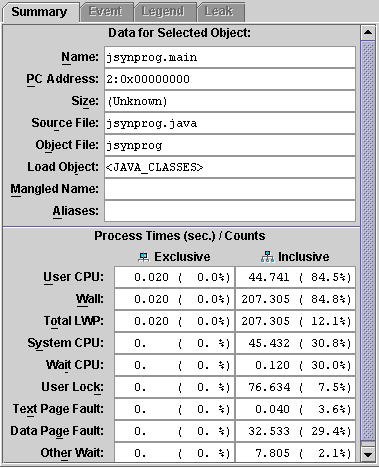
Click on the column header for Inclusive User CPU time, and select the top function: jsynprog.main.
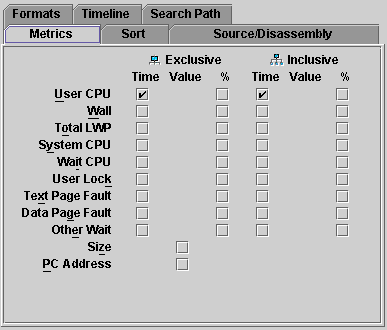
The full set of clock profiling metrics and selected object attributes are summarized on the right panel.
Additional metrics and metric presentations can be added to the main display using the View/Set Data Presentation/Metrics dialog.
2. Viewing callers-callees data
With the jsynprog.main function selected, click on the callers-callees tab. Note how the test functions described in the overview appear in the list of callees.
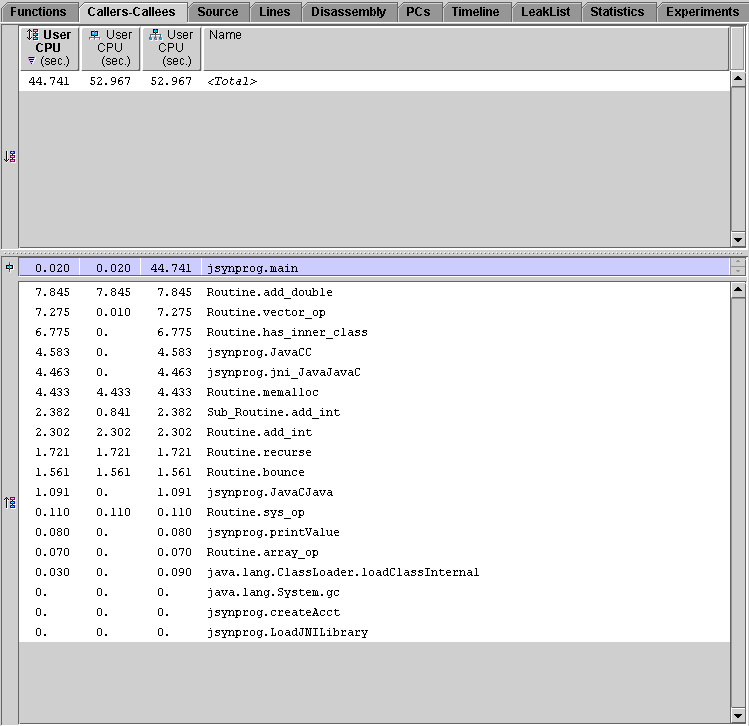
The first three (most expensive) functions listed are Routine.add_double, Routine.vector_op, and Routine.has_inner_class. The callers-callees display features a dynamic call tree that you can navigate through by selecting a function from the top (caller) or bottom (callee) panels. For example, select Routine.has_inner_class from the list of callees, and notice how the display redraws centered on it, listing an inner class as its most important callee. To return to the caller of this function, simply select jsynprog.main from the top panel. You can use this procedure to navigate through the entire experiment. Take a minute to navigate through the various Routine functions, ending back at jsynprog.main.
With jsynprog.main still selected, click on the source tab. The source code for jsynprog.java appears, with performance numbers for the various lines where jsynprog.main invokes some other method.
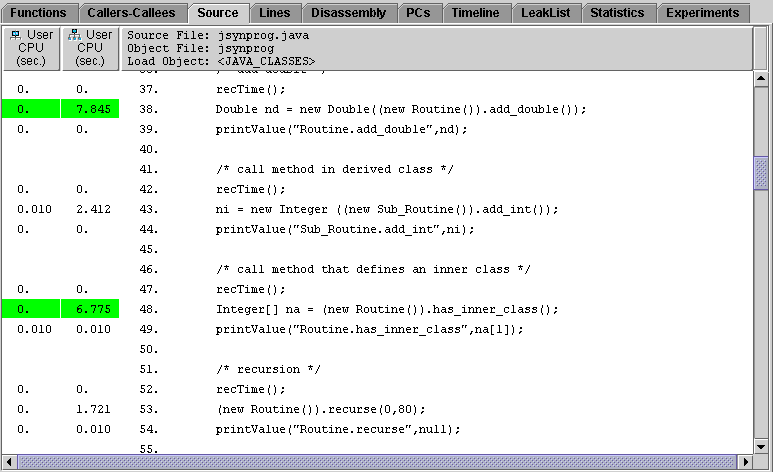
This particular screen shot shows two expensive method calls highlighted in green: add_double (7.845 seconds) and has_inner_class (6.775 seconds). Scrolling up and down the source code listing will reveal other expensive calls, also highlighted in green. You may also notice some lines that appear in red italicized text, such as Routine.add_int <instructions without line numbers>. This represents HotSpot compiled versions of the named function, since HotSpot does not provide bytecode indices for the PCs from these instructions.
If the analyzer was unable to locate your source files, try setting the path explicitly using the View/Set Data Presentation/Search Path dialog. The path to add is the root directory of your sources.
Click on the disassembly tab to view the annotated bytecode with Java source interleaved.
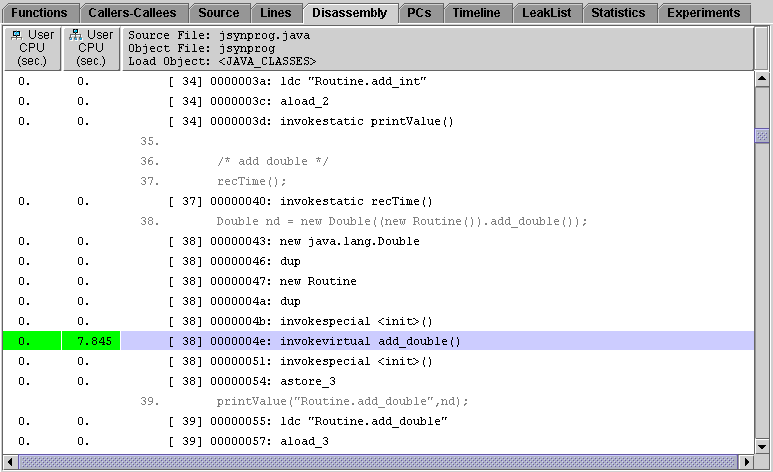
As before, this view shows both Exclusive and Inclusive User CPU times, with the most expensive calls highlighted in green. In this view the Java bytecode appears in black, while its corresponding Java source appears in light gray. You may also notice that, similar to the Source tab, the Disassembly tabs provides lines in red italicized text such as Routine.add_int <HotSpot-compiled leaf instructions>. As before, this represents the HotSpot compiled version of the named function.
The Performance Analyzer displays a timeline of the events that it records in a graphical format. The progress of the program's execution and the calls made by the program can be tracked using this display.
To display the timeline, click the Timeline tab.
The data is displayed in horizontal bars. The colored rectangles in each bar represent the recorded events. The colored area appears to be continuous when the events are closely spaced, but at high zoom the individual events are resolved.
For each experiment, the global data is displayed in the topmost bar. This bar is labeled with the experiment number (Ex 1) and an icon. The colored rectangles in the global data bar are called samples. The global data bar is also called the samples bar. Samples represent timing data for the process as a whole. The timing data includes times for all the LWPs, whether they are displayed in the timeline or not.
The event data is displayed below the global data. The display contains one event bar for each LWP (lightweight process) for each data type. The colored rectangles in the event bars are called event markers. Each marker represents a part of the call stack for the event. Each function in the call stack is color coded. The color coding for the functions is displayed in the Legend tab in the right pane.
In the Java representation, the timeline for this experiment appears as follows:

The bar labeled 1.1 is the user thread. Click on any part of it to find out which function was executing at that particular point in time. The data will be displayed in the Event tab on the right side of the screen. You can toggle between the Summary, Event, and Legend tabs for information about what was happening at any given point in time. You can use the left/right arrows located at the top of the analyzer screen to step back or forward to the previous/next recorded event. You can also use the up/down arrows to step though the various threads.
Switching to the Expert-Java representation reveals the following additional threads.
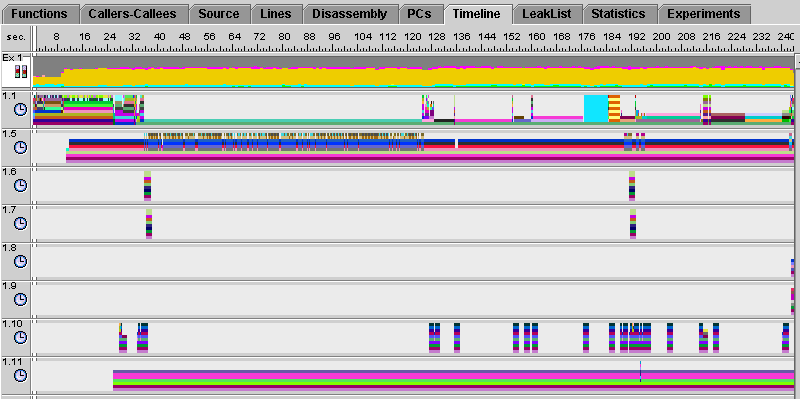
In this representation, there are three threads of interest: the user thread, the Garbage Collector (GC) thread, and the HotSpot compiler thread. In the above display, these threads are numbered 1.1, 1.5, and 1.10, respectively. If you compare the user thread from this Expert-Java representation against the previous Java-representation display, you'll notice some extra activity in the first 30 seconds of the run. Clicking anywhere in this area reveals this callstack to be JVM activity. Next, notice the burst of activity in the GC thread between 30 and 120 seconds. The Routine.memalloc test repeatedly allocates large amounts of memory, which causes the garbage collector to check periodically for memory that can be reclaimed. Finally notice the shorts bursts of activity that repeatedly appear in the HotSpot compiler thread. This indicates that HotSpot has dynamically compiled the code shortly after the start of each task.
6. Examine the Interpreted vs.Compiled Methods
While still in the Expert-Java representation, return once again to the functions tab. Alphabetically sort the list by selecting "Name" at the top of the screen, then scroll down to the list of Routine methods. You may notice that some methods have duplicate entries, as shown in the following figure.
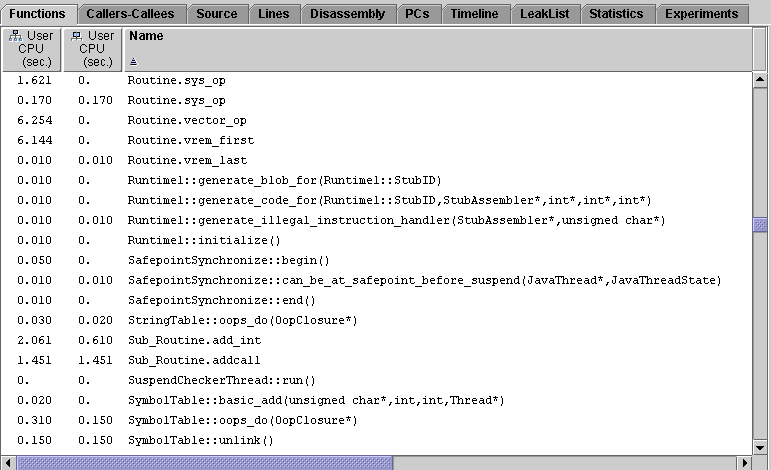
In this example, the method Routine.sys_op appears twice: one is the interpreted version, and the other is the version that was dynamically compiled by the HotSpot virtual machine. To determine which is which, select one of the methods and examine the Load Object field of the Summary tab on the right side of the screen. In this example, selecting the first occurrence of Routine.sys_op reveals that it comes from the load object <JAVA_COMPILED_METHODS>, indicating that this is the dynamically-compiled version. Selecting the second occurrence reveals the load object to be <JAVA_CLASSES>, indicating that this is the interpreted version.
The HotSpot virtual machine does not dynamically compile methods that only execute for short periods of time. Therefore, methods listed only once will always be the interpreted versions.
The Fortran program omptest uses OpenMP parallelization and is designed to test the efficiency of parallelization strategies for two different cases:
See the Fortran Programming Guide for background on parallelization strategies and OpenMP directives. When the compiler identifies an OpenMP directive, it generates special functions and calls to the threads library. These functions appear in the Performance Analyzer display. For more information, see Parallel Execution and Compiler-Generated Body Functions and Compiler-Generated Body Functions. Messages from the compiler about the actions it has taken appear in the annotated source and disassembly listings.
Read the instructions in the sections, Setting Up the Examples for Execution and Basic Features of the Performance Analyzer, if you have not done so. Compile omptest before you begin this example.
In this example you generate two experiments: one that is run with 4 CPUs and one that is run with 2 CPUs. The experiments are labeled with the number of CPUs.
To collect data for omptest, type the following commands in the C shell.
% cd ~/work-directory/omptest % setenv PARALLEL 4 % collect -o omptest.4.er omptest % setenv PARALLEL 2 % collect -o omptest.2.er omptest % unsetenv PARALLEL |
If you are using the Bourne shell or the Korn shell, type the following commands.
$ cd ~/work-directory/omptest $ PARALLEL=4; export PARALLEL $ collect -o omptest.4.er omptest $ PARALLEL=2; export PARALLEL $ collect -o omptest.2.er omptest $ unset PARALLEL |
The collection commands are included in the makefile, so in any shell you can type the following commands.
$ cd ~/work-directory/omptest $ make collect |
To start the Performance Analyzer for both experiments, type:
$ analyzer omptest.4.er & $ analyzer omptest.2.er & |
You are now ready to analyze the omptest experiment using the procedures in the following sections.
This section compares the performance of two routines, psec_() and pdo_(), that use the PARALLEL SECTIONS directive and the PARALLEL DO directive. The performance of the routines is compared as a function of the number of CPUs.
To compare the four-CPU run with the two-CPU run, you must have two Analyzer windows, with omptest.4.er loaded into one, and omptest.2.er loaded into the other.
1. In the Functions tab of each Performance Analyzer window, find and select psec_.
You can use the Find tool to find this function. Note that there are other functions that start with psec_ which have been generated by the compiler.
2. Position the windows so that you can compare the Summary tabs.
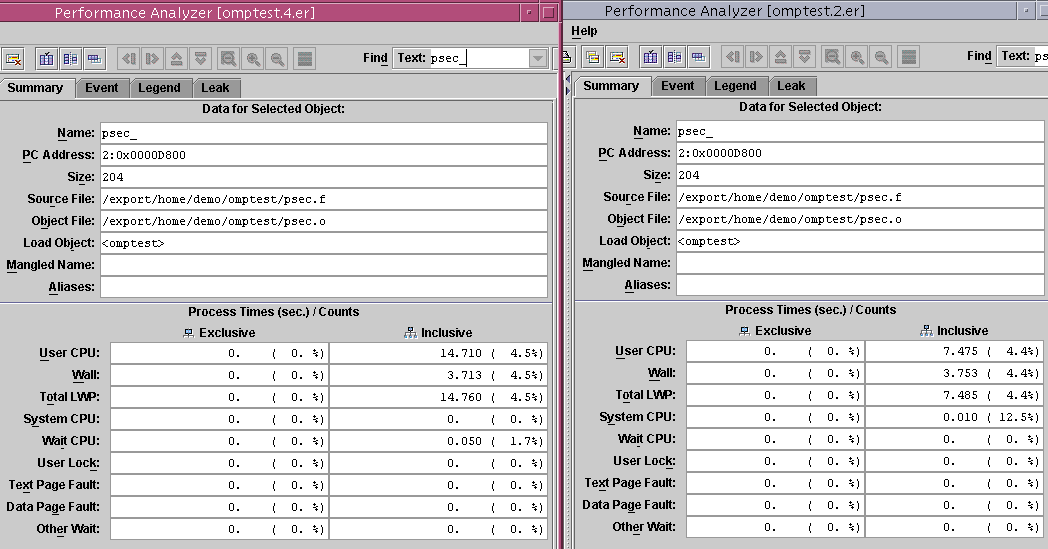
3. Compare the inclusive metrics for user CPU time, wall clock time, and total LWP time.
For the two-CPU run, the ratio of wall clock time to either user CPU time or total LWP is about 1 to 2, which indicates relatively efficient parallelization.
For the four-CPU run, psec_() takes about the same wall clock time as for the two-CPU run, but both the user CPU time and the total LWP time are higher. There are only two sections within the psec_() PARALLEL SECTION construct, so only two threads are required to execute them, using only two of the four available CPUs at any given time. The other two threads are spending CPU time waiting for work. Because there is no more work available, the time is wasted.
4. In each Analyzer window, click the line containing pdo_ in the Function List display.
The data for pdo_() is now displayed in the Summary Metrics tabs.
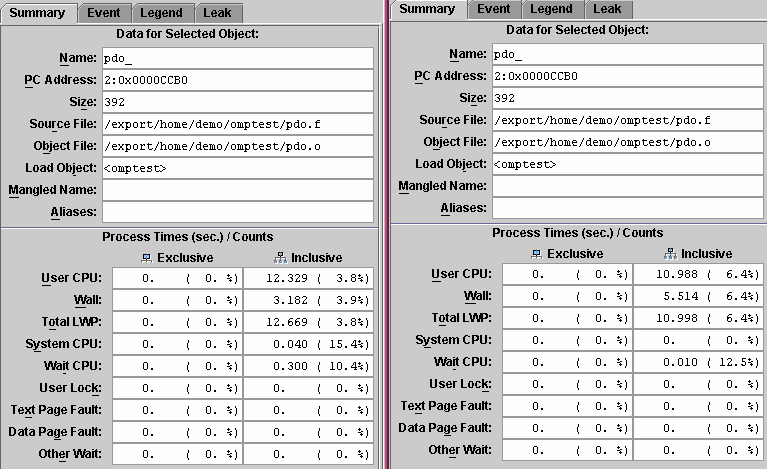
5. Compare the inclusive metrics for user CPU time, wall-clock time, and total LWP.
The user CPU time for pdo_() is about the same as for psec_(). The ratio of wall-clock time to user CPU time is about 1 to 2 on the two-CPU run, and about 1 to 4 on the four-CPU run, indicating that the pdo_() parallelizing strategy scales much more efficiently on multiple CPUs, taking into account how many CPUs are available and scheduling the loop appropriately.
6. Close the Analyzer window that is displaying omptest.2.er.
This section compares the performance of two routines, critsec_() and reduc_(), in which the CRITICAL SECTIONS directive and REDUCTION directive are used. In this case, the parallelization strategy deals with an identical assignment statement embedded in a pair of do loops. Its purpose is to sum the contents of three two-dimensional arrays.
t = (a(j,i)+b(j,i)+c(j,i))/k sum = sum+t |
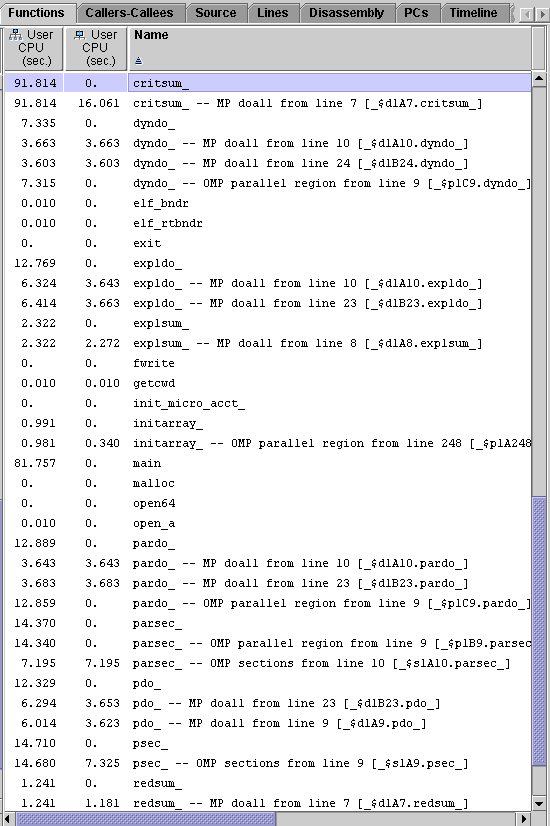
1. For the four-CPU experiment, omptest.4.er, locate critsum_ and redsum_ in the Functions tab.
2. Compare the inclusive user CPU time for the two functions.
The inclusive user CPU time for critsum_() is much larger than for redsum_(), because critsum_() uses a critical section parallelization strategy. Although the summing operation is spread over all four CPUs, only one CPU at a time is allowed to add its value of t to sum. This is not a very efficient parallelization strategy for this kind of coding construct.
The inclusive user CPU time for redsum_() is much smaller than for critsum_(). This is because redsum_() uses a reduction strategy, by which the partial sums of (a(j,i)+b(j,i)+c(j,i))/k are distributed over multiple processors, after which these intermediate values are added to sum. This strategy makes much more efficient use of the available CPUs.
The mttest program emulates the server in a client-server, where clients queue requests and the server uses multiple threads to service them, using explicit threading. Performance data collected on mttest demonstrates the sorts of contentions that arise from various locking strategies, and the effect of caching on execution time.
The executable mttest is compiled for explicit multithreading, and it will run as a multithreaded program on a machine with multiple CPUs or with one CPU. There are some interesting differences and similarities in its performance metrics between a multiple CPU system and a single CPU system.
Read the instructions in the sections, Setting Up the Examples for Execution and Basic Features of the Performance Analyzer, if you have not done so. Compile mttest before you begin this example.
In this example you generate two experiments: one that is run with 4 CPUs and one that is run with 1 CPU. The experiments record synchronization wait tracing data as well as clock data. The experiments are labeled with the number of CPUs.
To collect data for mttest and start the Performance Analyzer, type the following commands.
% cd work-directory/mttest % collect -s on -o mttest.4.er mttest % collect -s on -o mttest.1.er mttest -u % analyzer mttest.4.er & % analyzer mttest.1.er & |
The collect commands are included in the makefile, so instead you can type the following commands.
% cd work-directory/mttest % make collect % analyzer mttest.4.er & % analyzer mttest.1.er & |
After you have loaded the two experiments, position the two Performance Analyzer windows so that you can see them both.
You are now ready to analyze the mttest experiment using the procedures in the following sections.
1. Find lock_local and lock_global in the Functions tab for the four-CPU experiment, mttest.4.er.
Both functions have approximately the same inclusive user CPU time, so they are doing the same amount of work. However, lock_global() has a high synchronization wait time, whereas lock_local() has none.
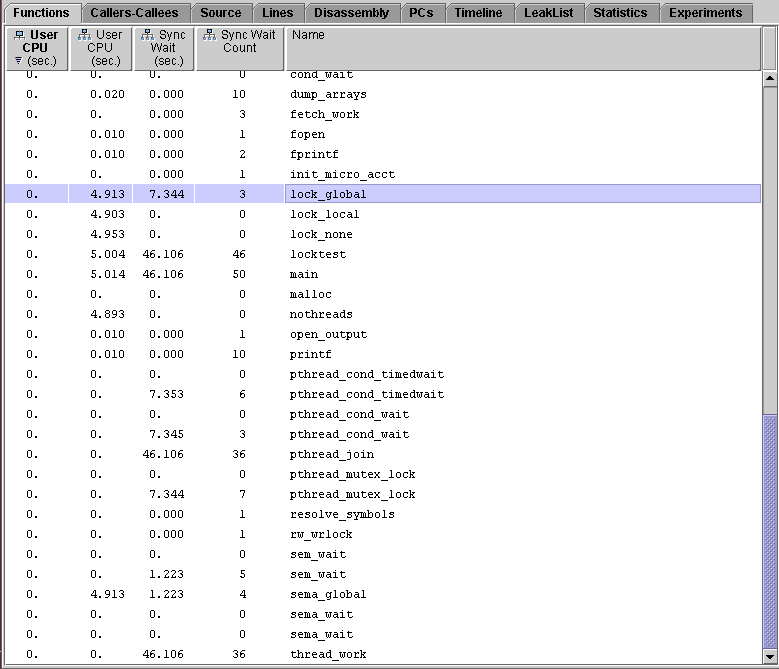
The annotated source code for the two functions shows why this is so.
2. Click lock_global, then click the Source tab.
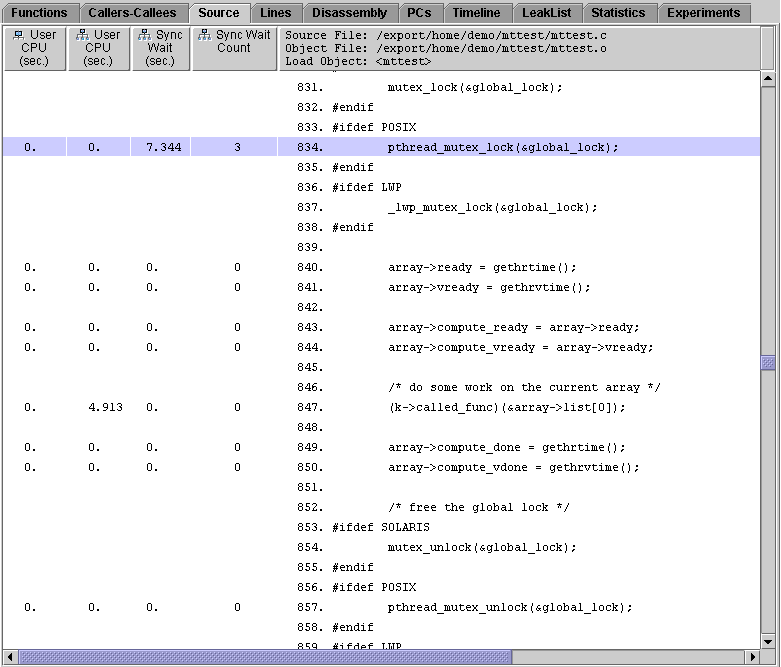
lock_global() uses a global lock to protect all the data. Because of the global lock, all running threads must contend for access to the data, and only one thread has access to it at a time. The rest of the threads must wait until the working thread releases the lock to access the data. This line of source code is responsible for the synchronization wait time.
3. Click lock_local in the Functions tab, then click the Source tab.
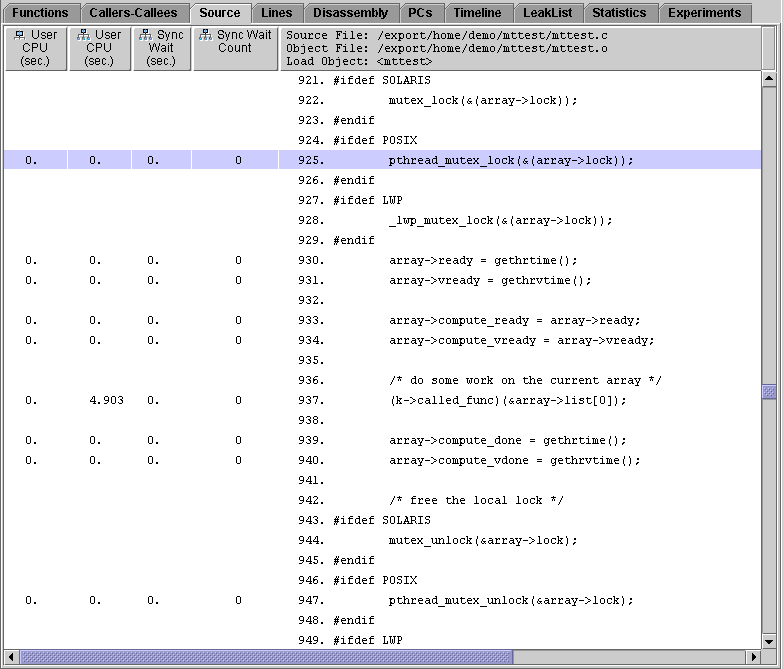
lock_local() only locks the data in a particular thread's work block. No thread can have access to another thread's work block, so each thread can proceed without contention or time wasted waiting for synchronization. The synchronization wait time for this line of source code, and hence for lock_local(), is zero.
4. Change the metric selection for the one-CPU experiment, mttest.1.er:
a. Choose View  Set Data Presentation.
b. Clear Exclusive User CPU Time and Inclusive Synchronization Wait Counts.
c. Select Inclusive Total LWP Time, Inclusive Wait CPU Time and Inclusive Other Wait Time.
5. In the Functions tab for the one-CPU experiment, find lock_local and lock_global.
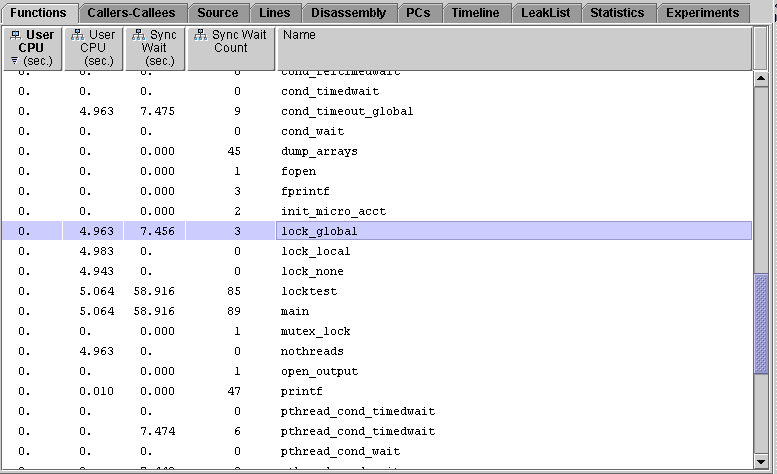
As in the four-CPU experiment, both functions have the same inclusive user CPU time, and therefore are doing the same amount of work. The synchronization behavior is also the same as on the four-CPU system: lock_global() uses a lot of time in synchronization waiting but lock_local() does not.
However, total LWP time for lock_global() is actually less than for lock_local(). This is because of the way each locking scheme schedules the threads to run on the CPU. The global lock set by lock_global() allows each thread to execute in sequence until it has run to completion. The local lock set by lock_local() schedules each thread onto the CPU for a fraction of its run and then repeats the process until all the threads have run to completion. In both cases, the threads spend a significant amount of time waiting for work. The threads in lock_global() are waiting for the lock. This wait time appears in the Inclusive Synchronization Wait Time metric and also the Other Wait Time metric. The threads in lock_local() are waiting for the CPU. This wait time appears in the Wait CPU Time metric.
6. Restore the metric selection to the default values for mttest.1.er.
In the Set Data Presentation dialog box, which should still be open, do the following:
a. Select Exclusive User CPU Time and Inclusive Synchronization Wait Counts.
b. Clear Inclusive Total LWP Time, Inclusive Wait CPU Time and Inclusive Other Wait Time in the Time column.
1. Find computeA and computeB in the Functions tab of both Performance Analyzer window.
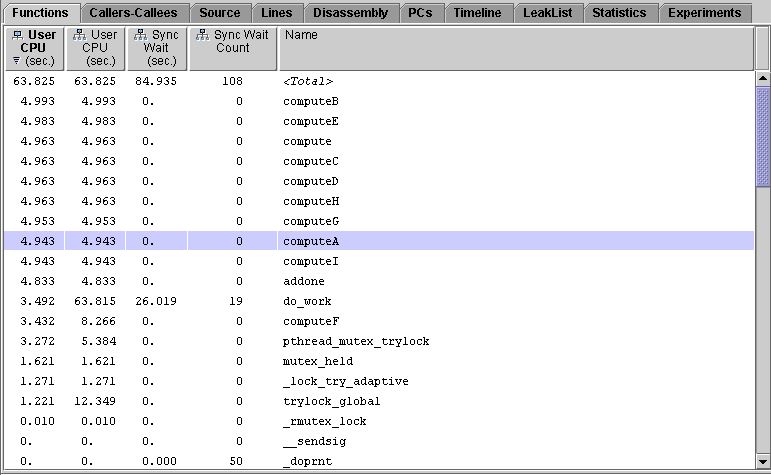
In the one-CPU experiment, mttest.1.er, the inclusive user CPU time for computeA() is almost the same as for computeB().
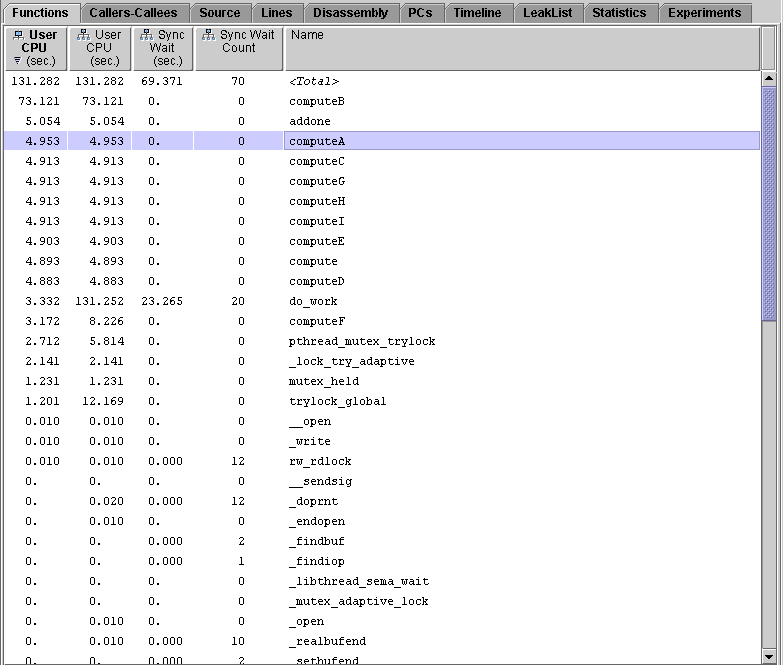
In the four-CPU experiment, mttest.4.er, computeB() uses much more inclusive user CPU time than computeA().
The remaining instructions apply to the four-CPU experiment, mttest.4.er.
2. Click computeA, then click the Source tab. Scroll down so that the source for both computeA() and computeB() is displayed.
The code for these functions is identical: a loop adding one to a variable. All the user CPU time is spent in this loop. To find out why computeB() uses more time than computeA(), you must examine the code that calls these two functions.
3. Use the Find tool to find cache_trash. Repeat the search until the source code for cache_trash()is displayed.
Both computeA() and computeB() are called by reference using a pointer, so their names do not appear in the source code.
You can verify that cache_trash() is the caller of computeB() by selecting computeB() in the Function List display then clicking Callers-Callees.
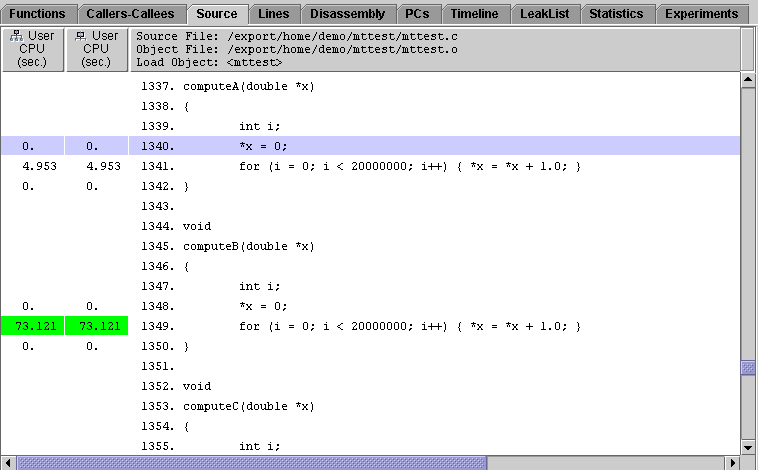
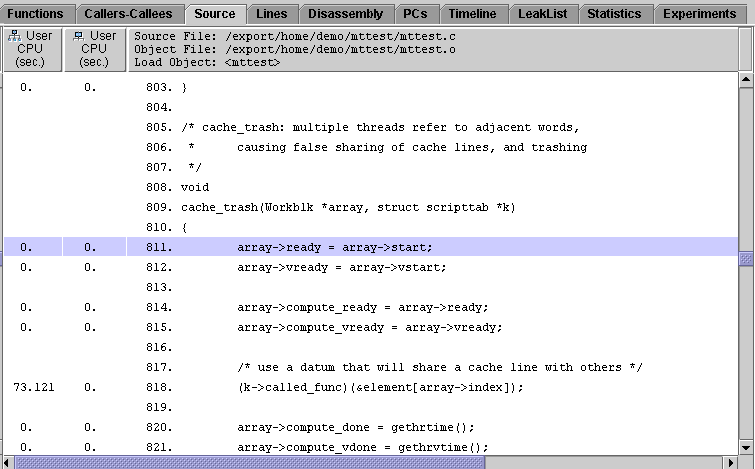
4. Compare the calls to computeA() and computeB().
computeA() is called with a double in the thread's work block as an argument (&array->list[0]), that can be read and written to directly without danger of contention with other threads.
computeB(), however, is called with doubles in each thread that occupy successive words in memory (&element[array->index]). These words share a cache line. Whenever a thread writes to one of these addresses in memory, any other threads that have that address in their cache must delete the data, which is now invalid. If one of the threads needs the data again later in the program, the data must be copied back into the data cache from memory, even if the data item that is needed has not changed. The resulting cache misses, which are attempts to access data not available in the data cache, waste a lot of CPU time. This explains why computeB() uses much more user CPU time than computeA() in the four-CPU experiment.
In the one-CPU experiment, only one thread is running at a time and no other threads can write to memory. The running thread's cache data never becomes invalid. No cache misses or resulting copies from memory occur, so the performance for computeB() is just as efficient as the performance for computeA() when only one CPU is available.
1. If you are using a computer that has hardware counters, run the four-CPU experiment again and collect data for one of the cache hardware counters, such as cache misses or stall cycles. On UltraSPARC® III hardware you can use the command
% collect -p off -h dcstall -o mttest.3.er mttest |
 Add. Examine the hardware counter data for ComputeA and ComputeB in the Functions tab and the Source tab.
2. The makefile contains optional settings for compilation variables that are commented out. Try changing some of these options and see what effect the changes have on program performance. The compilation variable to edit is OFLAGS.
This example addresses the issue of efficient data access and optimization. It uses two implementations of a matrix-vector multiplication routine, dgemv, which is included in standard BLAS libraries. Three copies of the two routines are included in the program. The first copy is compiled without optimization, to illustrate the effect of the order in which elements of an array are accessed on the performance of the routines. The second copy is compiled with -O2, and the third with -fast, to illustrate the effect of compiler loop reordering and optimization.
This example illustrates the use of hardware counters and compiler commentary for performance analysis. You must run this example on UltraSPARC III hardware.
Read the instructions in the sections, Setting Up the Examples for Execution and Basic Features of the Performance Analyzer, if you have not done so. Compile cachetest before you begin this example.
In this example you generate several experiments with data collected from different hardware counters, as well as an experiment that contains clock-based data.
To collect data for cachetest and start the Performance Analyzer from the command line, type the following commands.
% cd work-directory/cachetest % collect -o flops.er -S off -p on -h fpadd,,fpmul cachetest % collect -o cpi.er -S off -p on -h cycles,,insts cachetest % collect -o dcstall.er -h dcstall cachetest |
The collect commands have been included in the makefile, so instead you can type the following commands.
% cd work-directory/cachetest % make collect |
The Performance Analyzer shows exclusive metrics only. This is different from the default, and has been set in a local defaults file. See Default-Setting Commands for more information.
You are now ready to analyze the cachetest experiment using the procedures in the following sections.
1. Start the analyzer on the floating point operations experiment.
% cd work-directory/cachetest % analyzer flops.er & |
2. Click the header of the Name column.
The functions are sorted by name, and the display is centered on the selected function, which remains the same.
3. For each of the six functions, dgemv_g1, dgemv_g2, dgemv_opt1, dgemv_opt2, dgemv_hi1, and dgemv_hi2, add the FP Adds and FP Muls counts and divide by the User CPU time and 106.
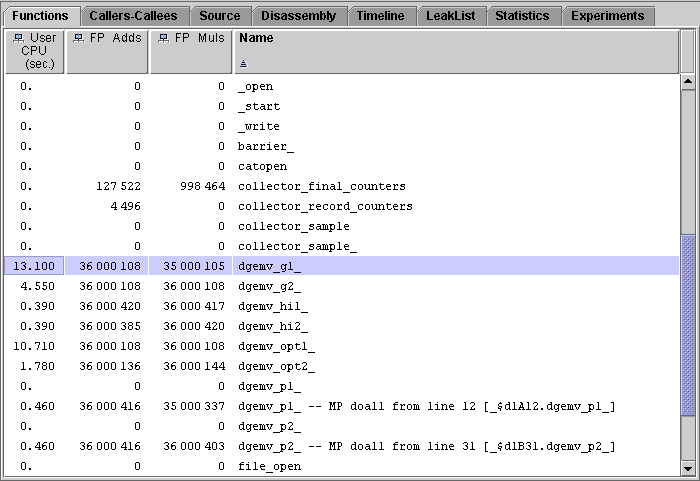
The numbers obtained are the MFLOPS counts for each routine. All of the subroutines have the same number of floating-point instructions issued but use different amounts of CPU time. (The variation between the counts is due to counting statistics.) The performance of dgemv_g2 is better than that of dgemv_g1, the performance of dgemv_opt2 is better than that of dgemv_opt1, but the performance of dgemv_hi2 and dgemv_hi1 are about the same.
4. Run cachetest without collecting performance data.
5. Compare the MFLOPS values obtained here with the MFLOPS values printed by the program.
The values computed from the data are lower because of the overhead for the data collection. The MFLOPS values computed by the program under data collection vary because the data collection overhead is different for different data types and for different hardware counters.
In this section, we examine the reasons why dgemv_g2 has better performance than dgemv_g1. If you already have the Performance Analyzer running, do the following:
1. Choose File  Open and open cpi.er.
2. Choose File  Add and add dcstall.er.
If you do not have the Performance Analyzer running, type the following commands at the prompt:
% cd work-directory/cachetest % analyzer cpi.er dcstall.er & |
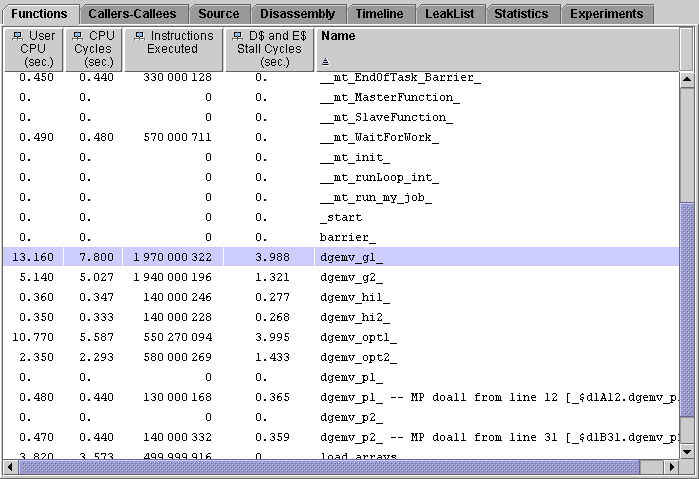
1. Compare the values for User CPU time and CPU Cycles.
There is a difference between these two metrics for dgemv_g1 because of DTLB (data translation lookaside buffer) misses. The system clock is still running while the CPU is waiting for a DTLB miss to be resolved, but the cycle counter is turned off. The difference for dgemv_g2 is negligible, indicating that there are few DTLB misses.
2. Compare the D- and E-cache stall times for dgemv_g1 and dgemv_g2.
There is less time spent waiting for the cache to be reloaded in dgemv_g2 than in dgemv_g1, because in dgemv_g2 the way in which data access occurs makes more efficient use of the cache.
To see why, we examine the annotated source code. First, to limit the data in the display we remove most of the metrics.
3. Choose View  Set Data Presentation and deselect the metrics for Instructions Executed and CPU Cycles in the Metrics tab.
4. Click dgemv_g1, then click the Source tab.
5. Resize and scroll the display so that you can see the source code for both dgemv_g1 and dgemv_g2.
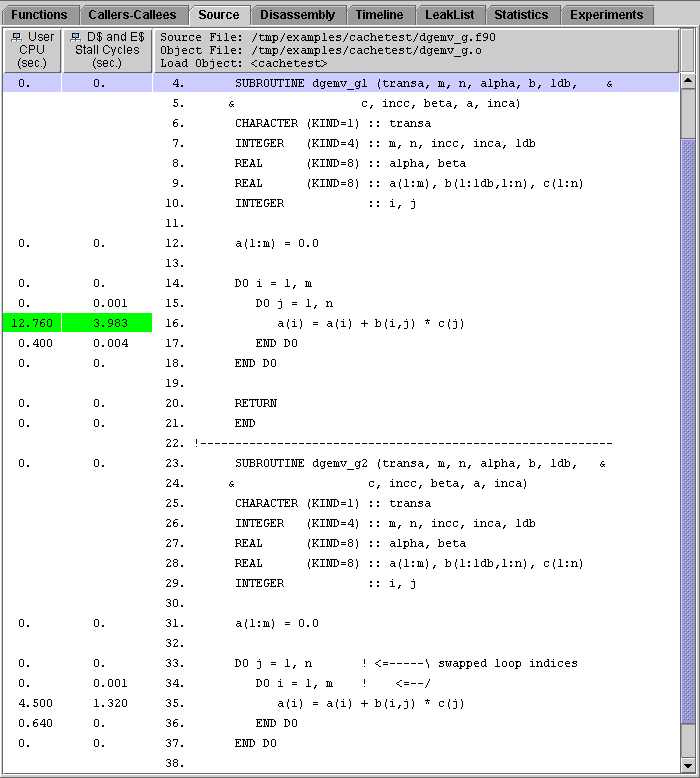
The loop structure in the two routines is different. Because the code is not optimized, the data in the array in dgemv_g1 is accessed by rows, with a large stride (in this case, 6000). This is the cause of the DTLB and cache misses. In dgemv_g2, the data is accessed by column, with a unit stride. Since the data for each loop iteration is contiguous, a large segment can be mapped and loaded into cache and there are cache misses only when this segment has been used and another is required.
In this section we examine the effect of two different optimization options on the program performance, -O2 and -fast. The transformations that have been made on the code are indicated by compiler commentary messages, which appear in the annotated source code.
1. Load the experiments cpi.er and dcstall.er into the Performance Analyzer.
If you have just completed the previous section, Choose View  Set Data Presentation and ensure that the metric for CPU Cycles as a time and the metric for Instructions Executed are selected.
If you do not have the Performance Analyzer running, type the following commands at the prompt:.
% cd work-directory/cachetest % analyzer cpi.er dcstall.er & |
2. Click the header of the Name column.
The functions are sorted by name, and the display is centered on the selected function, which remains the same.
3. Compare the metrics for dgemv_opt1 and dgemv_opt2 with the metrics for dgemv_g1 and dgemv_g2 (see FIGURE 2-37).
The source code is identical to that in dgemv_g1 and dgemv_g2. The difference is that they have been compiled with the -O2 compiler option. Both functions show about the same decrease in CPU time, whether measured by User CPU time or by CPU cycles, and about the same decrease in the number of instructions executed, but in neither routine is the cache behavior improved.
4. In the Functions tab, compare the metrics for dgemv_opt1 and dgemv_opt2 with the metrics for dgemv_hi1 and dgemv_hi2.
The source code is identical to that in dgemv_opt1 and dgemv_opt2. The difference is that they have been compiled with the -fast compiler option. Now both routines have the same CPU time and the same cache performance. Both the CPU time and the cache stall cycle time have decreased compared to dgemv_opt1 and dgemv_opt2. Waiting for the cache to be loaded takes about 80% of the execution time.
5. Click dgemv_hi1, then click the Source tab. Resize and scroll the display so that you can see the source for all of dgemv_hi1.
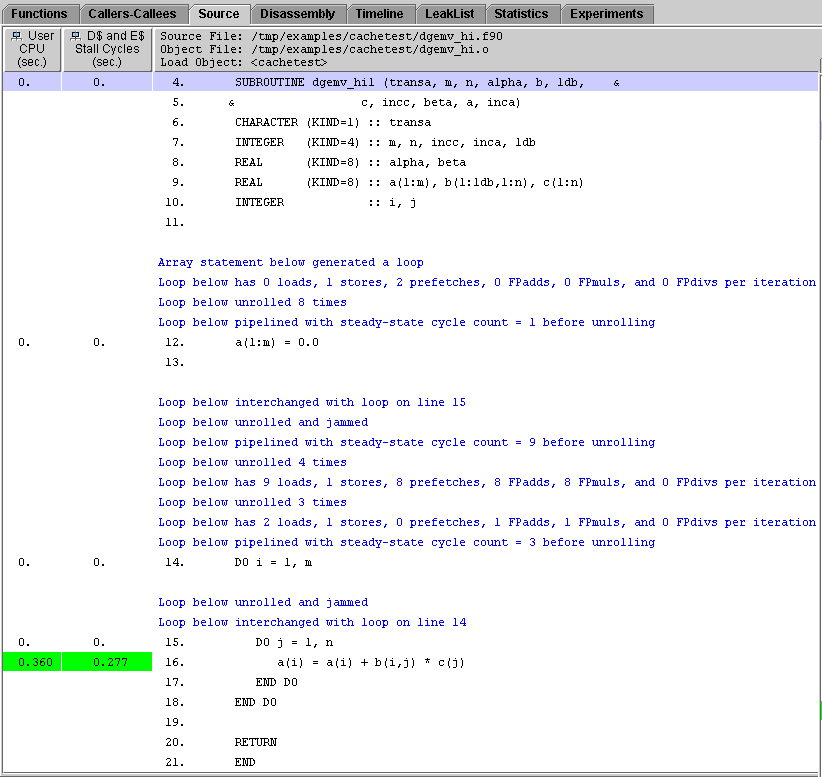
The compiler has done much more work to optimize this function. It has interchanged the loops that were the cause of the DTLB miss problems. In addition, the compiler has created new loops that have more floating-point add and floating-point multiply operations per loop cycle, and inserted prefetch instructions to improve the cache behavior.
Note that the messages apply to the loop that appears in the source code and any loops that the compiler generates from it.
6. Scroll down to see the source code for dgemv_hi2.
The compiler commentary messages are the same as for dgemv_hi1 except for the loop interchange. The code generated by the compiler for the two versions of the routine is now essentially the same.
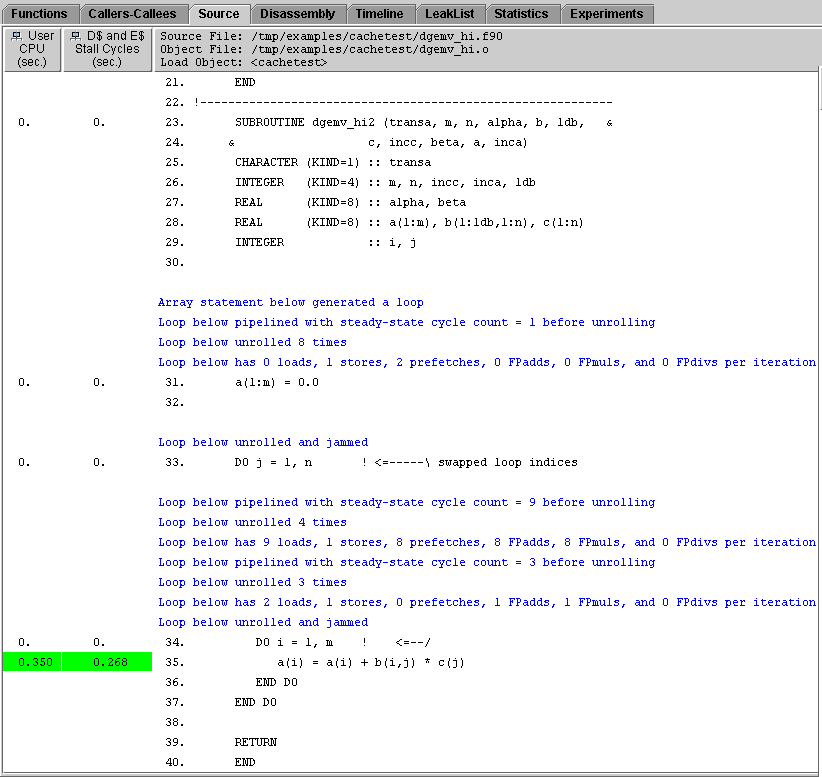
The line numbers for the instructions in the optimized code are no longer sequential. The compiler has rearranged the code: in particular, the initialization loop is now part of the main loop structure.
Compare the disassembly listing with that for dgemv_g1 or dgemv_opt1. There are many more instructions generated for dgemv_hi1 than for dgemv_g1. The loop unrolling and the insertion of prefetch instructions contribute to the larger number of instructions. However, the number of instructions executed in dgemv_hi1 is the smallest of the three versions of the subroutine. Optimization can produce more instructions, but the instructions are used more efficiently and executed less often.
Copyright © 2003, Sun Microsystems, Inc. All rights reserved.