The Look and Feel of Prism
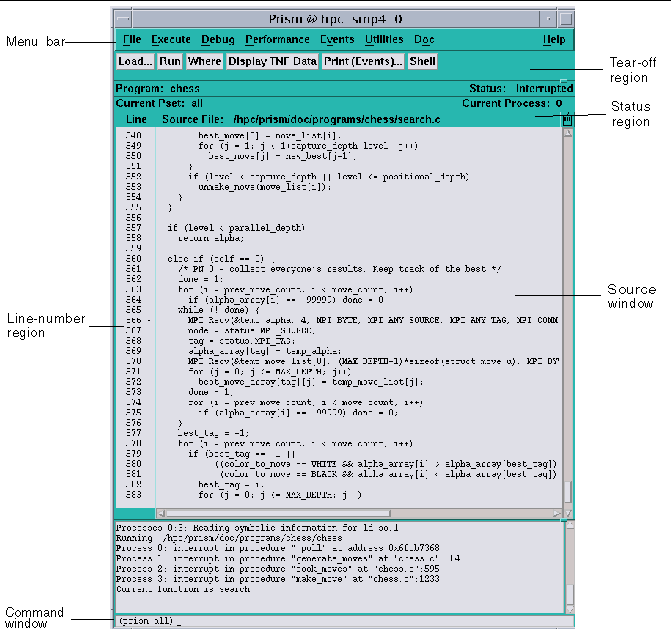
Figure 1-1 shows the main window of Prism with a program loaded. It is within this window that you debug and analyze your program. You can operate with a mouse, use keyboard equivalents of mouse actions, or issue keyboard commands.
Figure 1-1 Prism's Main Window

Clicking on items in the menu bar displays pulldown menus that provide access to most of Prism's functionality.
You can add frequently used menu items and commands to the tear-off region, below the menu bar, to make them more accessible.
The status region displays the program's name and messages about the program's status.
The source window displays the source code for the executable program. You can scroll through this source code and display any of the source files used to compile the program. When a program stops execution, the source window updates to show the code currently being executed. You can select variables or expressions in the source code and print their values or obtain other information about them.
The line-number region is associated with the source window. You can click to the right of a line number in this region to set a breakpoint at that line.
The command window at the bottom of the main Prism window displays messages and output from Prism. You can also type commands in the command window rather than use the graphical interface.
General aspects of using these areas are discussed in Chapter 2, Using Prism.
- © 2010, Oracle Corporation and/or its affiliates
