Chapter 1 The Prism Environment
Prism is an integrated graphical environment within which users can develop, execute, and debug programs. It provides an easy-to-use, flexible, and comprehensive set of tools for performing all aspects of serial and message-passing programming. Prism software operates on terminals or workstations running the Solaris operating environment under either OpenWindows(TM) environment or Sun's Common Desktop Environment (CDE). In addition, a commands-only option allows you to operate on any terminal, but without the graphical interface.
Overview
You can either load an executable program into Prism, or start from the beginning by calling up an editor and a UNIX shell within Prism and using them to write and compile the program.
Once an executable program is loaded into Prism, you can (among other things):
-
Execute the program
-
Debug the program
-
Visualize data from the program
-
Analyze the performance of message-passing programs
Prism supports two modes of operation, depending upon whether you are developing message-passing programs (MP Prism) or serial programs (scalar Prism). When running serial programs under Prism, the view presented to the user is usually that of a single serial program. When running message-passing programs under Prism, additional features (such as pset support) become available.
The Look and Feel of Prism
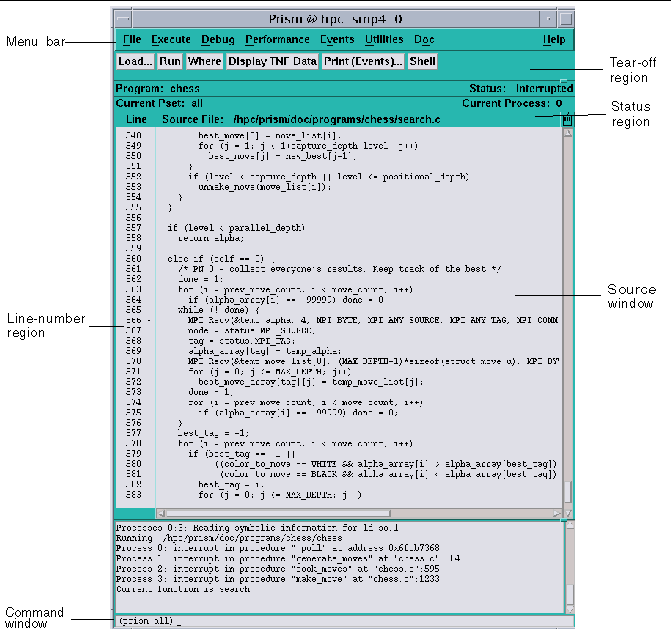
Figure 1-1 shows the main window of Prism with a program loaded. It is within this window that you debug and analyze your program. You can operate with a mouse, use keyboard equivalents of mouse actions, or issue keyboard commands.
Figure 1-1 Prism's Main Window

Clicking on items in the menu bar displays pulldown menus that provide access to most of Prism's functionality.
You can add frequently used menu items and commands to the tear-off region, below the menu bar, to make them more accessible.
The status region displays the program's name and messages about the program's status.
The source window displays the source code for the executable program. You can scroll through this source code and display any of the source files used to compile the program. When a program stops execution, the source window updates to show the code currently being executed. You can select variables or expressions in the source code and print their values or obtain other information about them.
The line-number region is associated with the source window. You can click to the right of a line number in this region to set a breakpoint at that line.
The command window at the bottom of the main Prism window displays messages and output from Prism. You can also type commands in the command window rather than use the graphical interface.
General aspects of using these areas are discussed in Chapter 2, Using Prism.
Loading and Executing Programs
You can load an executable program into Prism when you start it up, or any time afterward. Once the program is loaded, you can run the program or step through it. You can also interrupt execution at any time.
You can also attach to a running program or associate a core file with a program.
"Executing a Program in Scalar Prism" discusses these topics in more detail. See " Executing a Program in MP Prism" for aspects of these topics that are unique to MP Prism.
Debugging
Prism allows you to perform standard debugging operations such as setting breakpoints and traces, and displaying and moving through the call stack. Chapter 4, Debugging a Program, discusses these topics for both scalar and MP Prism.
Visualizing Data
It is often important to obtain a visual representation of the data elements that make up an array or parallel object. In Prism, you can create visualizers that provide standard representations of variables or expressions. For example,
-
In the colormap representation, each data element is mapped to a color, based on a range of values and a color map that you specify. (This representation is available only on color workstations.)
-
In the threshold representation, each data element is mapped to either black or white, based on a cutoff value that you can specify.
A data navigator lets you manipulate the display window relative to the data being visualized. Options are available that let you update a visualizer or save a snapshot of it.
See Chapter 5, Visualizing Data for a discussion of visualizing data. " Visualizing Multiple Processes in MP Prism" covers aspects of visualization unique to MP Prism.
Analyzing Program Performance
Prism provides support for Trace Normal Form (TNF) performance analysis for Sun MPI message-passing programs. By redirecting the LD_LIBRARY_PATH environment variable, you can use a TNF-instrumented Sun MPI library to generate data on the performance of your Sun MPI routines. Then, you can display and analyze the TNF data in timeline graphs, scatter plots, histograms, and tables.
See Chapter 6, Obtaining MPI Performance Data, for a discussion of MPI performance analysis.
Editing and Compiling
You can call up the editor of your choice within the Prism environment to edit source code (or any other text files). If you change your source code and want to recompile, Prism also provides an interface to the UNIX make utility. Editing and compiling are described in more detail in Chapter 8, Editing and Compiling Programs.
Obtaining Online Help and Documentation
Prism features a comprehensive online help system. Help is available for each menu, window, and dialog box in Prism.
In addition to help on Prism itself, Prism online documentation is provided in the Sun AnswerBook2.
Online help and documentation are described in more detail in Chapter 9, Getting Help.
Customizing Prism
You can change aspects of the way Prism operates. You can create customized command buttons in the tearoff region of the main Prism window, create aliases for commands and variables, and change Prism default settings. These customizations are discussed in Chapter 10, Customizing Prism.
- © 2010, Oracle Corporation and/or its affiliates
