Setting Parameters
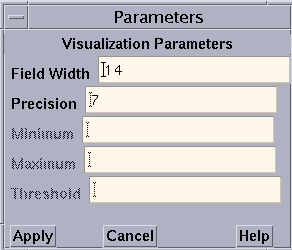
Choose Parameters from the Options menu to display a dialog box in which you can change various defaults that Prism uses in setting up the display window; see Figure 5-11. If a parameter is grayed out or missing, it does not apply to the current representation.
Figure 5-11 Visualization Parameters Dialog Box

The parameters (for all representations except the histogram representation) are:
-
Field Width - Type a value in this box to change the width of the field that Prism allocates to every data element.
For the text representation, the field width specifies the number of characters in each column. If a number is too large for the field width you specify, dots are printed instead of the number.
For dither, threshold, colormap, and vector representations, the field width specifies how wide (in pixels) the representation of each data element is to be. By default, dither, threshold, and colormap visualizers are scaled to fit the display window. Note, however, that for dither visualizers, the gray shading may be more noticeable with a smaller field width.
For the graph representation, the field width specifies the horizontal spacing between elements.
For the surface representation, it specifies the spacing of elements along both directions of the plane.
-
Precision - Type a value in this box to change the precision with which Prism displays real numbers in a text visualizer. The precision must be less than the field width. By default, Prism prints doubles with 16 significant digits, and floating-point values with 7 significant digits. You can change this default by issuing the set command with the $d_precision variable (for doubles) or $f_precision variable (for floating-point values). For example,
set $d_precision = 11
sets the default precision for doubles to 11 significant digits.
-
Minimum and Maximum - For colormap representations, use these variables to specify the minimum and maximum values that Prism is to use in assigning color values to the data elements. Data elements that have values below the minimum and above the maximum are assigned default colors.
For graph, surface, and vector representations, these parameters represent the bottom and top of the range that is to be represented. Values below the minimum are shown as the minimum; values above the maximum are shown as the maximum.
By default Prism uses the entire range of values for all these representations.
-
Threshold - For threshold representations, use this variable to specify the value at which Prism is to change the display from black to white. Data elements whose values are at or below the threshold are displayed as black; data elements whose values are above the threshold are displayed as white. By default, Prism uses the mean of the data as the threshold.
The parameters for the histogram representation are:
-
Bar Width - Specifies the width in pixels of each histogram bar (except for the bars representing infinities and NaNs, which must be wide enough to fit the Inf or NaN label underneath). The default is 10 pixels.
-
Bar Height - Specifies the height in pixels of the largest histogram bar. The default is 100 pixels.
-
Minimum - Specifies the minimum value to be included in the histogram. By default the actual minimum value is used.
-
Maximum- Specifies the maximum value to be included in the histogram. By default the actual maximum value is used.
If you specify a different minimum or maximum, values below the minimum or above the maximum are not displayed in the histogram, but are counted as outliers instead; the number of outliers is displayed above the histogram.
-
Max Buckets - Specifies the number of "buckets" into which values are to be poured--in other words, the number of histogram bars to be used. The default is 30. (Prism may use fewer to make the horizontal labels come out evenly.)
- © 2010, Oracle Corporation and/or its affiliates
