Displaying a Ruler
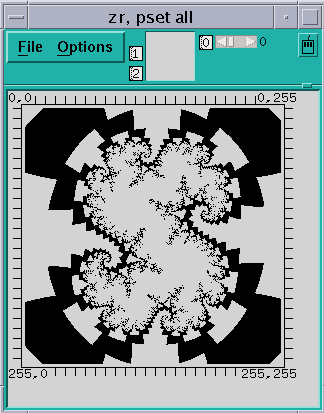
Choose Ruler from the Options menu to toggle the display of a ruler around the data in the display window. The ruler is helpful in showing which elements are being displayed. Figure 5-12 shows a 3-dimensional threshold visualizer with the ruler displayed.
In the surface representation, the ruler cannot indicate the coordinates of elements in the vertical axis, since they change depending on the height of each element. However, you can press the Shift key and left-click to display the coordinates and value of an element.
Figure 5-12 Threshold Visualizer With a Ruler

- © 2010, Oracle Corporation and/or its affiliates
