Displaying Statistics
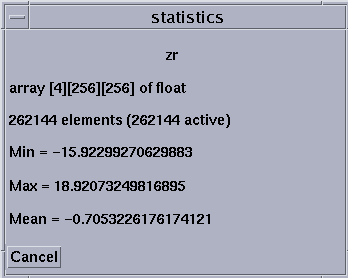
Choose Statistics from the Options menu to display a window containing statistics and other information about the variable being visualized. The window contains:
-
The name of the variable
-
Its type and number of dimensions
-
The total number of elements the variable contains, and the total number of active elements, based on the context you set within Prism (see the next section for a discussion of setting the context)
-
The variable's minimum, maximum, and mean; these statistics reflect the context you set for the visualizer
Figure 5-13 gives an example of the Statistics window.
Figure 5-13 Statistics for a Visualizer

- © 2010, Oracle Corporation and/or its affiliates
