Creating an Event Dataset
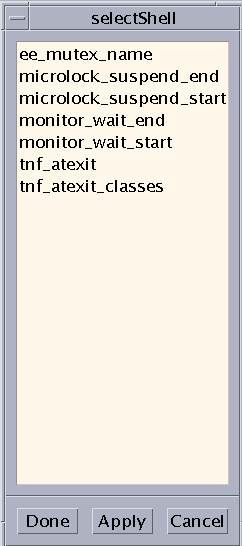
Click the "Choose a type of event" button to open the Event Selection window (see Failed Cross Reference Format). The window displays a list of the event types (probes) defined in the current tracefile. Selecting a set of events, such as the set of all MPI_Send_start events, then clicking on Done causes the Graph window to automatically display a scatter plot of the dataset of all MPI_Send_start events. The Graph window also supplies a histogram (opened using the Histogram tab) of the event set. The table shows only interval latencies. Nothing is displayed for single events in the table.
Figure 6-4 Event Selection Window

- © 2010, Oracle Corporation and/or its affiliates
