Selecting a Point in the Scatter Plot
Each point in the scatter plot corresponds to a data point in the displayed dataset.
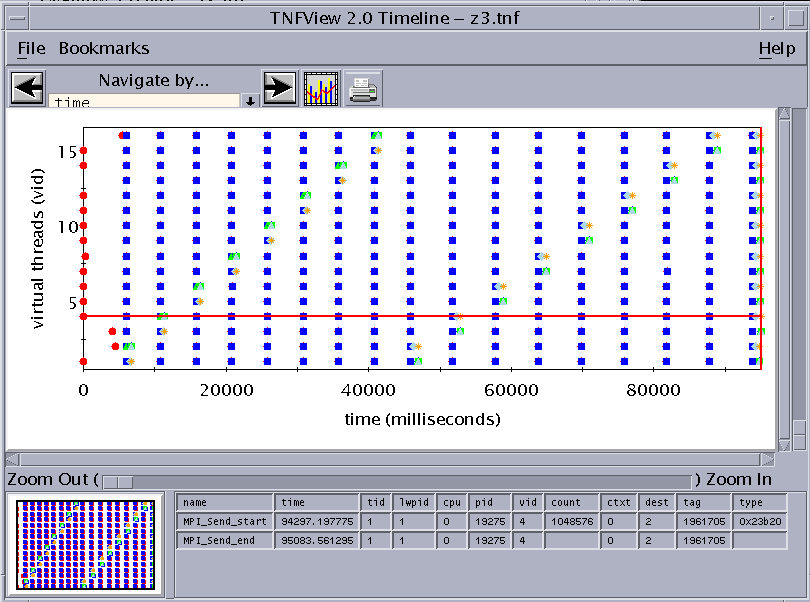
Clicking on any data point in the scatter plot causes the timeline graph to select the corresponding event or interval, displaying the detailed data of that event or interval in the Timeline window's event table.
For datasets with one event, one event will be shown in the Timeline window. If the dataset comes from an interval definition, then each dot in the scatter plot represents two events, and two events will be shown in the Timeline window.
For example, clicking on the furthest outlying data point in the scatter plot graph shown in Failed Cross Reference Format navigates the Timeline window to the corresponding event or interval, as shown in Failed Cross Reference Format.
Figure 6-6 Navigating the Timeline View to the Data Point Selected in the Scatter Plot View

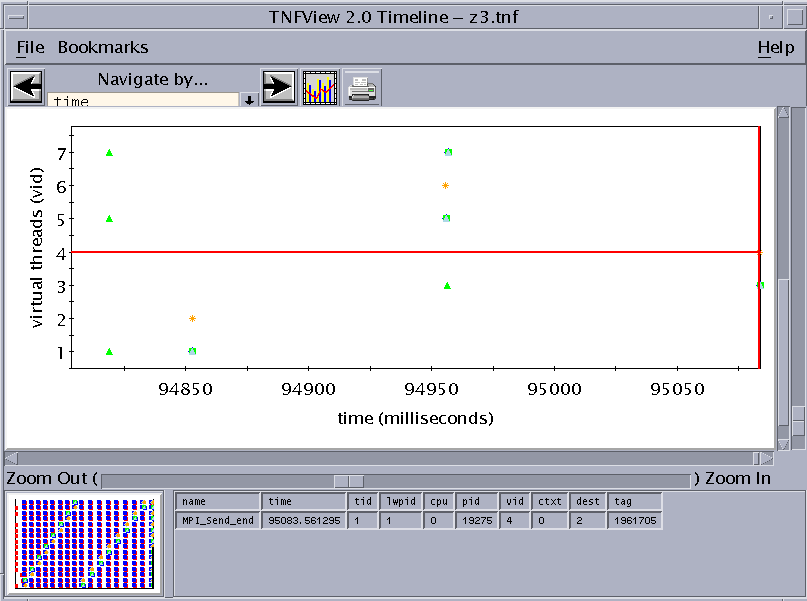
Then, zooming in to the data points closest to the selected data point displays a finer grain view of the dataset. (To center the timeline display on the selected data point, click it with the middle mouse button.) Failed Cross Reference Format shows an example.
Figure 6-7 Zooming In for a Finer Grain View of the Dataset

Note the selected area in the panner graph, indicating the area of the previous graph covered by the zoom.
- © 2010, Oracle Corporation and/or its affiliates
