Opening the Table View
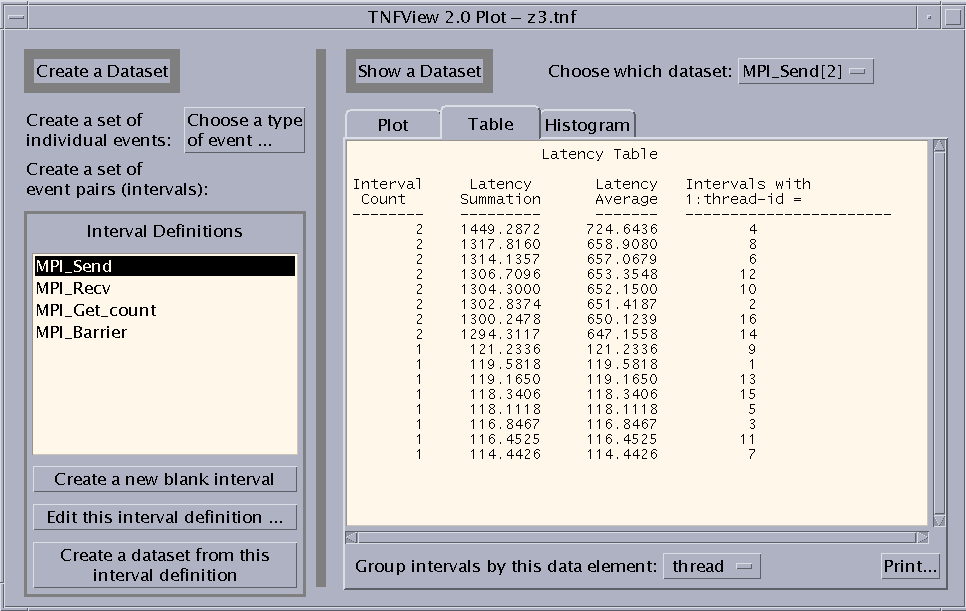
Clicking the Table tab on the Graph view window opens a tabular presentation of the selected dataset. See Failed Cross Reference Format for an example:
Figure 6-8 Table View

The Table view displays four columns:
-
Interval Count - Number of intervals
-
Latency Summation - Time in milliseconds
-
Latency Average - Time in milliseconds
-
Intervals with data_element - You can choose the value for this column using the list that is revealed when you click the button next to the "Group intervals by this data element" label.
- © 2010, Oracle Corporation and/or its affiliates
