Opening the Histogram View
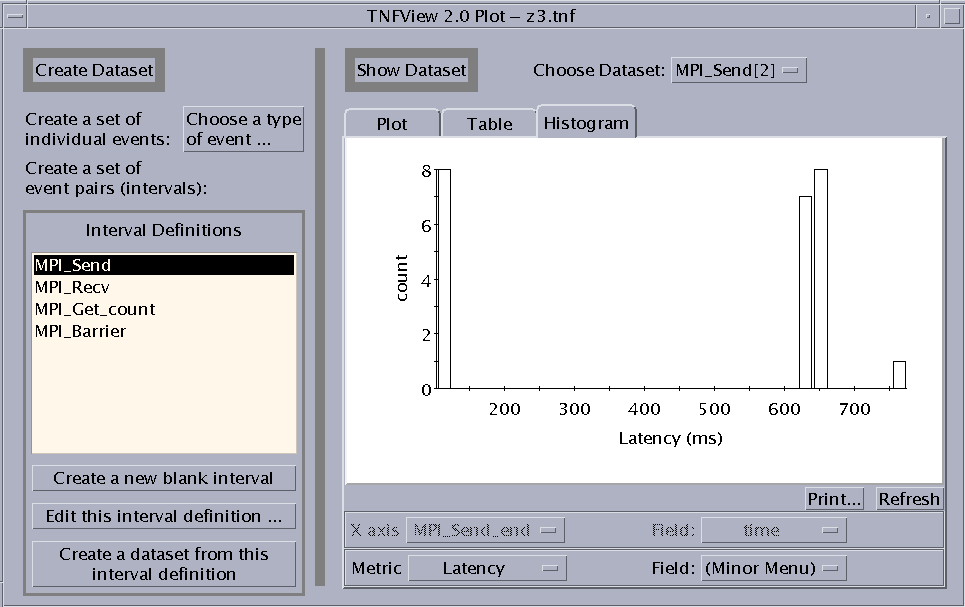
Clicking the Histogram tab on the Graph view window opens a histogram presentation of the selected dataset. For example:
Figure 6-9 Histogram View

Clicking on a Bucket in the Histogram
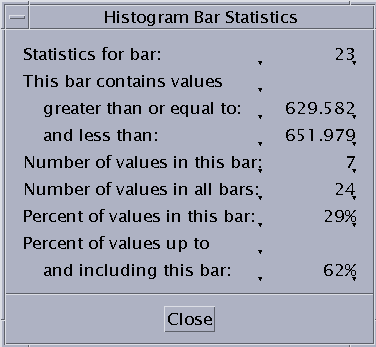
Click the left mouse button on a bar in the histogram graph to display three sets of values for the data points represented by that bar. These values are:
-
Statistics for bar - Displays the number of the bar, counting from zero to 29.
-
This bar contains values ... - Displays the range of the data in the bar.
-
Any value in this bucket must be greater than or equal to the first value.
-
Any value in this bucket must be less than the second value.
-
-
Number of values in this bar - Displays the number of values within the bar.
-
Number of values in all bars - Displays the number of values within the entire dataset.
-
Percent of values in this bar - Displays the values within the bar as a percentage of the entire dataset.
-
Percent of values up to and including this bar - Displays a cumulative percentage. The value is the total of the selected bucket and all buckets to the left of it as a percentage of the complete data set.
These values are displayed in a Histogram Bar Statistics dialog box, as shown in Failed Cross Reference Format.
Figure 6-10 Histogram Bar Statistics Dialog Box

- © 2010, Oracle Corporation and/or its affiliates
