Data Collection.
In our CFD example, we first run the benchmark using these environment variable settings
% setenv MPI_SPIN 1
% setenv MPI_PROCBIND 1
These settings are appropriate for achieving good performance for a dedicated Sun MPI job. See the Sun MPI 4.0 Programming and Reference Guide for more information about using Sun MPI environment variables for high performance. These environment variables are specific to Sun MPI programs. They have no direct effect on Prism.
Note -
No special compilation or linking is required to use Prism's MPI performance analysis.
The benchmark was run under Prism on a single, shared-memory node using 25 processes with the command:
% prism -n 25 a.out
The -n argument to Prism must be specified even if only one process is used. The run took 146 seconds to complete.
To Collect Performance Data:
-
Click on Collection (from the Performance menu).
-
Click on Run (from the Execute menu).
-
Click on Display TNF Data (from the Performance menu).
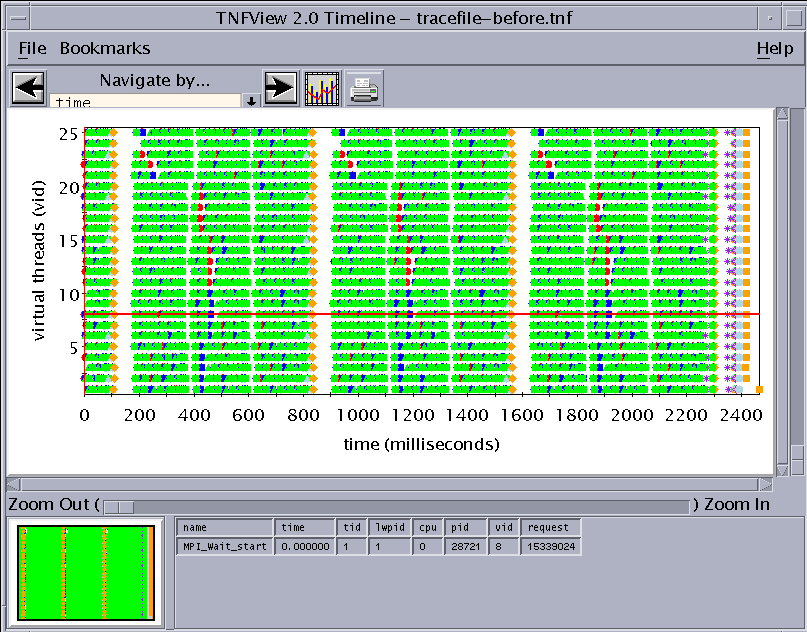
The tnfview timeline window will appear. The horizontal axis shows time, in milliseconds. The vertical axis shows MPI process rank. For single-threaded multi-process programs, the virtual thread ID is the same as the MPI rank of each process.
Figure 7-1 The Timeline View of TNF Probes.

TNF trace data files are wraparound trace buffers of prescribed size. For that reason, if a lot of data is recorded, new events will overwrite older ones. For example, Figure 7-1 shows 3 iterations over roughly 2 seconds. Meanwhile, the benchmark has 200 iterations and took roughly 146 seconds, indicating that only 1/70 of the events are being represented. This is sufficient for our purposes since the last iterations are representative of the whole run. For further information about buffer wraparound, see "Coping With Buffer Wraparound".
- © 2010, Oracle Corporation and/or its affiliates
