Data Properties
The ability to log data is included with the Sun Management Center 3.0 base product. Performance Reporting Manager uses this logged data in the reports. Only data that is logged to the circular history.log file on the agent machine is collected for reporting purposes. Data cannot be included in any report until logging of the data property is first enabled. Certain data properties are automatically logged for you. If a property is not being logged, you will not receive any data for that property until logging is first enabled.
You can use the Data Availability option to determine if a property is already being logged on the machine. To either enable or disable the logging of a data property, you can use the history logging capability of Sun Management Center 3.0 or use the group logging task. For more information about history logging, see Sun Management Center 3.0 User's Guide. For more information about the group logging task, see Group Logging
If you receive a No Data Found error message when running a report, first check to see if the data property is being logged on the agent machine specified in your report.
Data Availability
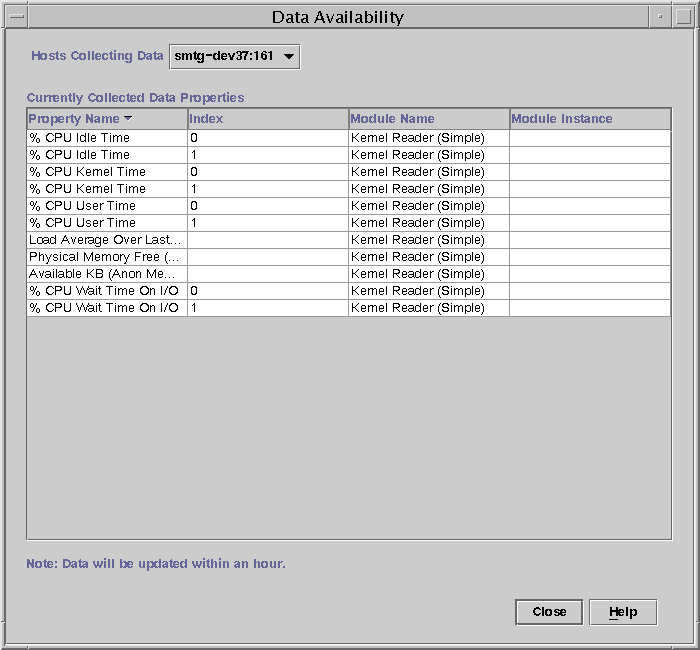
Only those data properties that are being logged on the agent machine can return data for reports. The Data Availability dialog box enables you to check what properties are currently being logged. The information is updated every hour. If you have just installed Performance Reporting Manager, the data might take an hour to first appear in the Data Availability dialog box.
Note –
The data properties being logged are used for performance reports only.
To See the Properties Being Logged
-
From the Report Manager file menu, choose Data, and then select Data Availability.
The Data Availability dialog box opens. All agent machines for which data was collected in the last hour appear in the Hosts Collecting Data drop-down menu.
-
Select the desired host name from the drop-down menu.
The table expands to list all the data properties collected for that host. You can resize the columns by dragging the cell borders in the column title. You can sort the table by double-clicking the column headings.
-
Click Close to dismiss the dialog box.
The following figure shows a sample of the Data Availability dialog box. A note at the bottom of the dialog box reminds you that data in this table refreshes within an hour.
Figure 4–2 Sample of Data Availability Dialog Box with Data Properties Showing

Data Properties Selection
When creating your custom report request, the report template requires that you select the data properties to include in the report.
The addition of certain properties requires that you provide an entry for either the module instance or property instance, or both. The module instance is needed only for multi-instance modules. Examples of a multi-instance module includes File Monitoring or Directory Monitoring. Each instance can be used for monitoring a different file or directory. The property instance typically refers to an instance name given to the property being logged. For example, in a machine with four CPUs, the CPUs can be numbered 0, 1, 2, and 3. If you are only interested in the performance of CPU number 3, you specify 3 as the property instance for the CPU property included in the report. You specify All as the property instance when you want a report that includes all instances that exist for the host. For more information, see Sun Management Center 3.0 User's Guide.
To Add Data Properties
-
From the Data Properties field in the New Report Request template, click Edit.
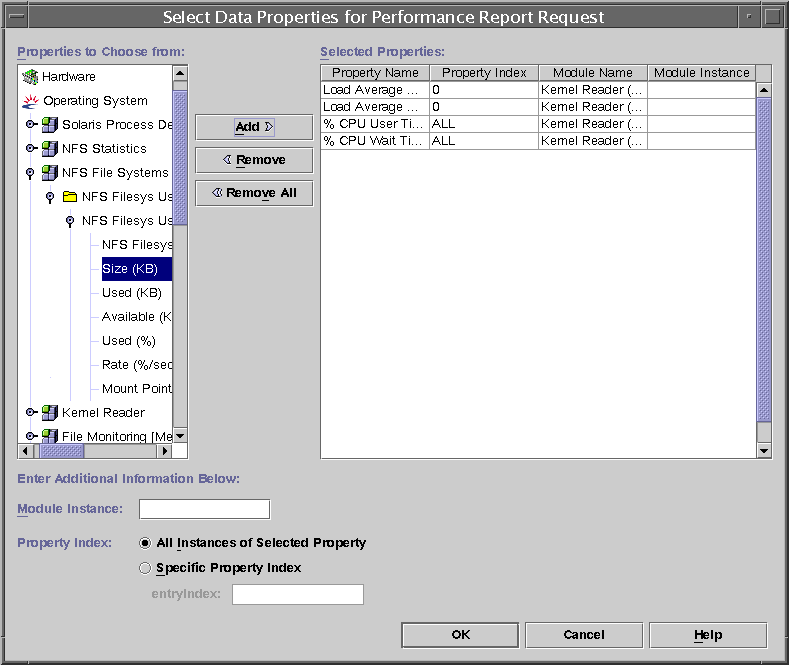
The Property Chooser dialog box appears. It contains two panes. The left pane is titled Properties to Choose From. The right pane is titled Selected Properties.
-
Expand the hierarchy view in the left pane by clicking the key symbols.
The data properties are located at the third level of the hierarchy.
-
Select the desired property, and click Add.
The property moves to the right pane. If required, the Module Instance or Specific Property Index fields become active in the lower left-hand corner of the dialog box.
-
(Optional) Provide the Module Instance and Specific Property Index in their respective text fields.
If module is a multiple instance module, provide the module instance wanted.
-
When you finish adding all desired properties, click OK.
The Property Chooser dialog box closes. Continue completing the report template.
The figure below shows a sample of the Property Chooser dialog box for performance reports.
Figure 4–3 Sample of the Property Chooser Dialog Box for a Performance Report Request

Group Logging
When you want to log the same data properties on a group of agent machines, you can use the Group Operation features of the Premier Management Applications add-on to Sun Management Center 3.0. Instead of adding the same set of data properties to be logged on each machine individually, you can save time with the group logging feature. For more information about all the Group Operation features, see Sun Management Center 3.0 User's Guide.
To Add Data Properties to a Group Task
-
From the Sun Management Center 3.0 Main Console File menu, choose Tools, then select Group Operation.
The Group Operation dialog box appears.
-
From the File menu, choose New, and then choose Task.
The Create/Edit Tasks dialog box appears.
-
Create a new group task by typing the task name in the text field, and then pressing Return.
If needed, for more information see Sun Management Center 3.0 User's Guide.
-
From the Type drop-down list, select Data Logging.
-
Click Add Properties.
The Property Chooser dialog box appears.
-
From the hierarchy view in the left panel, select the data properties one at a time, and click Add after each one.
The data properties are contained in the third-level in the hierarchy. Each data property added moves to the right pane.
-
Click OK when done.
The data properties are added to the group task.
-
From the Create/Edit Task dialog box, select the data property.
If you added more than one data property to the group task, you must do this one at a time.
-
Click Logging Setting.
The Property Logging Setting dialog box launches.
-
If the box next to Logging does not have a check mark, add one.
Logging for the data property is now enabled.
-
Type the desired time interval, in seconds, in the Interval text field.
The default is 300 seconds. The data property is logged at the interval specified.
-
Click OK to save the task and close the dialog box.
To Run a Group Task
-
From the Sun Management Center 3.0 Main Console File menu, choose Tools, then select Group Operation.
The Group Operation dialog box appears.
-
Launch the Create/Edit Groups dialog box.
-
From the dialog box, select objects from the domain.
-
From the Sun Management Center 3.0 Main Console, select the names of the servers, and then click Update.
You can select the server names either by using Shift+Click, or by drawing a lasso around each individually, or as a consecutive group.
-
Click OK to save the server names.
-
From the Group Operations window, type the Name, then select the group name from the drop-down list.
The group name is the one you provided when you created the group task.
-
Select the group task name from the drop-down list.
The group task name is the one you provided when you created the group task.
-
Click the Save/Run icon from the menu.
This is the last icon on the menu. Logging of the data properties chosen earlier starts.
- © 2010, Oracle Corporation and/or its affiliates
