Chapter 1 Introduction to Sun Management Center
This chapter provides an overview of the Sun Management Center 3.6.1 product, its component layers, and the relationships among the layers.
This chapter includes the following topics:
Sun Management Center Overview
Sun Management Center software is an open, extensible system monitoring and management solution.
Sun Management Center has the following features.
- System Management
-
Monitors and manages the system at the hardware and operating system levels. Monitored hardware includes boards, tapes, power supplies, and disks.
- Operating System Management
-
Monitors and manages operating system parameters that include load, resource usage, disk space, and network statistics.
- Application and Business System Management
-
Provides enabling technology to monitor business applications such as trading systems, accounting systems, inventory systems, and control systems.
- Scalability
-
Provides an open, scalable, and flexible solution to configure and manage multiple management administrative domains. These domains consist of many systems and span across an enterprise. Administrators can configure the software in a centralized or distributed fashion so that the product supports multiple users.
This solution uses Simple Network Management Protocol (SNMP), the JavaTM Remote Method Invocation (RMI), and the Hypertext Transfer Protocol (HTTP). These tools enable Sun Management Center to provide integrated, comprehensive enterprise-wide management of Sun products and their subsystems, components, and peripheral devices.
Important Changes in Sun Management Center 3.6.1 Software
Version 3.6.1 of the Sun Management Center product includes the following significant changes:
-
On Solaris 10, you can install and set up Sun Management Center inside a whole root zone. For information about this, see To Install and Set Up Sun Management Center Server Inside a Whole Root Zone in Sun Management Center 3.6.1 Installation and Configuration Guide.
-
You can monitor the hardware on x86/x64 systems using the generic X86/X64 Config Reader add-on. For information about this, see Table 11–1 and X86/X64 Config Reader Module Version 1.0.
-
You can install and set up Linux agent in a Xen domain.
-
Sun Management Center 3.6.1 allows consumers to subscribe to and receive fault events occurring on the Fault Manager Daemon (FMD). Consumers can be Sun Management Center modules, partner modules, or objects interested in getting the fault events. For information about this, see the Sun Management Center 3.6.1 Developer Environment Reference Manual.
-
Using the Solaris Container Manager 3.6.1 add-on, you can create multiple copies of a zone on a single host or a copy of a zone on multiple hosts. For information about this, see Copying Non-Global Zones in Installing and Administering Solaris Container Manager 3.6.1.
-
Solaris Container Manager 3.6.1 supports Fujitsu Primepower systems.
-
Sun Management Center 3.6.1 does not support SPARC systems running Solaris 2.6 and Windows 98.
-
Sun Management Center 3.6.1 uses Pluggable Authentication Module (PAM) based authentication.
-
Sun Management Center 3.6.1 also supports the following hardware:
-
Sun Ultra 45
-
Sun Fire T1000
-
Important Changes in Sun Management Center 3.6 Software
Version 3.6 of the Sun Management Center product includes the following significant changes:
-
Agent and console layers are available in Linux Operating System (OS). The agent layer is available for Red Hat, SuSE/JDS Linux kernel version 2.4.20 and later. For a list of modules, add-ons, and commands supported by the Linux agent, see Appendix F, Linux Agent Support.
-
On Solaris 10, you can handle hardware and software faults effectively. You can view a fault report and a message article. For information about this, see Table 11–1 and Fault Manager Module Version 1.0.
-
On Solaris 10, you can monitor the services running on a host. You can view the details of a service, enable a service, or disable a service. You can also view the processes in the selected service. For information about this, see Table 11–1 and Service Management Facility Module Version 1.0.
Note –On Solaris 10, when Sun Management Center is installed and set up, the services run as Service Management Facility (SMF) services.
-
You can access the Sun N1TM System Manager server (System Manager) from the Sun Management Center software. You can also monitor a set of properties managed by this server. For information about this, see Table 11–1 and Volume System Monitoring Module Version 1.0.
-
On Solaris 10, you can configure the agent inside a global zone.
-
On Solaris 10, you can run Dynamic Tracing (DTrace) scripts. For information about this, see Guide de l’utilisateur de Sun Management Center 3.6 System Reliability Manager.
-
You can use SolarisTM Container Manager 3.6 for resource allocation, service performance monitoring, and accounting. For information about installing and using this add-on, see Installing and Administering Solaris Container Manager 3.6.
-
The Sun Management Center agents can securely communicate with third-party management applications by using SNMPv3.
-
Many enhancements have been made to the command-line interface (CLI). For information about this, see Chapter 20, Using the Command-Line Interface.
-
Documentation for Sun Management Center is not installed with the product. The documents are available at http://docs.sun.com/app/docs/coll/810.4.
-
Many bugs and requests for enhancements (RFEs) have been addressed in this release.
Sun Management Center Architecture
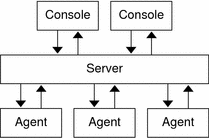
Sun Management Center software includes three component layers: console, server, and agent. The product is based on the manager and agent architecture:
-
The console layer provides the user interface that you use to initiate management tasks. This layer includes a Java Console, a web console, and a command-line interface (CLI).
-
The server (manager) executes management applications and sends requests to agents to perform management tasks on your behalf.
-
The agents that execute on the managed nodes access the management information, monitor local resources, and respond to manager requests.
The following figure illustrates the three component layers.
Figure 1–1 Sun Management Center Component Layers
The major Sun Management Center layers and their functions are described next.
Console Layer
The Sun Management Center console layer is the interface between you and the other component layers of Sun Management Center software. This layer includes a Java Console, a web console, and a CLI. You can have multiple consoles, serving multiple users, for the same Sun Management Center server. The consoles provide these features:
-
Visual representations of the managed objects, for example, hosts and networks
-
The ability to manipulate attributes and properties that are associated with the managed objects, for example, create alarm thresholds
-
The ability to initiate management tasks, for example, dynamic reconfiguration
Server Layer
The server layer accepts requests through the console and passes these requests to the appropriate agent. The server then relays the response from the agent back to the console.
For example, if you request information on the number of users that are accessing a host, the server layer receives this request from the console. The server layer then sends the request to the agent on that host. The agent finds the answer and sends the answer back to the server, which forwards the information to the console.
Similarly, if an error condition is created on one of the hosts, the agent on that host notifies the server. The server forwards the information to the console as an alarm.
In addition, the server layer provides the console with a secure entry point to interface with the agents.
The server layer includes the following components, as illustrated in Figure 1–2:
-
Sun Management Center server
-
Sun Management Center web server
-
Topology manager
-
Trap handler
-
Configuration manager
-
Event manager
Figure 1–2 Sun Management Center Server Layer
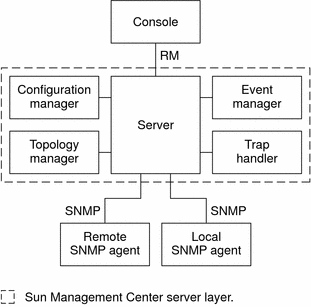
The server component is the core of the server layer. The server component consists of two servers: a Java server and a web server. Both the Java server and the web server are multi-threaded. These servers can handle multiple data requests from various Sun Management Center users.
The topology manager provides services that include managing user administrative domains and arranging managed object topology.
The trap handler is a centralized SNMP trap receptor that logs and forwards traps to interested components. This server layer component is responsible for receiving all alarm notifications.
The configuration manager provides security services to the server and the agents.
The event manager receives event information from the agents. These events can trigger alarms, which are forwarded to the console.
Agent Layer
The agent layer monitors, gathers information about, and manages objects on the nodes that the Sun Management Center software manages. The server layer uses SNMP to interact with the agent layer to gain access to the managed objects.
Sun Management Center agents are scalable, extensible, and SNMP-based. The agents monitor and manage objects by loading modules that focus on a specific aspect of the system, as well as application health and performance. These objects represent hardware, operating systems, and applications.
The agents use rules to determine the status of the managed objects. When the conditions that a rule specifies become true, the software automatically generates alarms and performs actions as the rule specifies.
Server Context
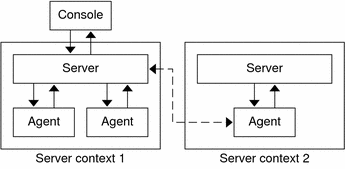
The server layer and agent layers together are referred to as a Sun Management Center server context. When you start the console, you log in to a particular server context. The managed objects whose agents send information to that server belong to the same server context.
A managed object can belong to the same server context or to a remote server context. A managed object in a remote server context sends information to a different server. A managed object in the same server context sends information to the server host that is connected to your console.
By default, the Sun Management Center software manages an object in the same server context but only monitors an object in a remote server context. For more precise definitions of “manage” and “monitor,” see Glossary. For more information about server contexts and security, see Sun Management Center Remote Server Access.
Figure 1–3 Console Logs Into a Server Context
Sun Management Center Concepts
The following concepts are fundamental to understanding Sun Management Center software:
-
Administrative domains
-
Management information base (MIB)
-
Modules
-
Alarms and rules
Note –
In this document, “domain” refers to a Sun Management Center administrative domain. This term should not be confused with uses of the term “domain” related to other Sun products or documentation. See Chapter 2, Using Sun Management Center Administrative Domains for more information.
Administrative Domains
An administrative domain is a hierarchical collection of resources that you want to monitor and manage. The resources can include a complete campus, individual buildings, hosts, networks, subnets, links, and so on. Each administrative domain consists of these resources, which can be combined with other resources to form groups within a administrative domain. Each of these groups can contain additional groups of resources, providing a multilevel, hierarchical administrative domain.
You can create one or more administrative domains that are based on your business needs. For example, you might create a lab administrative domain that contains all the lab machines. Similarly, you might create an accounting administrative domain that contains all the machines that are used for accounting.
The Sun Management Center software displays the administrative domain and its members in a visual representation. Figure 1–4 shows an example.
In the following example, the host, Payroll2, belongs to the Building B group, which belongs to the Payroll Servers 1 administrative domain.
Figure 1–4 Java Console Window Showing an Administrative Domain and Its Members
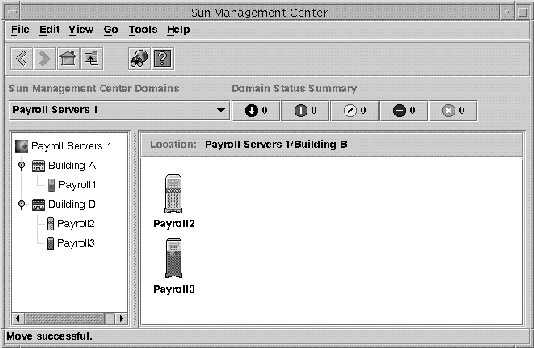
Linux hosts are identified by a generic Linux icon. Zone agents are identified by a generic icon having a “Z” symbol in the middle.
Management Information Base (MIB)
A management information base (MIB) is a hierarchical database schema that describes the data that are available from an agent. Sun Management Center agents use the MIB to store monitored data that can be accessed remotely.
Sun Management Center Modules
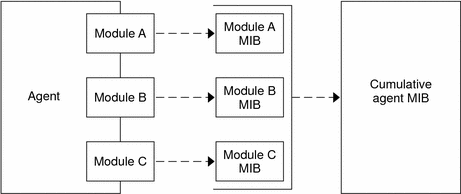
Unlike most agents, the Sun Management Center agents do not implement the MIB in a monolithic code that contains a wide variety of functions in a single program. Instead, Sun Management Center software uses several components, that are called modules, for each agent. Each module implements its own MIB. Therefore, the Sun Management Center agent MIB is the cumulative total of all the modules and their individual MIBs, as illustrated in the following figure.
Figure 1–5 Sun Management Center Agent MIB
Sun Management Center modules monitor and manage the resources of systems, applications, and network devices. The modules enable you to isolate and monitor specific system components. For example, separate modules are available for monitoring the kernel, for monitoring printers, and for monitoring processes. The modules are primarily used to monitor and to notify you through alarms when error conditions occur or when performance tuning is required. For more information about alarms, see Alarms and Rules.
Each module consists of one or more properties that you can monitor. For example, one of the default modules that is loaded during installation is the Kernel Reader. This module monitors the kernel properties. These properties include user statistics, disk statistics, file system usage, and so on.
Note –
You can add or remove modules dynamically. This feature enables you to customize the modules that are loaded on each agent (object), based on your need.
Alarms and Rules
An alarm is a notification of an abnormal event. Sun Management Center software enables you to monitor your system using alarms that have differing severities. The thresholds that generate these alarms are defined in the modules. The software enables you to set the thresholds that trigger simple alarms.
For example, one of the properties of the Kernel Reader module is the number of user sessions. The software enables you to set a threshold number of user sessions that, when exceeded, generates an alarm. For example, you might tell Sun Management Center software to generate a critical alarm when there are seven or more user sessions. Similarly, you might tell the software to generate a cautionary alarm when there are five or six user sessions.
The software is configured with default alarm conditions. You can set and define your own alarm thresholds for simple alarms, such as those alarms that are based on the simple rCompare (comparison) rule.
Complex rules also generate alarms. For example, one complex rule generates an alert alarm when a disk is more than 75 percent busy, the average queue length is over 10 entries, and the wait queue is increasing. This rule combines three conditions:
-
Percentage of the disk that is busy
-
Average queue length
-
Wait queue
Unlike simple rules, these complex rules are predefined. You cannot modify complex rules. Consequently, you cannot set thresholds for complex alarms.
When an alarm is generated, the software notifies you through the main console window, and through an alarm action. The alarm action can include a message sent to a specified email address or activation of a script. You can also write a customized program that notifies you in other ways that an alarm condition has occurred.
For more information about alarms, see Chapter 12, Managing Alarms. For more information about rules, see Appendix D, Sun Management Center Software Rules.
Sun Management Center Management and Monitoring Features
Sun Management Center software includes the following management and monitoring features:
General Support Features
The features that are described in this section provide support for managing and monitoring your environment.
Autonomous Agents
Sun Management Center agents work autonomously by actively sampling key data on host systems. These agents can be polled through SNMP get requests for the current status of the monitored data.
When an agent gathers data for a monitored resource, the agent checks the data against the alarm threshold set for the resource. The agent then determines whether the data values constitute an alarm condition. If the monitored data meets the alarm threshold, the agent performs the action that is associated with the alarm condition. Agents send asynchronous messages (SNMP traps) to the server, which delivers notification of the change in the status of the monitored data.
User Security
The Sun Management Center security feature authenticates user login and access control privileges for users and groups. The software enables users to set security permissions at the administrative domain, group, host, and module levels.
You can restrict access by setting different permissions. For example, you might determine that one group of users can view and modify properties on a host, while another group of users can only see the host. For more general information about Sun Management Center security, see Chapter 18, Sun Management Center Security.
You can access Sun Management Center security features from the Attribute Editor within the console or from the CLI. For more information about the Attribute Editor, see Chapter 10, Monitoring Data Property Attributes. For more information about the CLI, see Chapter 20, Using the Command-Line Interface.
Specific Management and Monitoring Features
The features that are described in this section provide specific monitoring and management functionality. These features can be accessed through the consoles. Some of these features can also be accessed through the CLI.
Discovery Feature
The Sun Management Center includes a discovery feature. This feature enables you to automatically find network resources for Sun Management Center to monitor and manage. The discovery feature allows to specify discovery criteria based on several values such as IP range, host name, loaded modules, operating system, hardware type, or some combination of these values. For more information, see Chapter 4, Adding Objects to the Topology Database Using the Discovery Manager.
Main Console Window
Sun Management Center software provides Java and web interfaces that enable you to view, monitor, and interact with the software. You can monitor multiple administrative domains, spanning different locations, through multiple console windows. For more information about the Java Console, see Chapter 5, Managing Objects in Sun Management Center. For information about the web console, see Chapter 15, Managing Objects Using the Web Console.
Note –
The web console provides a subset of the functions that are available in the Java Console. Most of this document describes the functions that are available in the Java Console. Information that is specific to the web console is expressly identified.
Hierarchy and Topology Views
Sun Management Center software offers the following views:
-
Hierarchy and topology views for every administrative domain
-
Hierarchy and contents views for every object
The hierarchy view enables you to navigate through the administrative domain or host to find the object of interest. The topology view or contents view displays the members of the object that is selected in the hierarchy.
For an administrative domain, the hierarchy and topology views are displayed in the main console window. In addition, you can customize the administrative domain topology view by adding a background or creating a connection between objects in the administrative domain.
For an object, the hierarchy and contents views are displayed in the Details window. The Details window consists of a series of tabs. The available tabs depend on the type of object that is selected. For example, the following tabs would be displayed for a typical host object:
-
Info
-
Module Browser
-
Alarms
-
View Logs
-
Applications
-
Hardware
The View Logs, Applications, and Hardware tabs are described briefly in the sections that follow. For more information about the Details window, see Chapter 6, Viewing Detailed Information About a Managed Object.
View Logs Tab Overview
The View Logs tab enables you to view informational messages, including error messages, about your host.
Applications Tab Overview
The Applications tab enables you to view and select detailed information about processes running on the selected host or node. If you have any custom or third-party applications installed, this tab also enables you to view detailed information about processes running in the selected applications. The displays are continually updated.
Hardware Tab Overview
The physical view from the hardware tab provides you with photo-realistic front, back, and side views of the host. You can click individual components of the host to see detailed information about that component. For example, you can click a board in a server to see detailed information about that board, such as CPUs, memory, and board temperature.
Note –
Physical views are available only for some hardware platforms.
Sun Management Center software also provides a logical view of the overall hardware configuration of the host. Similar to the physical view, you can click a single component to obtain detailed information about that hardware component.
Note –
Logical views are available only for some hardware platforms.
Topology Import and Export Features
The topology import and export features enable you to import and export the topology database from or to an ASCII file that uses XML markup. These features provide a convenient way to migrate management domains from one Sun Management Center server to another server or to backup information for a server. For more information, see Chapter 19, Importing and Exporting Topology Information.
Graph Feature
Sun Management Center software enables you to create a two-dimensional graph of any monitored data property that has a numerical value. For more information, see Chapter 9, Viewing Data Properties in a Graph.
Dataviews Feature
The Attribute Editor window is used to browse management properties from a single agent by selecting an individual management object type. Sun Management Center also provides a dataviews feature that enables you to create a customized view or dashboard. In this customized view, you can put together a screen that shows individual properties that belong to different Sun Management Center modules that are loaded on separate Sun Management Center hosts. For more information, see Chapter 14, Dataviews.
Manage Jobs Feature
The Manage Jobs window enables you to create persistent jobs for topology objects. This feature provides a way to manage a collection of agents (or group) with the same ease as a single agent. Use the Manage Jobs window to define the objects to include, the specific tasks to run, and a schedule on which to run the job. For more information, see Chapter 13, Managing Group-related Jobs.
Module Configuration Propagation (MCP) Feature
MCP support enables you to make a persistent snapshot of an individual agent configuration. When you combine MCP support with the Manage Jobs feature, you can easily distribute agent configuration to multiple agents. For more information, see To Create a Configuration Task.
Sun Management Center Software Environments
You can deploy Sun Management Center software in two different environments:
-
Production environment
-
Developer environment
The production environment is an active environment in which you manage and monitor your hardware, including subsystems, components, and peripheral devices.
In contrast, the developer environment is a test, or demonstration, environment that developers can use to develop and test modules to work with the Sun Management Center software. While the developer environment might appear to be a production environment, its sole purpose is to be an environment in which developers create Sun Management Center modules.
Installing Sun Management Center Software
For information about installing Sun Management Center 3.6.1 , see the Sun Management Center 3.6.1 Installation and Configuration Guide.
After you install Sun Management Center software, spend some time moving among the various windows and testing their functions. Once you explore and test the software, you will have a better understanding of how you can customize Sun Management Center software to aid in your system monitoring.
Getting Started With Sun Management Center Software
This section describes a suggested approach to setting up and using the Sun Management Center software. This process includes a summary of some typical tasks and the order in which you should do them. Each task is referenced to a section in the manual, which provides detailed, step-by-step directions. Your actual steps will vary according to your business needs.
The task sequence presumes that you explore and learn the software before you set up your actual monitoring environment.
-
Install Sun Management Center software. See Sun Management Center 3.6.1 Installation and Configuration Guide for more information about installing and configuring the software.
-
Identify users and privileges for using the Sun Management Center software, as described in Using Access Control. For general information about security, see Chapter 18, Sun Management Center Security.
-
Start the Sun Management Center console. The console provides a graphical interface to managing and monitoring your network. To start the Java Console from a terminal window, type the following command: /opt/SUNWsymon/sbin/es-start -c. For more information, see Chapter 5, Managing Objects in Sun Management Center. To access the Web console, type the appropriate URL in your browser. For more information, see Chapter 15, Managing Objects Using the Web Console.
-
Define a collection of network objects for the software to manage and monitor, as explained in To Create Administrative Domains.
-
Add servers, routers, and other network objects to the administrative domain in the Sun Management Center database. For information about creating objects manually to populate the domain, see Chapter 3, Manually Adding Objects to the Topology Database. For information about using the Discovery Manager to populate the domain, see Chapter 4, Adding Objects to the Topology Database Using the Discovery Manager.
-
Familiarize yourself with the console window and navigate through the hierarchy and topology views as explained in Chapter 5, Managing Objects in Sun Management Center or Chapter 15, Managing Objects Using the Web Console.
-
View detailed information about a managed object, as explained in Chapter 6, Viewing Detailed Information About a Managed Object and Chapter 7, Browsing Information About a Managed Object. More information about viewing specific data properties is explained further in Chapter 8, Monitoring Data Properties, Chapter 9, Viewing Data Properties in a Graph, and Chapter 10, Monitoring Data Property Attributes.
-
Customize the monitoring capabilities of the software by adding or removing module functions, as described in Chapter 11, Managing Modules. For information about the modules that are available within the product, see Appendix C, Sun Management Center Software Modules.
-
Define conditions that should generate and alarm and specify actions to occur when the condition is met, as described in Chapter 12, Managing Alarms. For information about the predefined rules that relate to alarms, see Appendix D, Sun Management Center Software Rules.
-
Create management and monitoring functions that relate to a user-defined group of objects, as explained in Chapter 13, Managing Group-related Jobs.
Note –
For additional information specific to your hardware, see your supplement.
Additional Information
This documentation includes a description of basic and advanced features that are available in the Sun Management Center 3.6.1 product. The features that are available in your environment might include additional software modules or specific hardware information.
Related Hardware Information
Sun Management Centersupports multiple hardware platforms. See the Supported Platforms in Sun Management Center 3.6.1 Installation and Configuration Guide for more information about the supported hardware platforms.
This book describes the software capability that is common to all the supported hardware platforms. Platform-specific information is included in the platform-specific supplements available at http://docs.sun.com.
Note –
For complete information about how you can use the Sun Management Center software to manage and monitor your machines, read both this guide and the appropriate hardware supplements.
Add-on Products
Your Sun Management Center environment might be enhanced by several products. See the related documentation for more information.
-
Sun Management Center 3.6.1 Performance Reporting Manager User's Guide
-
Sun Management Center 3.6 System Reliability Manager User's Guide
-
Sun Management Center 3.5 Service Availability Manager User's Guide
-
Installing and Administering Solaris Container Manager 3.6.1
-
Hardware-specific documentation or platform supplements
Product Documentation
The documentation for Sun Management Center 3.6.1 is not available on the software DVD. The English documents and localized documents are available at http://docs.sun.com.
- © 2010, Oracle Corporation and/or its affiliates
