| Sun Management Center Hardware Diagnostic Suite 2.0 User's Guide |
| Sun Management Center Hardware Diagnostic Suite 2.0 User's Guide |
| C H A P T E R 4 |
|
Running a Hardware Diagnostic Suite Test Session |
This chapter describes how to configure, run, schedule, and review a Hardware Diagnostic Suite test session. The main topics are:
The procedures in this chapter assume that the Hardware Diagnostic Suite is already running as described in Chapter 3.
See Appendix B for descriptions of all Hardware Diagnostic Suite console panels, buttons, and menus.
The following tests require media to be installed before the test is run:
See the appropriate test description in Appendix A for details, and install the necessary media before starting the test.
When the Hardware Diagnostic Suite window is displayed for a host, the system configuration is probed to display devices that can be tested. Select the device that you want to test in the hierarchy view. Expand the hierarchy view if device listings are collapsed.
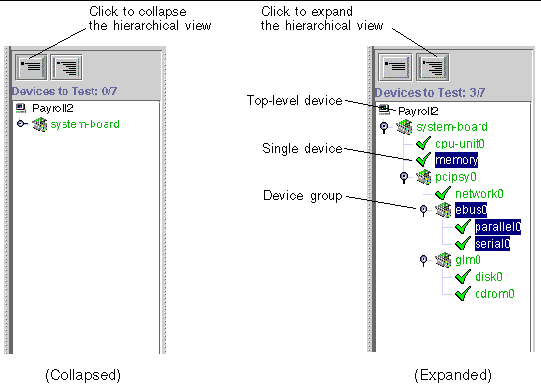
1. If necessary, expand the hierarchy view to show the devices on the host by clicking one of the hierarchy view buttons (FIGURE 4-1).
|
Note - For more details about the Collapse/Expand Hierarchical View panel buttons, refer to Hierarchical View Panel. |
 [ D ]
[ D ]
2. Click the device or device group that you want to test.
The device is highlighted as shown in FIGURE 4-1.
By default, if you select another device, the previous device is no longer selected.
You can select individual devices, entire groups of devices, or the top level device (host) for testing with a single click at the appropriate level.
If you click a device, the Device Display panel shows additional information about that device.
The Hierarchical View panel only displays devices recognized by the Hardware Diagnostic Suite agent when the application is first started. If, for example, you add hot-pluggable devices or perform a dynamic reconfiguration after starting Hardware Diagnostic Suite, use the Reprobe function to check the system and update the list of testable devices.
1. Select Reprobe for Devices from the Options drop-down menu, just above the Hierarchical View panel.
The Hardware Diagnostic Suite agent rechecks the system for all testable devices and displays them in the Hierarchical View panel.
Before you start a test session, make the following decisions:
|
Note - All tests are designed so they will not interfere with the applications that are currently running on a system. |
 After selecting devices to test, click the Full Test button.
Functional tests for each selected device are run sequentially until all tests are complete.
For information about viewing the progress of the test session, refer to Monitoring a Test Session.
After selecting devices to test, click the Quick Check button.
Quick connectivity tests for each selected device are run sequentially until all tests are complete.
For information about viewing the progress of the test session, refer to Monitoring a Test Session.
The Hardware Diagnostic Suite console displays information about each device and each test as it runs and displays the results of each test.
1. View the progress of each test as it runs (FIGURE 4-2).
As each device is tested, device information is shown in the Device Description panel, and test information is displayed in the Progress panel.
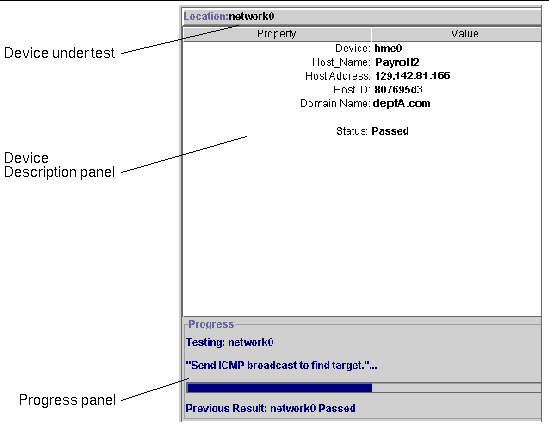
The Progress panel (FIGURE 4-2) displays the following information:
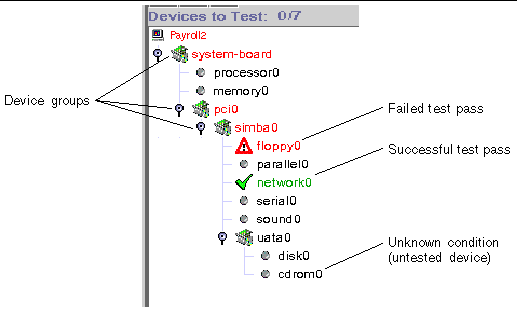
2. View the status of all tested devices in the Hierarchy View.
When a Hardware Diagnostic Suite test detects a successful or failing test on a device, the pass or fail condition is immediately displayed in the Hierarchical View panel (FIGURE 4-3). TABLE 4-2 describes the test indicators.
3. To view additional information about a device, click the device name in the hierarchy view.
If the device is in an unknown (untested) state or has a successful test pass indicator, additional information about that device is displayed in the Device Description panel.
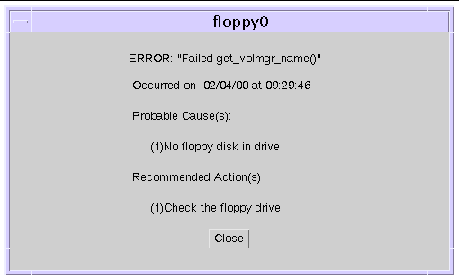
If the device shows a failing test indicator, a pop-up window displays more information about the failure (FIGURE 4-4). This failure information is also recorded in the error log. See Reviewing Test Results.
You can suspend a Hardware Diagnostic Suite test session and resume it as described in the following procedures.
1. While a test session is running, select the Options button to access the Options menu.
The Hardware Diagnostic Suite test session is suspended until you resume it. The progress panel displays, "Testing Suspended."
1. While a test session is suspended, select the Options button to access the Options menu.
The Hardware Diagnostic Suite test session that was suspended starts to run again.
While a test session is running, click the Stop Testing button.
In addition to the test results displayed in the Hierarchical View panel, two log files contain information about every Hardware Diagnostic Suite test session:
1. Select the Logs button, just above the Hierarchical View panel, to access the Logs menu.
2. Select the log (Information or Errors) that you want to view.
A window that contains the Hardware Diagnostic Suite messages is displayed.
TABLE 4-3 describes the types of error messages.
To clear the Hardware Diagnostic Suite console of previous test information, perform a reset as described below.
1. Select the Options button to access the Options menu.
All previous test results are cleared from the console.
|
Note - The Hardware Diagnostic Suite log files are not cleared. |
The Hardware Diagnostic Suite scheduling function creates entries in the superuser's crontab file. When the start date and time criteria are met, the test session, as configured in the Scheduler, starts automatically. You do not need to start Sun Management Center software to run a scheduled test session.
To check the results of any prior test session, view the Hardware Diagnostic Suite log files as described in To View the Hardware Diagnostic Suite Log files.
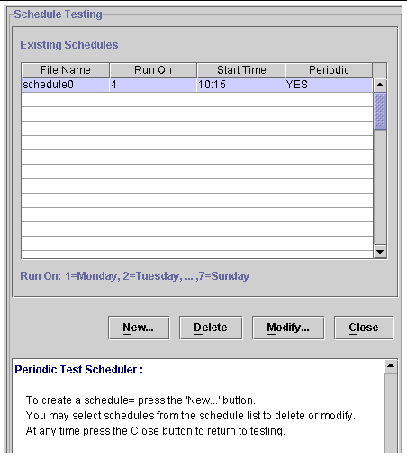
1. In the Hardware Diagnostic Suite console, click the Schedule button.
The Schedule panel with scheduling instructions is displayed (FIGURE 4-5).
|
Note - A scheduled test session will not start if Hardware Diagnostic Suite is already running a test session at that time. |
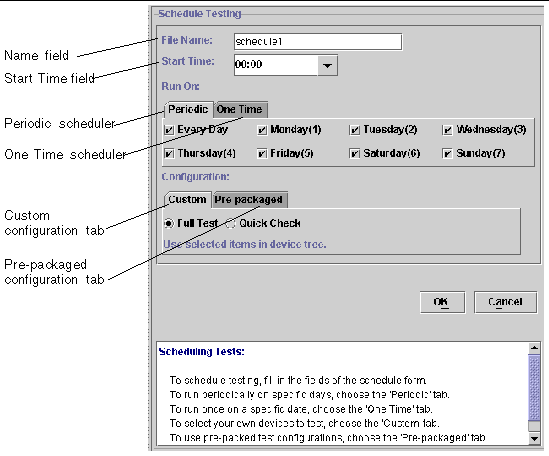
The Schedule Form is displayed (FIGURE 4-6).
 [ D ]
[ D ]
3. Enter a schedule name in the Name field.
You can use the name that is shown in the Name field (the Hardware Diagnostic Suite displays a unique name each time a schedule is created), or specify a different name. The following naming rules apply:
4. Enter the start time for the test session that you are scheduling.
You can use the 24-hour clock settings in 15-minute intervals that are located in the pull-down list, or type in your own start time in the Start Time field.
5. Enter the date for the test session in the Run On field.
6. Configure the test mode and the devices to test in the Configuration field.
There are two methods to do this:
i. Select either Full Test or Quick Check for the test mode (see TABLE 4-1 for test mode descriptions).
ii. Select the devices to test in the Hierarchical View panel.
7. Apply your test session schedule information by clicking the OK button.
Your schedule information is applied, the Schedule Form is closed, and the Schedule panel is displayed. Your new Hardware Diagnostic Suite test session schedule is listed in the Existing Schedules list (FIGURE 4-7).
|
Note - For descriptions of all Scheduling buttons, refer to Schedule Form Buttons. |
8. Exit the scheduling function by clicking the Close button.
1. Select the Schedule button.
The Hardware Diagnostic Suite displays the Schedule panel with the list of schedules.
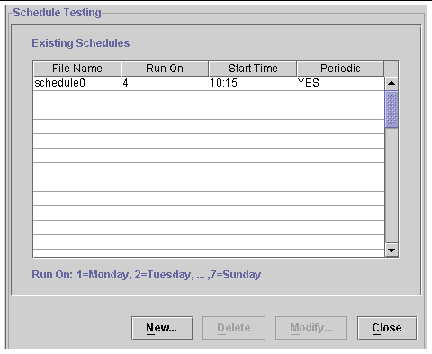
2. Select the schedule that you want to modify.
The Schedule Form is displayed (FIGURE 4-6).
4. Change the schedule entries as needed.
|
Note - If you change the name of the schedule, the Hardware Diagnostic Suite creates another schedule with the newly specified name. It does not modify the name of the original schedule. |
5. Click the OK button to apply your changes.
6. Click the Close button to close the Schedule panel.
1. Select the Schedule button.
The Schedule panel with the list of schedules is displayed.
2. Click the schedule that you want to delete.
The selected schedule is deleted and removed from the list.
4. Select the Close button to close the Schedule panel.
The Hardware Diagnostic Suite agent is aware of dynamic reconfiguration (DR) operations that are performed when you use the cfgadm command (unconfigure or configure). When the Hardware Diagnostic Suite is running and a DR operation is performed, the console is replaced with a message indicating that a DR event is taking place. When the DR operation is finished, the Hardware Diagnostic Suite reprobes the system to determine and display all testable devices.
| Sun Management Center Hardware Diagnostic Suite 2.0 User's Guide | 816-5005-10 |
Copyright © 2003, Sun Microsystems, Inc. All rights reserved.


