| Forte for Java 4, Mobile Edition Tutorial |
| Forte for Java 4, Mobile Edition Tutorial |
| C H A P T E R 2 |
|
Debugging MIDlets and MIDlet Suites |
This chapter describes how to debug MIDlets and MIDlet suites. The Mobile Edition IDE Debugging feature gives you complete control over the debugging process. The Mobile Edition enables you to:
To open the debugging workspace, click the Debugging tab on the main window.
This workspace includes a Debugger window, an Output window, and a Source Editor window. (You can also open just the Debugger window by choosing the main window's Debug  Debug Window option.) This tutorial briefly describes these windows. Refer to the online help for complete information on the debugging workspace.
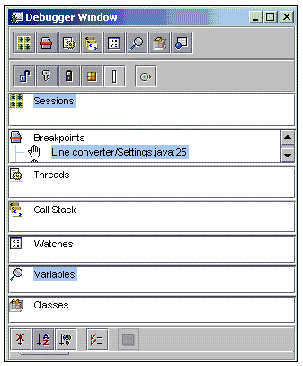
The Debugger window has seven views that show you what is happening in your application. These views enable you to monitor an application's:
You can change the display of these views using the Debugger window's tool bar. (Notice that the icons in each of the views matches an icon in the top tool bar.) The Debugger window's second toolbar lets you control what is displayed in the Variables, Watches, Threads, and Call Stack views. As with other Mobile Edition IDE windows, right-click an item in a window to display its contextual menu. See FIGURE 2-1.
The Output window has two panes. The left pane displays the application output while the right pane displays status messages from the debugger and details of breakpoints and threads.
To debug MIDlets, be sure that the IDE debugger is set to Emulator Debugger.
To verify the IDE debugger settings:
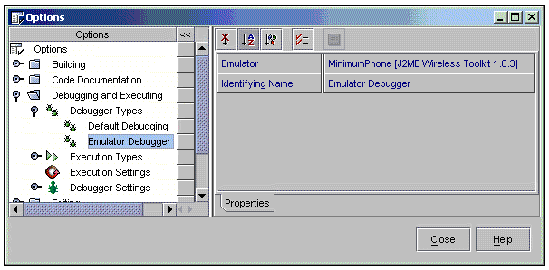
1. In the main window, choose Tools Options.
2. Expand the Options folder, and then expand the Debugging and Executing folder.
3. Expand Debugger types and choose the Emulator Debugger node.
The properties of the Emulator debugger are displayed in the right pane of the window.
4. Verify that the Identifying name of the debugger is Emulator Debugger.
FIGURE 2-2 shows the emulator debugger setting in the Options window.
You can view or set debugging options for an individual class in the Execution tab of the MIDlet Property sheet.
This tutorial illustrates debugging one MIDlet. However, Mobile Edition IDE lets you simultaneously debug any number of MIDlets. The Sessions view of the Debugger window lists the MIDlets that are currently being debugged. You can manage these debugging sessions using the contextual menus in the Session view and by editing a session's properties. These options are documented further in the online help.
Start a debugging session in Mobile Edition IDE by setting a breakpoint in the code and then running the application until it reaches the breakpoint.
To begin debugging a MIDlet, you set a breakpoint in the ConverterMIDlet program.
The breakpoint stops execution of the program at a specific line number, method name, exception, class, variable, or thread. When you set a breakpoint on a variable, method, line, or exception, you can also set a condition that triggers the breakpoint when the condition's expression evaluates to true.
When the debugger reaches a breakpoint, the debugger can suspend debugging and it can also print some text in the Output window. When you set the breakpoint, you can control the actions that are taken when the breakpoint is reached. You set a breakpoint and specify its conditions and actions in the Add Breakpoint dialog box, which you can find from the main window's Debug menu. You can also set a breakpoint in the Source Editor window by positioning the cursor at the breakpoint location and using the Source Editor's contextual menu option Toggle Breakpoint.
1. In the Filesystems tab of the Explorer window, open the code for the myconverter package's ConverterMIDlet in the Source Editor window.
To do this, expand myconverter and double-click ConverterMIDlet.
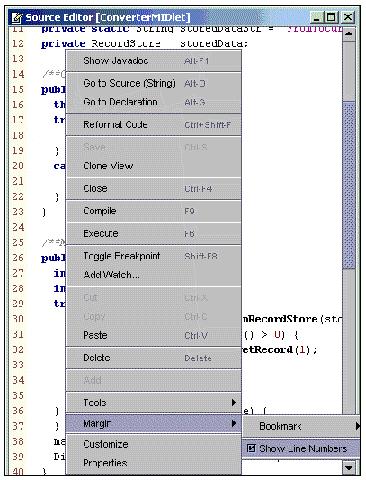
2. Set the Source Editor window to display line numbers for the ConverterMIDlet code. Right-click in the Source Editor window, choose Margin from the contextual menu, and check the box for Show Line Numbers.
It is often useful to see the line numbers for source code when debugging a program, especially since you might want to set a breakpoint on a particular line. You can change the line number display by checking or clearing the Show Line Numbers check box.
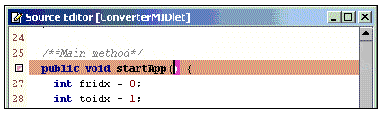
3. Set a breakpoint on the startApp method. In the Source Editor window, click in the margin to the left of the startApp method at line 26.
Notice that Mobile Edition IDE highlights the line of code for which a breakpoint has been set and marks the breakpoint with the appropriate breakpoint icon in the left margin. (Refer to the online help for a complete listing of the different breakpoint icons.)
Run the ConverterMIDlet program in debug mode by using the main window Debug menu. Choose these Debug menu options from the Editing workspace or Running workspace. After you make the selection, Mobile Edition IDE switches to the Debugging workspace and starts the program in debug mode.
 In the Filesystems tab of the Explorer window, expand the package myconverter and highlight ConverterMIDlet. Then, from the main window, choose Debug Start.
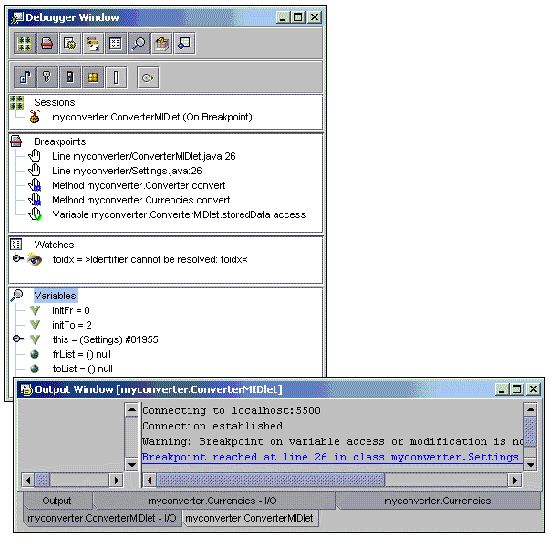
Choosing the Debug Start option changes Mobile Edition IDE to the Debugging workspace and opens the Debugger window. The debugger's current status, such as running, breakpoint location, or finished, appears in the main window's message bar to the right of the Debugging tab. Status messages also appear in the appropriate panes of the Output window. The program runs until the breakpoint at line 26 in the Settings class is reached. The Debugger window and the Output window reflect the current state of the ConverterMIDlet program. Not only does the Debugger window show the breakpoints that have been set, it displays the current sessions and their status (such as stopped or on breakpoint) and the current active variables and their values. (The emulator device skin is also displayed because the program has passed that part of the code.)
From the Debugger window you can examine the current values set for a program's variables, set a watch on a variable, and change a variable's value.
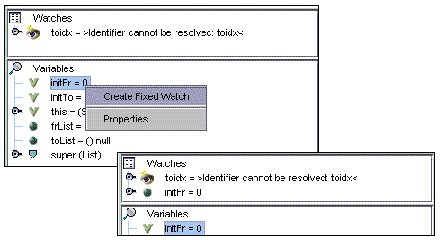
1. Set a Fixed Watch on the initFr variable. Right-click the variable in the Variables view of the Debugger window and choose Create Fixed View from the contextual menu.
Notice that the Variables view in the Debugger window displays the program's variables along with their current values. You can create a fixed watch on a variable that appears in the Variables view. A variable for which a fixed watch has been created appears in the Watches view. Notice that when you create the fixed watch on initFr, it appears in the Watches view as well as the Variables view.
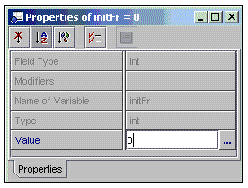
2. Change the value of a variable. Right-click the variable in the Variable view and open its property sheet. From the Property sheet you can enter a new value for the variable.
You can change the value of a variable to test how the value might affect the program's execution.
You can control the debugger's behavior when it steps into a method. Keep in mind that when you step into a method, the source code may not be available to the debugger. Several actions are possible:
The Options window lets you control how the debugger handles these situations. Expand the Debugging and Executing node within the Options window and then expand the Debugger Settings node. Select the Java node and, from its property sheet, set the appropriate value for the Action on Step Into attribute. See FIGURE 2-3.
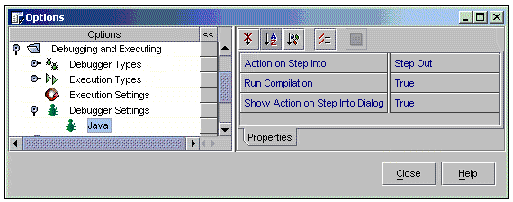
You can also set the debugger to stop and display a dialog box that asks you what action you want to take when you step into a method that has no source. To set this option, set the Show Action on Step Into Dialog attribute to True.
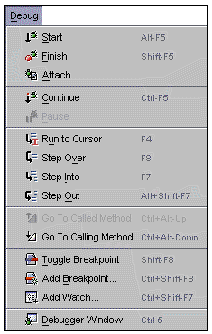
You use the Debug menu options to step through a program. When a program running in the debugger pauses or stops at a breakpoint, one way to resume its execution is to step through the program. From the Debug menu, choose one of three options for stepping through the program: Step Over, Step Into, and Step Out.
Each step option executes the next source line. However, the behavior is different depending on whether the executed line is a method call. If the line is a method call, Step Over executes the entire method without stepping through the individual method instructions. Step Into stops just before executing the first statement of the method. Step Out, however, is a bit different. If the source line is part of a method, Step Out executes the remaining lines of the method and returns control to the method caller. FIGURE 2-4 shows the options that are available from the Debug menu when a program reaches a breakpoint.
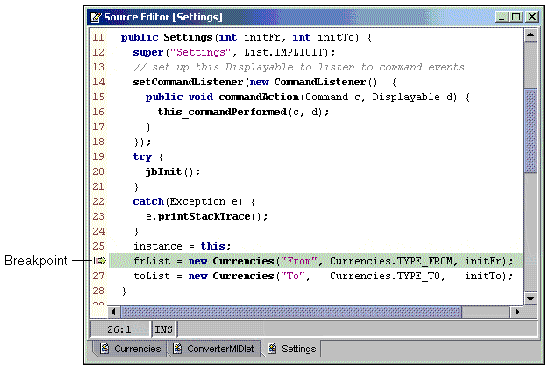
1. Choose the Debug Step Into option to execute the next line of code. If the line of code is a method call, Step Into steps to the first line of the method.
The Source Editor highlights the line of code in the Settings class at which the breakpoint occurs. The program is about to invoke the new method on Currencies. Choose Debug Step Into to go to the first line of this method.
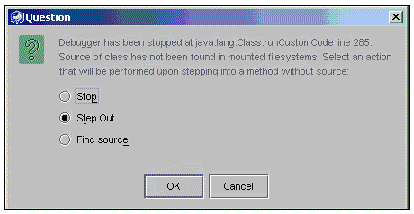
When the debugger cannot locate the source code for a method, it displays an appropriate message.
You can stop execution of the program, step out of the method in question, or have the debugger try to locate the source code. The Step Out option, which is the default, will complete execution of the method and return to the method caller. Note that Step Out in this context is identical to using the Debug Step Out option.
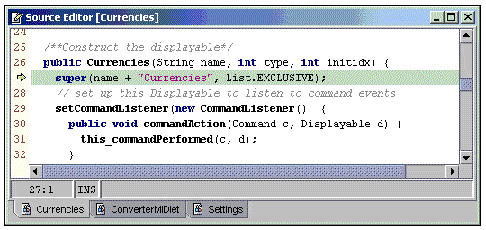
2. When the debugger can locate the method's source code, it opens the code in the Source Editor and highlights the line to which it has stepped. Use DebugStep Out to complete execution of the method.
The program stops at the initialization of a Currencies instance. You can step through the remaining code in this method, or step out of the method to complete its execution in one operation.
3. Execute the next initialization method call without stepping through its individual instructions by choosing Debug Step Over.
Mobile Edition IDE executes the method and moves to the next line of code, which is indicated in the Source Editor window.
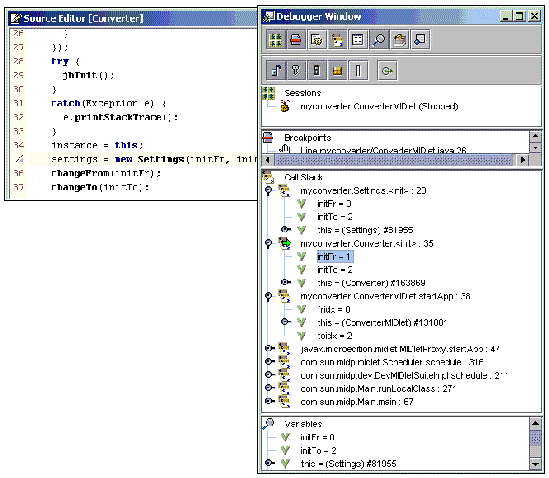
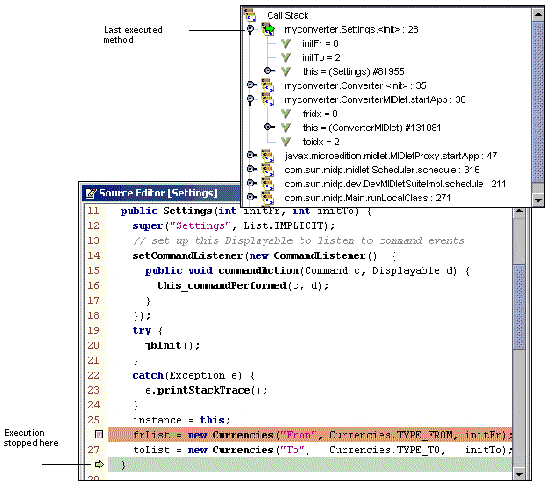
The Debugger window includes a Call Stack view. The Call Stack view shows you the point you are at in the program and the hierarchy of method calls in the current thread that have lead up to this point. The method that was last executing is at the top of the stack, marked with an arrow. The initial method is at the bottom of the stack.
For example, the Converter program is stopped on line 28 in the Settings class. The Call Stack view in the Debugger window has the last executed method, myconverter.Settings.<init>, at the top of the stack. The Source Editor shows that execution has stopped on line 28 in Settings. See FIGURE 2-5.
Use the Debug Go to Calling Method to move down the call stack (that is, towards the initial method at the bottom of the stack).
Executing the Go to Calling Method option moves you to the myconverter.Converter.<init> method, which is the method that called the myconverter.Settings.<init> method. The Call Stack moves its pointer down one method call and the Source Editor marks line 35 in the Converter class that invoked the Settings class. Note that you can examine and change variable values from the Call Stack view. The Call Stack view shows the variables that were in scope when the method was entered. The variables are shown along with their values.
Changing a variable's value is limited to the scope of the method call in which you make the change. The program uses the new value when you continue execution.
From a stopped point, choose Debug Continue.
The program executes until it reaches another breakpoint or finishes.
Choose Debug Pause to stop execution of a program and re-enter debug mode.
This can be useful, for example, when the program is waiting for input from the user but has not reached a breakpoint.
| Forte for Java 4, Mobile Edition Tutorial | 816-5081-10 |
Copyright © 2002, Sun Microsystems, Inc. All rights reserved.