BPEL Monitoring Console User's Guide
What You Need to Know
About the BPEL Monitoring Console
The BPEL Monitoring Console monitors your BPEL Service Engine's applications and business processes, allowing you to quickly discern the health of your system. The console is designed to provide a comprehensive view of your current applications. It provides a real time representation of your business processes throughout the life cycle of each instance. The console also enables you to drill down to see what is happening with any specific application or process. It allows you to track down a business process based on customer information and to suspend and resume an instance for system maintenance.
The BPEL Monitoring Console runs as an independent web application and can run from a remote computer. The console runs on the GlassFish server in a GlassFish ESB environment. The console is designed to provide maximum responsiveness and uses Ajax to ensure that you see each point in process as it happens.
Note –
Currently, the console does not work in a clustered environment.
The main pages of the BPEL Monitoring Console are:
The Dashboard
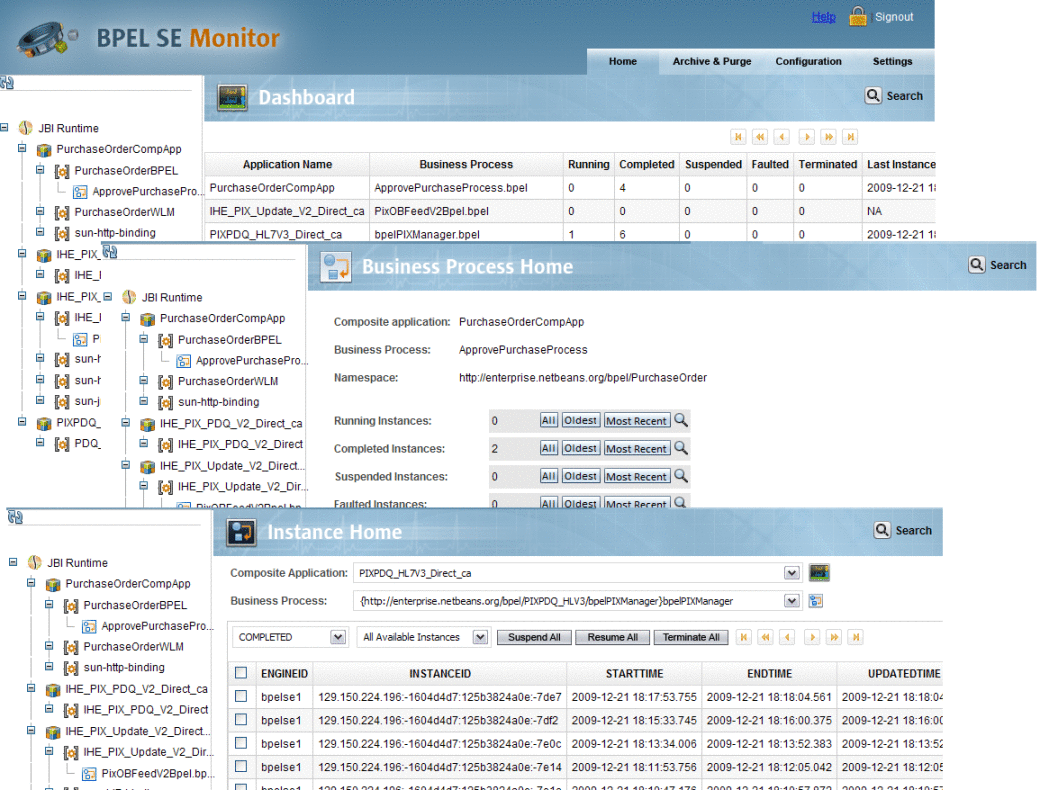
The BPEL Monitoring Console starts with the Dashboard, a top-level window that provides a holistic picture of all your deployed applications.
From the Dashboard you can see:
-
Which processes are running
-
The number of process instances that have completed, faulted, or have been suspended, or terminated
-
The time at which the most recent business process instance occurred
-
The Instance Processing Rate or number of instances for a specified period
The Business Process Home Page
The Business Process Home displays statistical information for the selected business process, similar to the Dashboard. In addition, the Business Process Home provides a graphical model of the business process, as well as a textual display of the business process code for an even finer level of information. From this window, you can drill down into instance information for all instances, oldest instances, or most current instances.
The Instance Home Page
On the Instance Home you can view a group of business process instances or select a specific instance.
From the Instance Home you can:
-
View all completed, suspended, or terminated business process instances
-
Choose specific instances to view, from the oldest to the most recent
-
View the Service Engine, instance ID, start, end, updated time, and status for an instance
-
Look at the life cycle of an instance in real time
-
View the variables for the instance
-
Click on a process instance to display a Process Scalable Vector Graphic (SVG) model of the instance in the real-time current state of execution
-
Suspend, resume, or terminate one or all instances for maintenance or customer service
BPEL Monitoring Console Features
The BPEL Monitoring Console includes the following features:
-
Quickly view the overall status of applications and business processes with a comprehensive statistical view of running, completed, suspended, faulted, and terminated business process instances.
-
Displays the instance process rate (IPR) for a configurable time period.
-
Ability to filter your view from application to process to instance to variable.
-
Ajax enabled for automatic updating.
-
Scalable Vector Graphics (SVG) provide real-time modeling of business processes.
-
Suspend, resume, and terminate functionality for one or all instances of a business process.
Installing and Configuring the BPEL Monitoring Console
The BPEL Monitoring Console is a GlassFish ESB add-on and is installed from the Admin Console.
Installing the BPEL Monitoring Console
The BPEL Monitoring Console is installed as part of the Platinum Pack Installer. For information about installing the Platinum Pack, see Installing the GlassFish ESB Platinum Pack in Using the GlassFish ESB Installation GUI.
Configuring the BPEL Monitoring Console
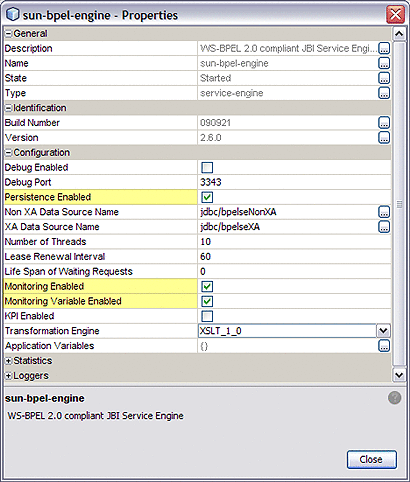
The following properties must be selected in your BPEL Service Engine runtime properties before launching the BPEL Monitoring Console:
-
Persistence Enabled
-
Monitoring Enabled
-
Monitoring Variable Enabled
Once you configure the runtime properties, stop and restart the BPEL Service Engine to create the necessary databases, JDBC connection pools, and JDBC resources.
Configuring the BPEL Monitoring Console
The BPEL Monitoring Console contain three configuration tabs to help you manage the data persisted for monitoring. The tabs include the following:
Archive & Purge
The Archive & Purge tab contains only a Purge subtab. The archive feature is not currently available. The Purge tab provides two purge data functions:
-
Persistence Data: Purges persisted data.
-
Monitoring Data: Purges monitoring data.
Configuration
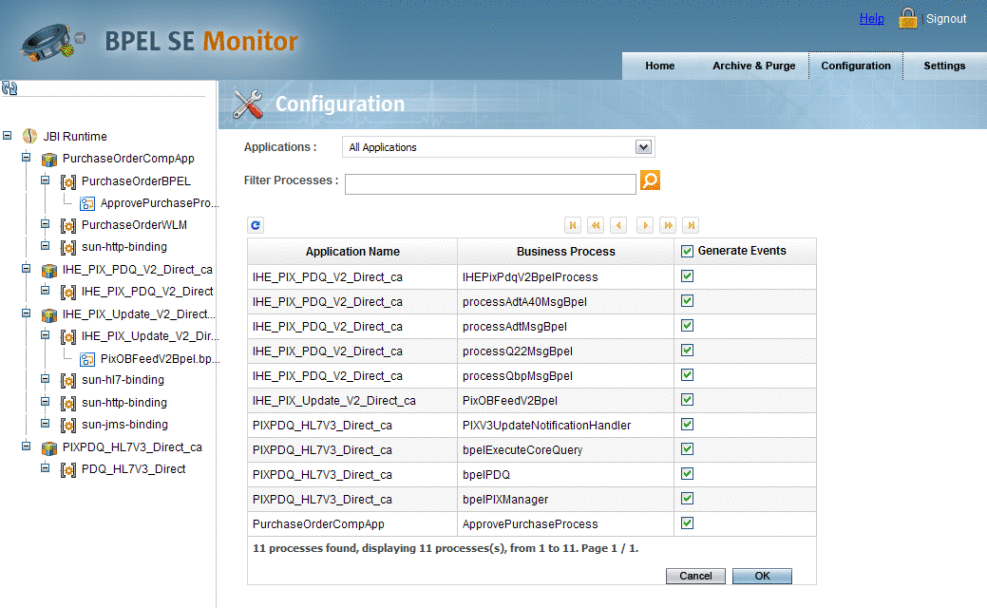
The Configuration tab contains settings that allow you to limit monitoring of specific business processes. Performance can degrade for a business process, depending on the level of monitoring activity. By limiting the level of monitoring for less-critical business process you can minimize performance degradation.
Business process event generation configuration allows you to specify which business processes will receive full monitoring and which will receive limited monitoring. Limited monitoring continues to process statistical information saved in memory, but no longer provides variable data for business process instances.
Use these two fields to filter the list of displayed BPEL processes:
-
Applications: Select from a specific deployed application or all applications. The business processes for your selected applications are listed in the business process table.
-
Filter Processes: Filters for specific business process of an application. Enter the first few letters of the business process name to view conforming business processes from which you can select.
 To Configure Event Generation
The Business Process table displays the selected business processes by application and business process name. Generate Events specifies whether the process receives full or limited monitoring. Enabled indicates that the business process receives full monitoring. Not-checked indicates that the business process will be monitored for statistical information, but no longer provides variable data.
-
Filter the BPEL processes to view the process you want to configure.
-
To generate all events for the process, select the Generate Events check box for the process.
-
To limit the monitoring for the process and only monitor statistical information, deselect the Generate Events check box for the process.
-
When you are done making changes, click OK.
Settings
The Settings tab allows you to define various aspects of your the BPEL Monitor Console pages.
The Settings tab contains three sub-tabs:
-
General: General settings apply to all windows.
Properties:
-
Refresh Period (secs): Specifies whether the Process Scalable Vector Graphic models are refreshed automatically or manually.
-
-
Business Process: Business Process settings apply to Business Process properties displayed by the monitor.
Properties:
-
Instance Processing Rate Calculation Period: Specifies the time period, in seconds, used to determine the rate at which business processes are completed. For example, if the value is set to 3600 (1 hour) the IPR column of the Dashboard will display the number of instances processed in the last hour.
The IPR is dependent on monitoring data. When monitoring data is purged, the IPR is unable to function until a sufficient sample data pool is available.
-
-
Runtime: Runtime settings for the default JBI runtime server information. You should not need to modify these properties.
Properties:
-
HostName: The name of the GlassFish Server.
-
Port Number: The GlassFish port number.
-
User: The GlassFish administrator user name. By default, this is admin.
-
Password: The GlassFish administrator password. By default, this is adminadmin.
-
To apply any changes you make to the settings, click Continue.
Navigating the BPEL Monitoring Console
The BPEL Monitoring Console lets you easily move between windows to see your system from a high-level or from every point of a single business process instance.
The console has three main windows:
-
The Dashboard: Provides a comprehensive, overall view of your deployed applications.
-
The Business Process Home: Provides a view of a selected business process.
-
The Instance Home: Provides a view and management of selected business process instance.
Opening the BPEL Monitoring Console
The BPEL Monitoring Console is a web application and can be opened from most web browsers. The console is automatically deployed as a web application during installation. You can launch the console from the GlassFish Admin Console or just enter the URL in a web browser.
For convenience, it works best to create a bookmark from your web browser or a shortcut on your desktop.
 To Open the BPEL Monitoring Console
-
To open the console from the Admin Console, do the following:
-
To open the console directly in a web browser, enter the following URL:
http://localhost:8080/bpelmonitor
-
Enter a user name and password.
The default user name and password are both bplemonitor.
Moving Between Windows in the Monitor Console
“Drill down” is a term used for moving from a summary view to detailed data. The BPEL Monitoring Console is designed to allow you to drill down from summary information to get to the detail you need for a single business process or process instance. You can quickly move through your deployed applications and business process in the BPEL Monitoring Console, no matter how big or small your system might be.
Navigating The Project Tree
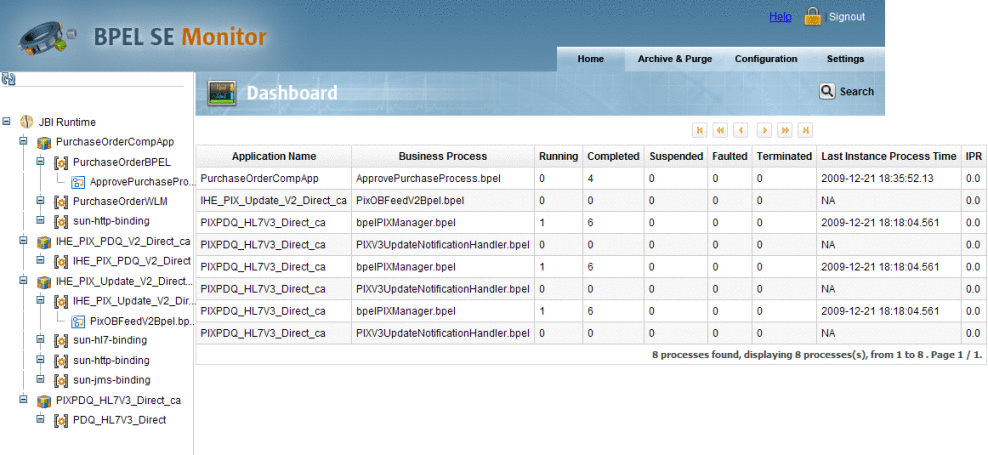
The project tree is in the left pane of each of the console's windows. The tree displays all of the applications currently deployed in BPEL. The tree includes the complete JBI runtime, application nodes, and BPEL process nodes. Navigate through the console windows using the project tree, as follows:
-
JBI Runtime: Displays all deployed applications in the Dashboard
-
Application Node: Displays the business processes of the selected application in the Dashboard
-
Business Process Node: Displays the business process in the Business Process Home
The Dashboard
The Dashboard Table displays all of the currently deployed applications and their business processes. Click on a business process to open the Business Process Home page for that specific process.
The Business Process Home
The Business Process Home displays a real-time list of statistical information for the specific business process instance, such as how many instances are completed, running, suspended, and so on. It also displays the last time an instance was processed and the rate at which they are being processed.
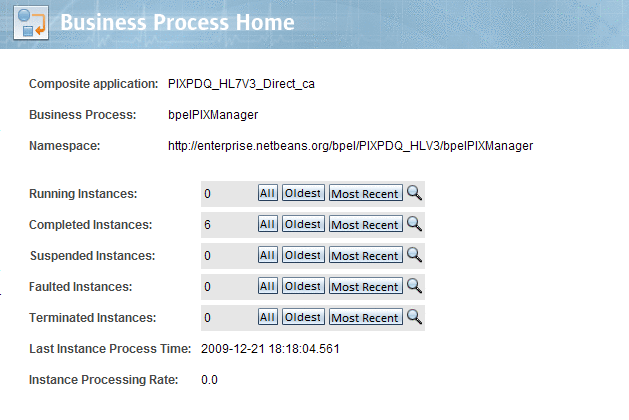
Click on All, Oldest, or Most Recent to display the selected business process instances on the Instance Home page. Click on Search Instances to open the Search Instances window.
Search Instances
The Search Instances option is available on all of the console's main windows. Click the Search icon next to an instance type to open the Search Instances window, or click Search from the main menu.
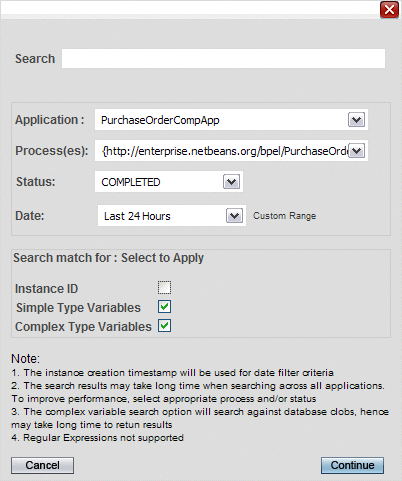
The Search Instances window allows you to search for an instance using the following criteria:
-
Application: Select from a list of currently deployed applications.
-
Process: Select any business process for the selected application.
-
Status: Select from running, completed, suspended, faulted, terminated, or all available process instances.
-
Date: Select 24 hours, 7 days, 14 days, 30 days, 1 year, or all available. You can also select Custom Range to enter your own date range.
-
Search: Enter the instance ID, or use simple or complex type variables for your search. In the lower portion of the Search Instance window, select which of those three to include in the search.
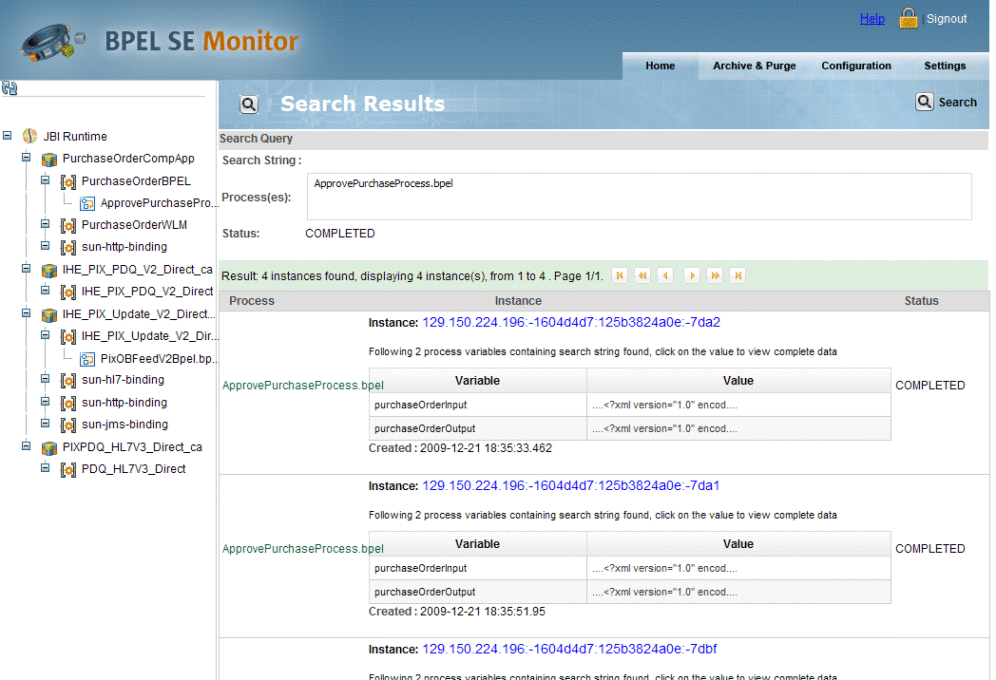
Search results appear on the Search Results window, which displays the business process instances with the following information:
-
Business Process
-
Process instance ID
-
Status
-
Variable names and values
Select the Instance ID to open the Instance Home window with the selected instance.
Instance Home
The Instance Home page displays business process instances in a table. The page also includes functionality to access any available business process instance without leaving the Instance Home page.
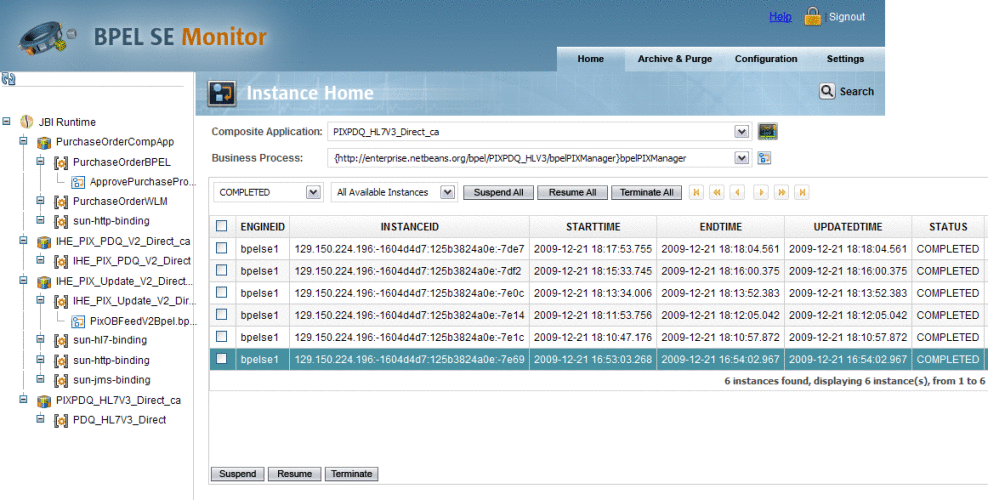
The Instance Home functionality allows you to drill down the instance list by any of the following filters:
-
Deployed Composite Application
-
Business process
-
Business process instances, filtered as:
-
Completed
-
Suspended
-
Faulted
-
Terminated
-
All available statuses
-
-
Instances, which can be further filtered as:
-
Most recent instance
-
Oldest instance
-
All available instances
-
The Instance Home page provides direct links to the Dashboard (Monitor Home) and the Business Process Home (Process Home).
View Variables
From the Instance table click View in the Variables column for an instance. The Variable Data window appears for the selected instance.
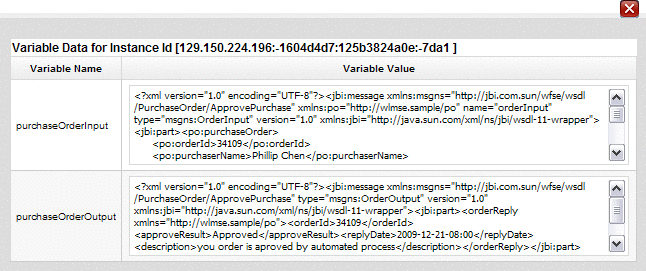
The Variable Data window displays the variable name in the first column and variable value in the second column. If the selected instance is currently running, the variable values are only displayed for those variables that are already populated.
The BPEL Operational Dashboard
The Dashboard, the BPEL Monitoring Console's top-level window, provides a holistic picture of all your deployed applications. From the Dashboard you can determine the overall health of your system and quickly get a sense of how things are going.

The Dashboard tracks the number of process instances for each deployed application and business process. From the Dashboard's table you can follow the progress of your applications by the current tally of instances.
The Dashboard displays the following information:
-
Application Name: The name of the deployed Composite Application project.
-
Business Process: The name of the BPEL business process.
-
Running: The number of business process instances that are currently running.
-
Completed: The number of instances that have completed since the BPEL Service Engine was started.
-
Suspended: The number of instances that are currently suspended.
-
Faulted: The number of instances that have faulted or failed.
-
Terminated: The number of instances that were terminated.
-
Last Instance Process Time: The date and time that the last completed instance.
-
IPR (Instance Processing Rate): The number of instances processes within a user–defined unit of time.
The unit of time for which the IPR is sampled is configured from the Settings -> Business Process tabs. The Instance Processing Rate Calculation Period specifies the sample period in seconds. For example, if you want the sample period to display the number of business process instances for a one hour period, set the Instance Processing Rate Calculation period to 3600 (seconds).
Viewing a Specific Business Process
The Dashboard is designed help you move quickly from a summary view to a specific business process. From the Dashboard, click on any business process to open the Business Process Home page to that specific process. Click Home to return to the Dashboard.
Business Process Home Page
The Business Process Home displays mid-level information about the business process, providing real time statistical information as well as a graphical and textual representation of the process.
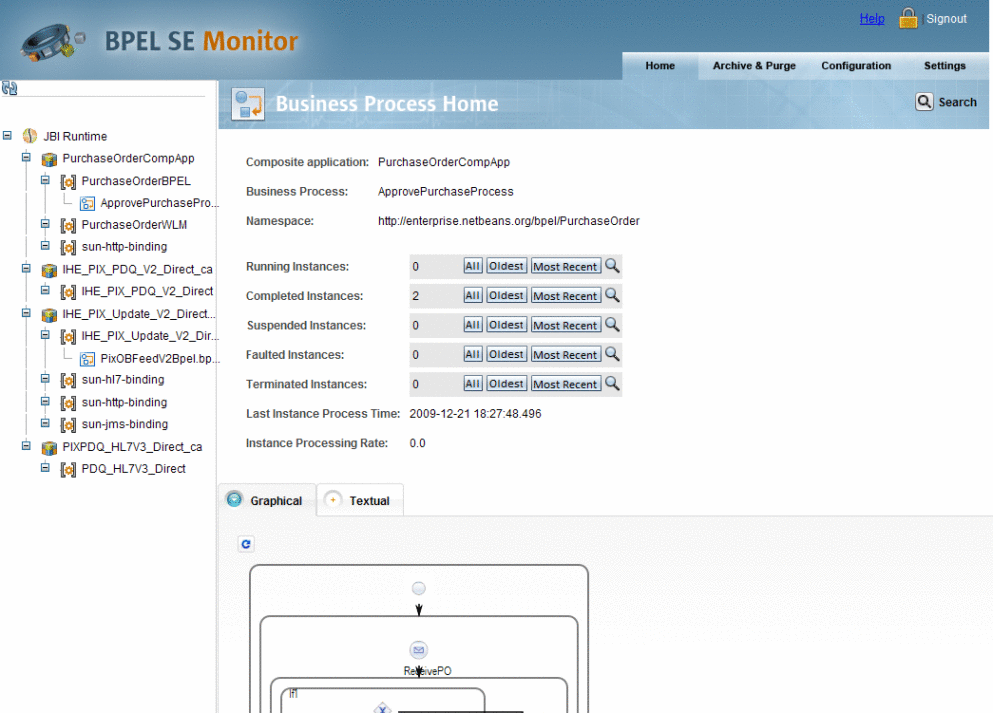
The Business Process Home page displays the following information:
-
Composite Application: The name of the Composite Application project.
-
Business Process: The name of the business process.
-
Namespace: The namespace for the application and the business process.
The Business Process Home page also displays the same statistical data for the business process, that is available on the Dashboard. All data is shown in real-time, presenting the current status of the business process.
-
Running Instances: The number of business process instances that are currently running for the selected business process.
-
Completed Instances: The number of instances that have completed since the BPEL Service Engine was started.
-
Suspended Instances: The number of instances that are currently suspended.
-
Faulted Instances: The number of instances that have faulted or failed.
-
Terminated Instances: The number of instances that were terminated.
-
Last Instance Process Time: The date and time that the last completed instance.
-
Instance Processing Rate: The number of instances processes within a user—defined unit of time.
Next to the first five properties listed above, you can select from any of the following option to view a list of business processes for that status:
-
All: Opens the Instance Home page with all available business process instances displayed.
-
Oldest: Opens the Instance Home page with the oldest business process instances displayed.
-
Most Recent Instance: Opens the Instance Home page with the most recent business process instances displayed.
-
Search Icon: Opens the Search Instances window where you can further search for business process instances.
For more information on specific choices or using Search Instances, see Business Process Home.
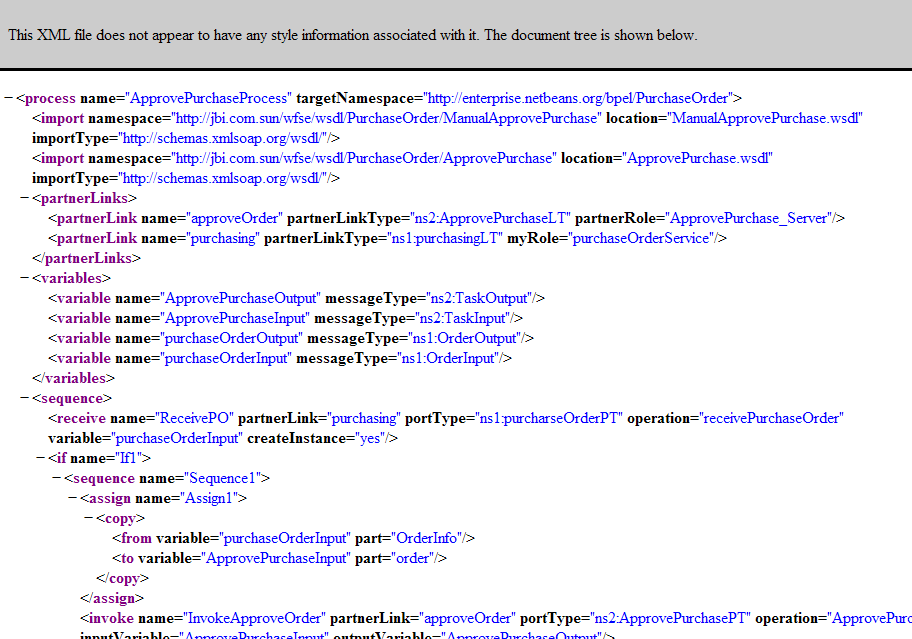
Textual View of the Business Process
The Textual tab displays the business process code in a textual format. This often provides information about a business process that is not available otherwise.
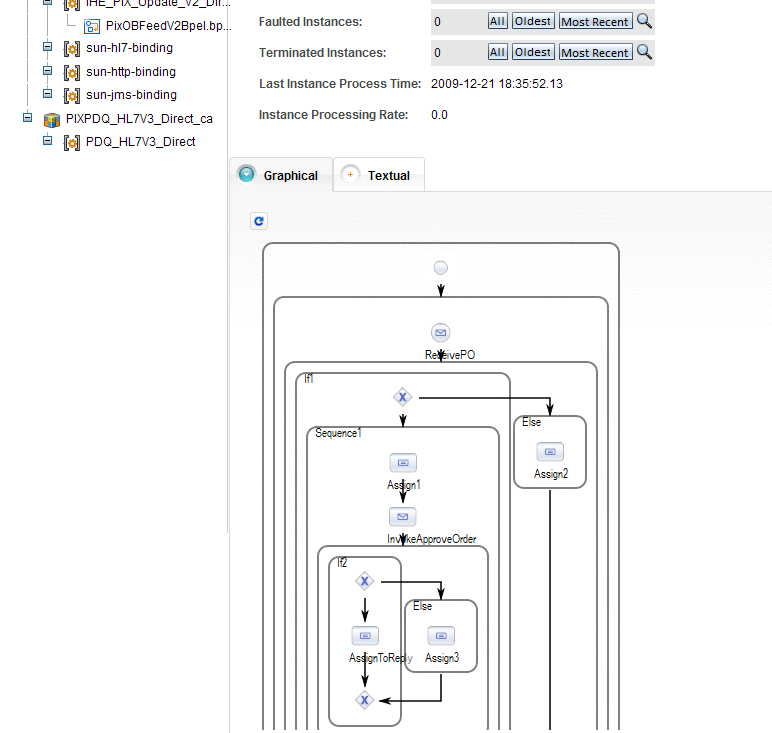
Graphical View of the Business Process
The Graphical tab displays a Scalable Vector Graphic (SVG) model of the business process.
Tip –
If you cannot see the entire business process and the scroll bar is not available, use the Page Up and Page Down buttons on your keyboard to view the hidden portions of the process.
- © 2010, Oracle Corporation and/or its affiliates
