Device Statistics Window
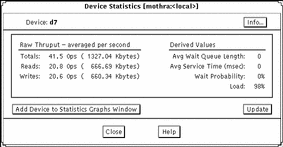
The Device Statistics window, shown in Figure 4-11, displays a "snap-shot" of statistical information about a specific metadevice or physical disk. There are two ways to display this window:
-
Select a metadevice on the Metadevice Editor window's canvas, or a disk on the Disk View canvas, by pointing to it and pressing the SELECT button. Select Statistics from the Object menu.
-
Point to a metadevice displayed on the Metadevice Editor window's canvas, or a disk displayed on the Disk View canvas. Press and hold down the MENU button to display the pop-up menu for the metadevice or disk then select the Statistics option.
Figure 4-11 Device Statistics Window

Table 4-6 explains the Device Statistics Window.
Table 4-6 Device Statistics Window Functionality|
Field |
Functions |
|---|---|
|
Device |
This field displays the device name, for example, d63. |
|
Info |
This button brings up the device's Information window. |
|
Raw Thruput |
This information displays reads, writes, total reads and writes, averaged per second. |
|
Derived Values |
This information displays average wait queue length, average service time, wait probability, and load. |
|
Add Device to Statistics Graphs Window |
This button adds the device to the Statistics Graphs window. The graph area is blank until you select which statistics to graph. The default is Percent Busy. |
|
Update |
This button presents a new snap-shot of the statistical information. |
- © 2010, Oracle Corporation and/or its affiliates
