CDE System Map
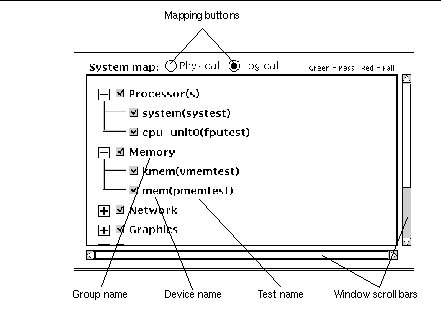
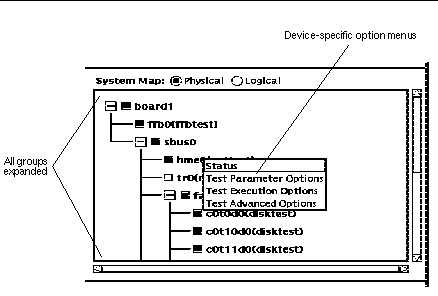
The System map (Figure 4-11 and Figure 4-12) is used to display detailed information about the system under test. Scrollbars provide access to information that is beyond the window size. Such information includes:
-
The devices that were identified by the SunVTS kernel probing. These devices are displayed in one of two ways:
-
Logical mapping (Figure 4-11)--organizes the list of devices, according to their function, into groups. For example, disk, tape, and CD-ROM drives are placed in the SCSI-Devices group. You can focus your testing on a specific group or on all of the groups on the system.
-
Physical mapping (Figure 4-12)--shows the exact location of each device on the system for Field Replaceable Unit (FRU) identification. From Physical mapping, you can determine the actual location of each device. When possible, the board number and controller type for the device are also displayed. This view is only supported on systems that have the configd program. See "To Install SunVTS With the pkgadd Command" for more information.
-
-
Each testable device and the name of the test used to test that device (when device groups are expanded), and access to device specific option menus.
-
A "+" (plus) indicates that the device group is collapsed, meaning individual devices are grouped together and hidden from view under a device category.
-
A "-" (minus) indicates that the device group is expanded so you see each individual testable device for a given category.
-
-
Current state of the devices under test where:
-
Black indicates that the device is not tested
-
Green indicates that at least one test pass completed with no errors detected
-
Red indicates that at least one error has been detected
-
Figure 4-11 CDE System Map (Logical View)

Figure 4-12 CDE System Map (Physical View)

To Access the Device-Specific Option Menus
-
Place the CDE pointer on the name of device that you want to access options for, hold the mouse menu button down, and click the menu you want to set up.
The option menus are described in Table 4-5 below.
-
Set up the menu with the options you need and click Apply.
The Device-specific option menu provides access to test status information and three test option pop-up menus:
Table 4-5 Device-Specific Option Menu| Menu | Description |
|---|---|
| Status | Lists each test instance and a test pass and fail value for each instance |
| Test Parameter Options | Shows device configuration information and specifies test specific settings. This menu is different for each device |
| Test Execution Options |
Provides access to the same test execution options that can be set at the system level (See "Options Menu") but these settings configure test execution for a specific device. The parameters are:
|
| Test Advanced Options | Provides a setting to "lock" the option settings for an individual device so that the system level setting will not affect the option setting for this test |
To Select Devices for Testing
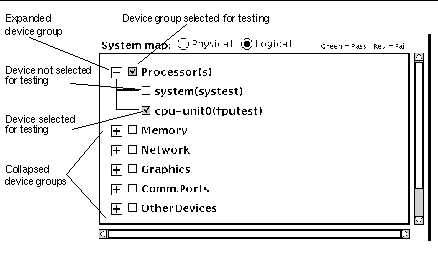
Each device group and device has a checkbox. Refer to Figure 4-13.
-
Perform one of the following:
-
Click the checkbox to place a checkmark in the checkbox. The checkmark indicates that the device or group is selected for testing. A blank box indicates that the device or group is not selected for testing.
-
Choose Default, None, or All in the Test mode selection window.
Note -Certain tests are not selectable until intervention mode is enabled. Refer to "Intervention".
Figure 4-13 Viewing Devices in the System Map

-
Test Status in the System Map
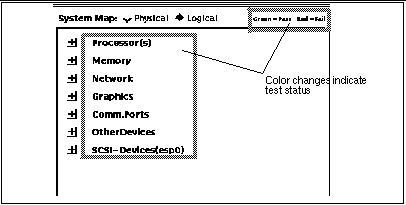
The primary method of displaying pass and fail status uses color within the System Map window (see the outlined areas in Figure 4-14). During testing, the name of any device changes from black to green if it has at least one pass and no failures. The moment a device has at least one failure, it changes to red. This color information is propagated up an entire branch of the hierarchy, but keeps the System Map hierarchy closed.
A secondary level of status is the individual device pop-up window that displays the testing Pass and Fail counts for the device and its immediate subdevices. For the lowest level device, it displays the test status for that device and all of the test instances below it. You can choose devices that you want to monitor during testing, and you can display the corresponding status windows, which are dynamically updated during testing.
Note -
The boxed regions in Figure 4-14 show areas that change color to indicate test status on color monitors. If you have a monochrome monitor, these changes cannot be detected; in this case, rely on the status pop-up windows.
- © 2010, Oracle Corporation and/or its affiliates

