| Analyzing Program Performance with Sun WorkShop |
Sampling Analyzer Reference
This chapter discusses the Sampling Analyzer and how to use it. It covers the following topics:
- Starting the Analyzer and Loading an Experiment
- The Analyzer Window
- Examining Metrics for Functions and Load-Objects
- Examining Caller-Callee Metrics for a Function
- Examining Annotated Source Code and Disassembly Code
- Filtering Information
- Generating and Using a Mapfile
- Using the Data Option List to Access Other Data Displays
- Adding Experiments to the Analyzer
- Dropping Experiments from the Analyzer
- Printing the Display
The Sampling Analyzer analyzes the program performance data collected by the Sampling Collector. It reads in experiment-record files generated by the Collector and provides you with options for examining and manipulating the experiment data, so you can identify program execution bottlenecks and analyze and improve program performance.
See Chapter 2 for examples of how you might use the Analyzer to fine-tune an application.
See Chapter 6 for a description of program execution and the behavior you see in the Analyzer.
Starting the Analyzer and Loading an Experiment
Note – Loading an experiment discards all data for any previously loaded experiment in the Analyzer. However, it does not affect recorded experiments.
To use the Analyzer, you must start it and load an experiment record into the Analyzer window. You can do this from the command line:
- Type the following, where experiment_name is the name of the experiment record file you want to load:
analyzerexperiment_name
- Experiment names are usually of the form
test.n.er.Or you can open the Analyzer from the main Sun WorkShop window or the Sampling Collector window, and then load the experiment:
1. Click the Analyzer button in either the main Sun WorkShop window or the Sampling Collector window.
2. In the Load Experiment dialog box, which opens automatically when you start the Analyzer without specifying an experiment, double-click the experiment record file that you want to load.You can also use the Load Experiment dialog box to load an experiment at any time when the Analyzer is running:
- Choose Experiment
Load from the Analyzer main menu bar to open the Load Experiment dialog box.
Analyzer Command-Line Options
There are two command-line options you can use when you invoke the Analyzer from the command line. They are described in TABLE 4-1:
Exiting the Analyzer
- Choose Experiment
Exit from the Analyzer main menu bar.
The Analyzer Window
The Analyzer window is the main display that you see when you open the Analyzer. The window contains a main menu bar, upper and lower tool bars, and a central display pane in which the experiment data appears.
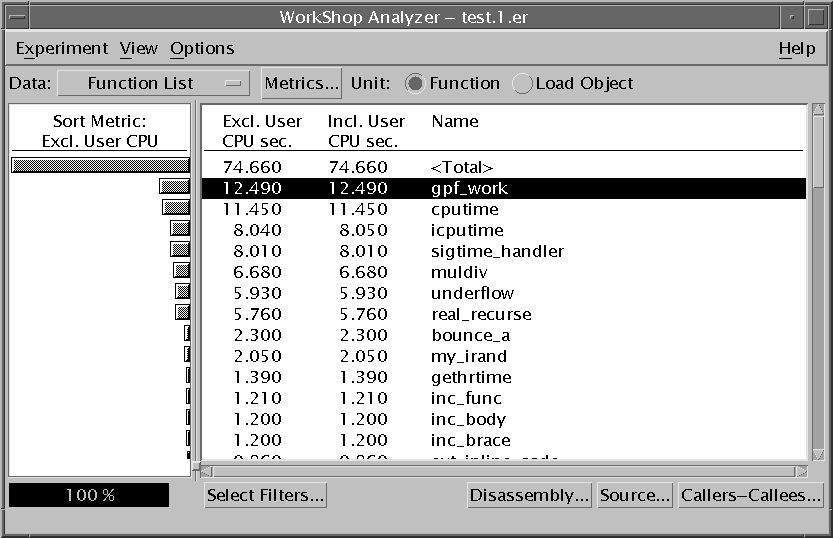
FIGURE 4-1 The Analyzer WindowExamining Metrics for Functions and Load-Objects
The Function List is the default display that appears when you open the Analyzer. It contains metrics specific to functions and load objects. It is divided into two display panels:
- The left display panel contains a histogram representation of the metric on which the data is sorted.
- The right display panel shows a table of function or load-object metrics. The name of the function or load object to which the data in that row applies is shown to the right of each row in the table.
For each function or load-object metric displayed, the Function List provides an absolute value in seconds or counts and a percentage of the total program metric.
Viewing Metrics for Functions and Load Objects
By default, the Function List displays function metrics.
To switch to load-object metrics:
- Choose Load Object from the Unit radio buttons in the upper tool bar.
To return to the function metrics display:
- Choose Function from the Unit radio buttons in the upper tool bar.
Understanding the Metrics Displayed
The Function List can display the following types of function and load-object metrics:
- Clock-based profiling metrics
- Thread synchronization wait tracing metrics
- Hardware-counter overflow profiling metrics
See What the Sampling Collector Collects for a description of each data type.
By default, assuming that the supporting data has been collected, the Function List displays the following metrics:
- Exclusive user CPU time
- Inclusive user CPU time
- Inclusive thread-synchronization wait time (if recorded)
- Inclusive thread-synchronization wait counts (if recorded)
- Exclusive hardware-counter overflow profiling counts (if recorded)
- Inclusive hardware-counter overflow profiling counts (if recorded)
The metrics are sorted on exclusive user CPU time, if it has been recorded.
In the Select Metrics dialog box you can select other data to display and specify a different sort order. See Selecting Metrics and Sort Order for Functions and Load-Objects for instructions.
Clock-Based Profiling Metrics
Clock-based profiling is based on wall-clock time. It shows how much time, exclusive and inclusive, your program spends in each function or load object, which helps to identify where program bottlenecks are occurring. (See Exclusive, Inclusive, and Attributed Metrics for an explanation of exclusive and inclusive metrics.)
Clock-based profiling data supports the following execution-time metrics for each function in the program:
- User CPU time. Time during which your application is running on the CPU.
- Total LWP time. Total execution time across all LWPs.
- Wall-clock time. LWP time spent in thread 1, within the operating system or in trap state for the LWP.
- System CPU time. Total CPU time.
- System wait time. LWP time spent waiting for the CPU, for a lock, or for a kernel page, or time spent sleeping or stopped.
- Text-page fault time. LWP time spent waiting for a text instruction or page.
- Data-page fault time. LWP time spent waiting for a data page.
You have the option of examining each of these values in seconds and as a percentage of the total program metric. Except for wall-clock time, all metrics are summed across all LWPs.
Thread-Synchronization Wait Tracing
In multithreaded programs, thread synchronization wait tracing keeps track of wait time on calls to thread-synchronization routines in the threads library; if the real-time delay exceeds a certain user-defined threshold, an event is recorded for the call, and the wait, in seconds, is recorded.
Synchronization wait tracing supports, for each function or load object, data concerning the count of events recorded and the total number of seconds over threshold spent waiting on calls to thread-synchronization routines. From this information you can determine if functions or load objects are either frequently left on hold, or experience unusually long wait times when they do make a call to a synchronization routine.
High synchronization wait times indicate contention among threads. You can reduce the contention by reworking your algorithms, particularly restructuring your locks so that they cover only the data for each thread that needs to be locked.
Hardware-Counter Overflow Profiling
Hardware-counter overflow profiling records the callstack of each LWP at the time the hardware counter of the CPU on which the LWP is running overflows. The data recorded includes a timestamp and the IDs of the thread and the LWP.
Typically, hardware-counter overflow profiling supports data on instruction-cache misses, data-cache misses, cycles, or instructions issued or executed.
High counts of cache misses indicate that restructuring to improve locality or increase reuse will improve program performance.
High cycle counts generally correlate with high clock-based profiles, though a cycle experiment reduces the chance of correlation with the clock.
Selecting Metrics and Sort Order for Functions and Load-Objects
If you suspect that your program performance is being affected by a particular problem, you can limit what appears in the Function List display to metrics reflecting only that problem.
To change the types of data that appear in the Function List display and their sort order:
1. In the Function List display, click the Metrics button in the upper tool bar.
- The Select Metrics dialog box appears.
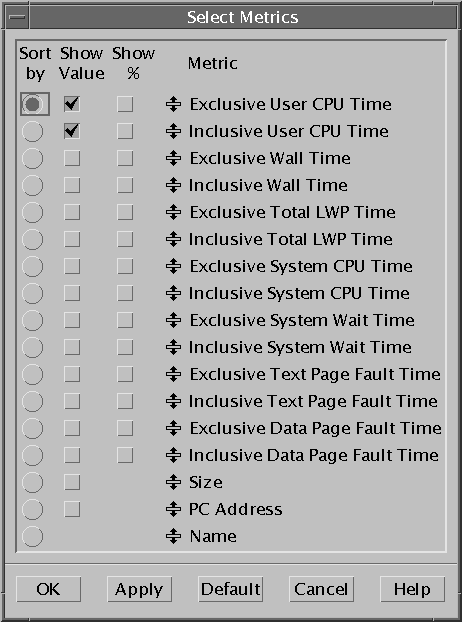
FIGURE 4-2 The Select Metrics Dialog Box
- The types of data listed in the Select Metrics dialog box depend on the data collected by the Sampling Collector. If all data types were selected when the Collector was run, the following metrics, exclusive and inclusive, are available from the Metrics dialog box:
- User CPU time
- Total LWP time
- Wall-clock time (LWP time in thread 1)
- System CPU time
- System wait time
- Text-page fault time
- Data-page fault time
- Synchronization-wait counts (if recorded)
- Synchronization-wait time (if recorded)
- Hardware-counter overflow profiling counts (if recorded)
- All the previously listed data is available as absolute values (time in seconds or counts) and as a percentage of the total program metric.
- In addition, you can choose to display the following for functions or load objects:
- Size, in bytes
- Program-counter address
- The names of functions or load objects are always displayed.
2. To display a particular type of metric, select the appropriate check box in the "Value" or "%" column of the Select Metrics dialog box.3. To specify sort order, select the appropriate radio button from the "Sort" column of the Select Metrics dialog box.4. To make your selections appear in the Function List display, click OK to close the Metrics dialog box, or click Apply to apply the new selections and keep the dialog box open.
Note – To customize how the metrics are grouped in the Select Metrics dialog box, click on the icon next to a metric name, then drag and drop it onto the metric above which you want it to appear.
Viewing Summary Metrics for a Function or Load Object
You can use the Summary Metrics window to view the total available metrics and other information for a selected function or load object in table form instead of as part of the Function List display.
To see summary metrics for a function or load object:
1. Use the Unit radio buttons to select function display or load-object display.2. Select the function or load object by clicking it in the right Function List display pane.3. Choose ViewShow Summary Metrics to open the Summary Metrics window.
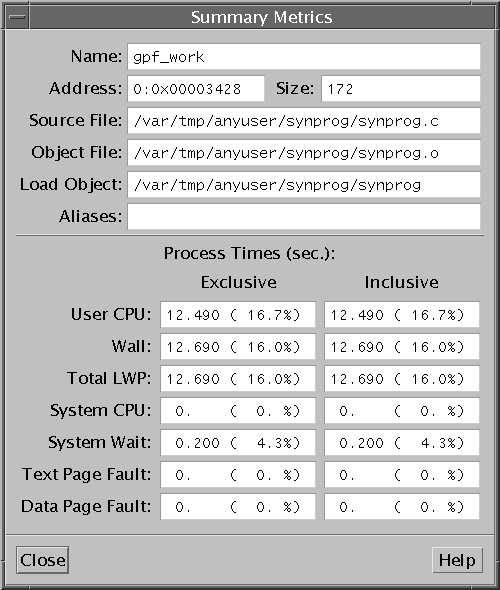
FIGURE 4-3 The Summary Metrics WindowThe Summary Metrics window contains the following information, exclusive and inclusive, for the selected function or load object, if the information has been collected by the Collector:
- Memory address
- Size of the function (in bytes)
- User CPU time
- Total LWP time
- Wall clock time (LWP time in thread 1)
- System CPU time
- System wait time
- Text-page fault time
- Data-page fault time
- Synchronization wait count (if recorded)
- Synchronization wait time (if recorded)
- Hardware-counter overflow profiling count (if recorded)
Note – All data in the Summary Metrics window can be copied to the clipboard and pasted into any text editor.
In addition, for functions, the Summary Metrics window lists the source file, object file, and load object where code for the function resides.
Note – Metrics do not have to appear in the Function List display to be visible in the Summary Metrics window. You can use the Summary Metrics window to access all available function data without using the Select Metrics dialog box to change the Function List display.
Searching for a Function or Load Object
The Analyzer includes a search tool that you can use to locate a function or load object in the Function List display.
To search for a particular function or load object:
1. Choose ViewFind to open the Find dialog box.

FIGURE 4-4 The Find Dialog Box2. In the Search String text box, type a string to search on.3. You can specify the search direction by selecting one of the Direction radio buttons. The default is Forward.4. Click Apply.
- If the search is successful, the row of data for the function that you searched on is highlighted in the Function List display.
5. To search for other function names matching the search string, click Apply.6. To reset the Search String text box to the last successful search, click Reset.
Note – The Analyzer Find feature uses UNIX regular expressions. Thus, wherecis any character,c*does not indicate the string consisting ofcfollowed by zero or more other characters, but zero or more instances ofc. For a complete description of UNIX regular expressions, see theregexp(5) man page.
Examining Caller-Callee Metrics for a Function
You can examine caller and callee metrics for a selected function in the Analyzer's Callers-Callees window. To access the Callers-Callees window:
- Click the Callers-Callees button in the lower tool bar.
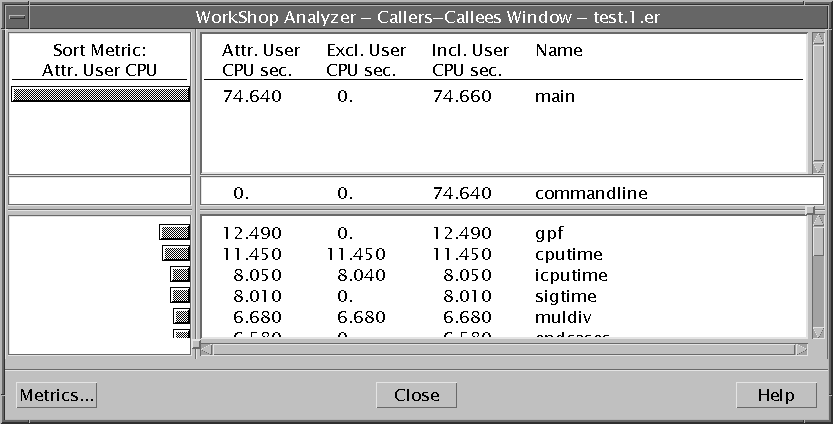
FIGURE 4-5 The Callers-Callees WindowThe Callers-Callees window contains a center pane with information about the selected function, an upper pane with information about the function's caller, and a lower pane with information about the function's callees, if any. Each of these panes is divided into two panels:
- The left panel contains a histogram representation of the metric on which the data is sorted.
- The right panel shows a table of function metrics; to the right of each row in the table is the name of the function to which the data in that row applies.
The Callers-Callees window can display the following metrics for the selected function, any functions that call it, and any functions it calls, if the information was collected by the Sampling Collector:
- User CPU time
- Total LWP time
- Wall clock time (LWP time in thread 1)
- System CPU time
- System wait time
- Text-page fault time
- Data-page fault time
- Synchronization wait count (if recorded)
- Synchronization wait time (if recorded)
- Hardware-counter overflow profiling count (if recorded)
Each of these metrics can be displayed as an absolute value (seconds or counts) and as a percentage of the total program metric.
By default, the Callers-Callees window shows the following metrics:
- Attributed, exclusive, and inclusive user CPU time
- Attributed and inclusive synchronization wait counts
- Attributed and inclusive synchronization wait times (if recorded)
- Attributed hardware-counter overflow counts (if recorded)
The metrics are sorted on attributed user CPU time.
You can navigate through your program's structure by clicking on a function in either the Caller pane or the Callee pane; the display recenters on the newly selected function. By observing exclusive, inclusive, and attributed times, you can locate any function that uses large amounts of execution time.
Selecting Metrics and Sort Order in the Callers-Callees Window
You can specify the data displayed in the Callers-Callees window and its sort order from the Select Callers-Callees Metrics dialog box.
To open the Select Callers-Callees Metrics dialog box:
- Click Metrics in the Callers-Callees window.
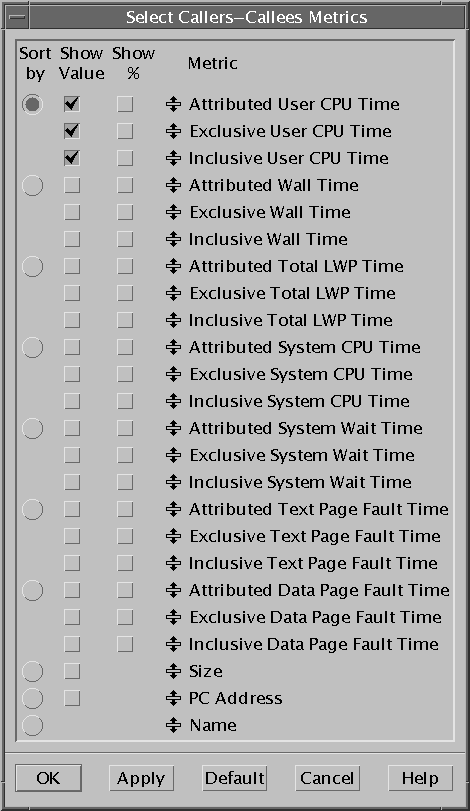
FIGURE 4-6 The Select Callers-Callees Metrics Dialog BoxThe Select Callers-Callees Metrics dialog box operates the same way as the Select Metrics dialog box, except that for metrics with attributed, exclusive, and inclusive data, you can sort only on attributed data. (See Selecting Metrics and Sort Order for Functions and Load-Objects.)
Note – To customize how the metrics are grouped in the Select Callers-Callees Metrics dialog box, click on the icon next to a metric name, then drag and drop it onto the metric above which you want it to appear.
Examining Annotated Source Code and Disassembly Code
Once you have identified the function or functions that are slowing program execution, you can generate source code or disassembly for the trouble spot, annotated with performance metrics, so you can identify the actual lines or instructions that are causing the problem.
To display annotated source code for a function:
1. Click on the function in the right Function List display pane to select it.2. Click Source in the lower tool bar of the Analyzer window.
- Your text editor opens, showing the code for the selected function, with performance metrics for each line of source code displayed to the left of the code.
The four types of metrics that can appear on a line of annotated source code are explained in TABLE 4-2.
To generate annotated disassembly code for a function:
1. Click on the function in the right Function List display pane to select it.2. Click Disassembly in the lower tool bar of the Analyzer window.
- Your text editor opens, displaying the disassembly code for the selected function, with performance metrics for each instruction displayed to the left of the code.
Note – If the source for your program is available, and you click Disassembly to generate annotated disassembly code, the source code appears interleaved with the disassembly listing. If the source code is not available, you can still examine the disassembly code.
The types of metrics in the annotation are those that appear in the Function List display at the time you invoke the source or disassembly code. To change the metrics, use the Select Metrics dialog box to change the Function List metrics, then reinvoke the annotated source code or disassembly code.
Choosing a Text Editor
The annotated source code and disassembly code open in a text editor, so you can begin editing the code to correct problems. You have the option of choosing the text editor you want to use.
1. In the Function List display, choose OptionsText Editor Options to open the Text Editor Options dialog box.
2. From the Editor to Use list box, choose the editor that you want to use.
- The available editors are NEdit, Vi, GNU Emacs, XEmacs, and gvim.
Note – Not all of the WorkShop text editors are available in all locales.
Filtering Information
You can process information more efficiently if you can focus on the part of your program where you think a problem may be occurring. The Analyzer allows you to filter the experiment information in several ways:
- By load objects
- By samples, threads, and/or LWPs
Selecting Load Objects
For purposes of performance analysis, you probably do not want to display information about all the load objects in your program; for example, you might want to see only the metrics that apply to your program files, and not to any system libraries. The Analyzer allows you to specify which load objects you want to examine metrics for in the Function List and Overview displays.
To select one or more load objects for which to display information:
1. Choose ViewSelect Load Objects Included to open the Select Load Objects Included dialog box.
2. In the list box, click the files you do not want to display to deselect them. If a file that you want to display is not selected, click it to select it. You can also use the Select All and Clear All buttons select or deselect all the load objects listed.3. Click OK to apply your selections and close the Select Load Objects Included dialog box.Selecting Samples, Threads, and LWPs
You can also limit the information by specifying only certain samples, threads, and LWPs for which to display metrics. Metrics in the Function List and Overview displays appear only for those samples, threads, and LWPs that you select.
Note – When a sample is selected, a drop shadow appears behind it in the right Overview display pane. See Examining Sample Overview Information for instructions on how to access the Overview display.
You can select samples, threads, and LWPs individually, in ranges, or in groups of any order:
- Click the Select Filters button in the lower tool bar of any display.
The Select Filters dialog box appears, with the following text boxes:
- Samples
- Threads
- LWPs
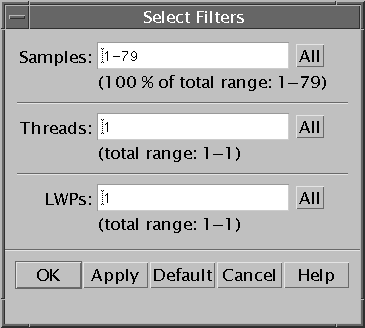
FIGURE 4-7 The Select Filters Dialog BoxUse these text boxes to specify the samples, threads, and LWPs for which you want to display data. You can select samples, threads, and LWPs in any number and any combination.
To select a single sample, thread, or LWP:
- Type the ID number of the sample, thread, or LWP in the appropriate text box and press Enter.
To select a range of samples, threads, or LWPs:
- Type the lower and higher IDs of the range in the appropriate text box, separated by a hyphen (for example,
5-12) and press Enter.To select a non-contiguous set of samples, threads, or LWPs:
- Type the sample IDs in the appropriate text box, separated by commas (for example,
3,7,15,21) and press Enter.To select all samples, threads, or LWPs in the experiment record:
- Click the appropriate Samples, Threads, or LWPs All button.
Generating and Using a Mapfile
Using the data from the experiment record, the Analyzer can generate a mapfile that you can use with the static linker (
ld) to create an executable with a smaller working-set size, more effective I-cache behavior, or both.1. Ensure that your program is compiled using the-xFoption, which causes the compiler to generate functions that can be relocated independently. For example:
- For C applications, type:
cc -xF -c a.c b.c%cc -oapplication_namea.o b.o- For C++ applications, type:
CC -xF -c a.cc b.cc%CC -oapplication_namea.o b.o- For Fortran applications, type:
f95 -xF -c a.f b.f%f95 -oapplication_namea.o b.o- If you see the following warning message, check any files that are statically linked, such as unshared object and library files, to ensure that these files have been compiled with the
-xFoption:
Create Mapfile. The Create Mapfile dialog box is diplayed.
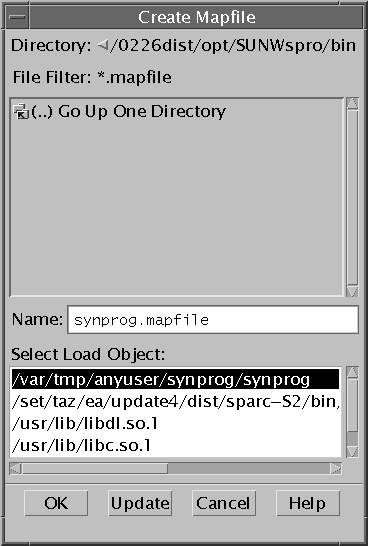
FIGURE 4-8 The Create Mapfile Dialog Box5. In the Create Mapfile dialog box, use the directory pane, if necessary, to navigate to the directory where you want to store the mapfile.6. You can use the Name text box to:
- Change the file filter to display the name of an existing file and select it for overwriting
- Type in a path and file name for the mapfile that are different from the default
7. In the Select Load Object list box, select the load object for which you want to generate the map file (this is usually your program segment).8. Click OK.To use the mapfile to reorder your program:
- Link your object files as you normally would, using the mapfile. For example:
Using the Data Option List to Access Other Data Displays
When you first open the Analyzer window and load an experiment, the Function List, which contains function and load-object information, is the default display. See Examining Metrics for Functions and Load-Objects for more information about the Function List.
You can use the Data option list in the upper tool bar to change the contents of the display pane to show other kinds of data:
- Overview. High-level sample information; see Examining Sample Overview Information for more information.
- Address-space. Information about how your program uses memory; see Examining Address-Space Information for more information.
- Execution statistics. General information about how your program executed; see Examining Execution Statistics for more information.
You can return to the Function List from other displays by choosing Function List from the Data option list.
Note – Any information that you want to examine in the Analyzer must be collected and stored in an experiment record by the Collector. See Collecting Performance Data in Sun WorkShop for information on how to determine which data the Collector collects and stores in an experiment record.
Examining Sample Overview Information
- Choose Overview from the Data list box.
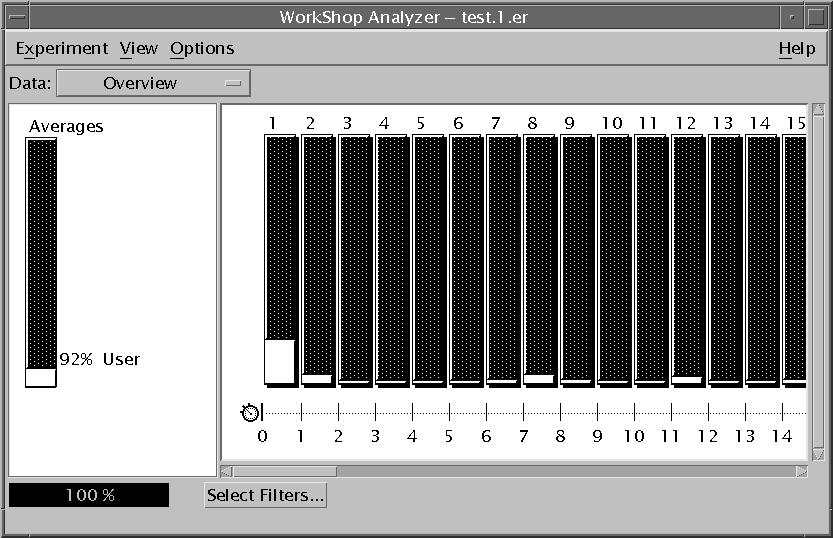
FIGURE 4-9 The Overview DisplayThe Overview display contains information about process times during part or all of program execution. It is divided into two panes:
- The left display pane contains a graph showing average time spent in various process states for the sample or range of samples selected.
- The right display pane contains a series of graphs showing the time spent in various process states for each sample selected for display. Each graph represents the sampling information collected by the Collector during a single sampling interval. The sample's ID number appears above the sample.
Viewing Proportional and Fixed-Width Displays
The default display for the samples in the Overview display is Fixed Width--that is, the sample graphs are all the same width, whether each sampling interval is the same length or not. You can change this to a proportional representation of the samples based on the length of each sample interval.
To switch to a proportional display:
- Choose Options
Set Overview Column Width
Proportional.
To switch back to a fixed-width display:
- Choose Options
Set Overview Column Width
Fixed.
Viewing Detailed Information About Samples
Before you can get detailed information about a sample or samples, you must select the samples. See Selecting Samples, Threads, and LWPs for instructions.
The left display pane in the Overview display shows, for all the samples selected, the average time spent in various process states, and the percentage of the sampling time represented by each state. For example, over one set of samples, the program could have spent 23% of the time executing user code, 50% of the time in system wait, and 27% of the time in other states, times for which are too small to represent in the graph.
To see a more detailed analysis of the sample information, including process state metrics too small to show up in the sampling graphs:
- Choose View
Show Sample Details from the main Analyzer menu.
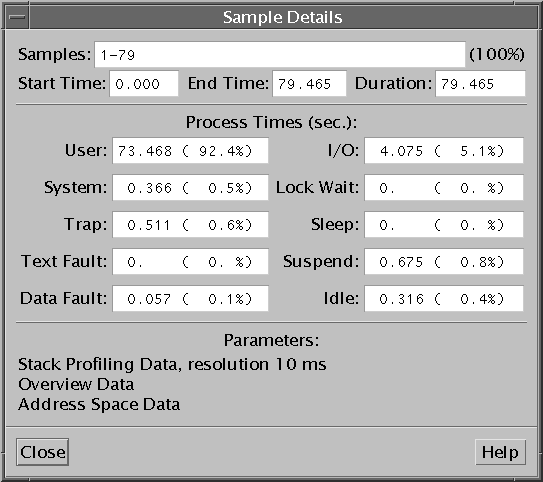
FIGURE 4-10 The Sample Details Window
- The Sample Details window appears, showing the following metrics:
- The ID of the sample or samples
- The percentage of the total samples selected
- The sampling start time, end time, and duration, in seconds
- A listing of process states and the time spent in each state, represented in seconds and in percentage of the total metric for all the samples selected:
- A parameter list showing the types of data that the Collector recorded in the experiment record file
Examining Address-Space Information
Note – Address-space information is available to the Analyzer only if address-space data was selected when the Collector generated the experiment record. Otherwise, the Analyzer reports that address-space data is not available.
To view the Address Space display:
- Choose Address Space from the Data option list.
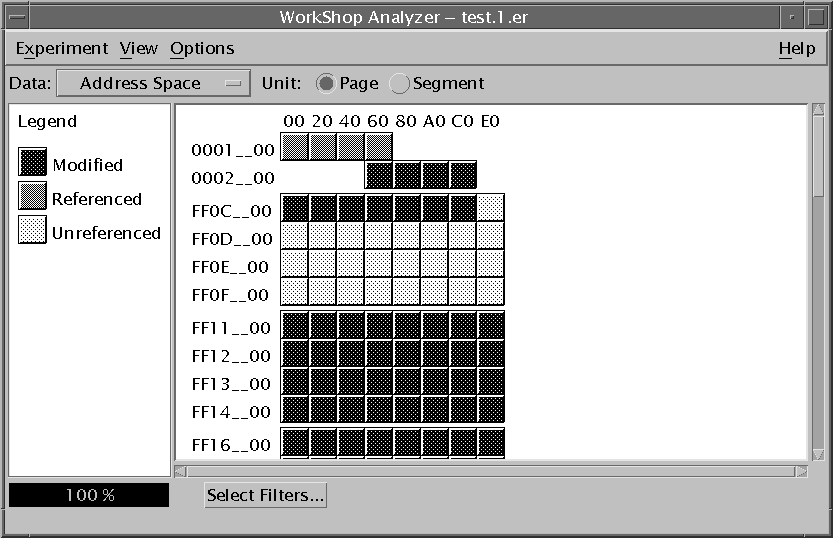
FIGURE 4-11 The Address Space DisplayThe Address Space display is divided into two display panes:
- The left display pane contains a legend for interpreting the graphical representation on the right.
- The right display pane shows a graphical representation of the program's address space.
The default display is by page (this display also appears if you click Page from the Unit radio buttons). Each square represents a page in the address space, and the fill pattern indicates how your program has affected the page:
- Modified it (written to it)
- Referenced it (read from it)
- Left it unreferenced
To see a display of the address-space segments:
- Click Segment from the Unit radio buttons in the upper tool bar.
The right display pane then shows an undifferentiated representation of the blocks of memory used by your program.
Viewing Detailed Information about Pages and Segments
To see detailed information about a page or segment:
1. Use the Unit radio buttons to select page display or segment display.2. Click the page or segment in the right Address Space display pane to select it.
- When a page or segment is selected, a drop shadow appears behind it in the right Address Space display pane.
3. Choose ViewShow Page Properties or View
Show Segment Properties from the main Analyzer menu.
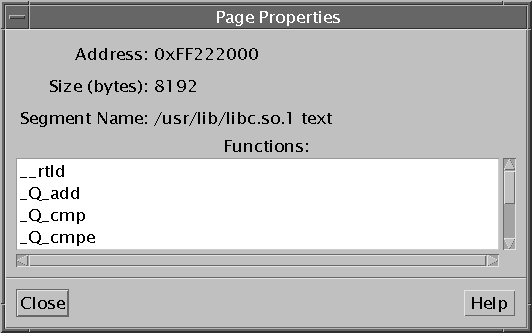
FIGURE 4-12 The Page Properties WindowThe Page Properties window or the Segment Properties window appears, showing the following information:
- Address of the page or segment
- Page or segment size in bytes
- Segment name, if known
- A list of functions, if any, stored on that page or segment
Examining Execution Statistics
To examine the Execution Statistics display:
- Choose Execution Statistics from the Data option list.
The Execution Statistics display lists various system statistics, summed over the selected sample or samples. (For information on how to select and group samples, see Selecting Samples, Threads, and LWPs.)
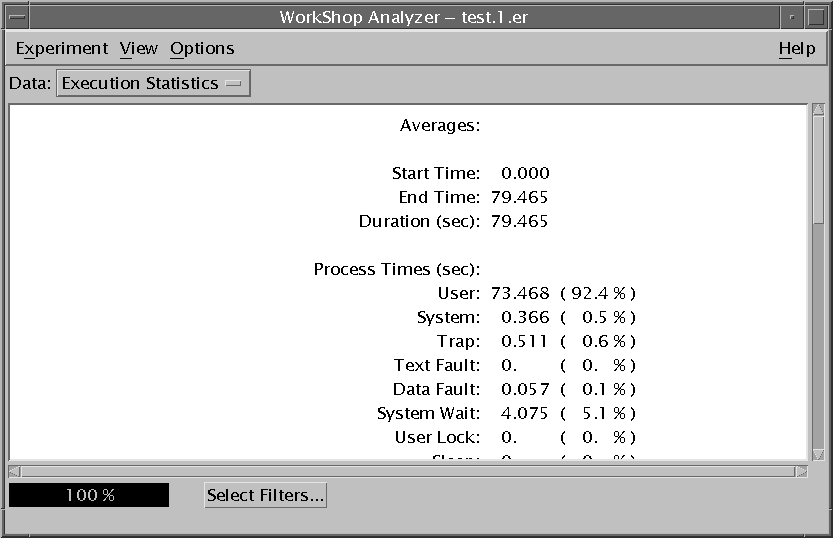
FIGURE 4-13 The Execution Statistics Display
Note – All data in the Execution Statistics window can be copied to the clipboard and pasted into any text editor.
Adding Experiments to the Analyzer
The Analyzer allows you to load multiple experiments. However, once you have loaded more than one experiment record into the Analyzer:
- The combined clock-based profiling, synchronization wait tracing, and hardware-counter overflow profiling data for all the experiments appear combined in the Function List display. Data for all samples from all experiment records are shown.
- Filtering by sample, thread, and LWP is disabled.
- Only the Function Display is available.
To add a new experiment record to any records already loaded into the Analyzer:
1. Choose ExperimentAdd from the Analyzer main menu to open the Add Experiment dialog box.
2. In the Add Experiment list box, double-click the experiment-record file you want to add, or type the name of the experiment-record file in the Name text box.3. Press Enter.
Note – The ExperimentAdd command is enabled only for the Function List display.
Dropping Experiments from the Analyzer
Note – Dropping an experiment removes it from the Analyzer, but has no effect on the experiment-record file. It is not possible to delete an experiment-record file from inside the Analyzer.
To drop an experiment record from the Analyzer:
1. Choose ExperimentDrop to open the Drop Experiment dialog box.
2. In the list box, click on the experiment record you want to drop from the Analyzer.3. Click either Apply to drop the experiment record and leave the dialog box open, or OK to drop the experiment record and close the dialog box.
Note – You can drop an experiment from the Analyzer only if more than one experiment is loaded. If only one experiment is loaded, the Drop command is disabled.
Printing the Display
To print a text representation of any of the Analyzer displays:
1. Choose ExperimentPrint from the main Analyzer menu to open the Print dialog box.
2. Use the Print To radio buttons to determine whether you are printing to a printer or a file:
- If you are printing to a printer, accept the default name in the Printer text box, or type in the name of a different printer.
- If you are printing to a file, type the name of the file in the File text box, or use the browse button to open the Print to a File dialog box, in which you can navigate to a directory or file.
3. Click the Print button.
Note – In the case of the Overview display, what prints is not a text representation of the graphical display, but a listing of statistics for each sample in the experiment.
|
Sun Microsystems, Inc. Copyright information. All rights reserved. Feedback |
Library | Contents | Previous | Next | Index |