Chapter 8
Monitoring the Server
Working with Log Files
Server log files record your server's activity. You can use these logs to monitor your server and to help you when troubleshooting. Theerror log file, located in compass-servername/logs in the server root directory, lists all the errors the server has encountered. The access log, located in compass-servername/logs in the server root directory, records information about requests to the server and the responses from the server. You can use the Server Manager to specify what to include in the access log file. Use the log analyzer to generate server statistics. You can back up server error and access log files by archiving them.
Viewing an Access Log File
You can view the server's active and archived access log files from the Server Manager. To view an access log:- Choose Server Status|View Access Log.
- Choose the access log file you want to see.
- Type the number of lines you want to see in the "Number of entries" field.
- To filter the access log entries for a particular word, type the word in the "Only show entries with" field.
Active log files for resources and archived log files appear in the list.
The order of the log entries on the screen is the order in which they were
recorded in the log.
Case is important; make sure the case for your entry matches the case of the
word you're searching for. (For example, if you want to see only those
access log entries that contain "POST," type
POST.)
wiley.a.com - - [16/Feb/1996:21:18:26 -0800] "GET / HTTP/1.0" 200 751Table 8.1 describes the last line of the sample access log.
wiley.a.com - - [17/Feb/1996:1:04:38 -0800] "GET /docs/grafx/icon.gif HTTP/1.0" 204 342
wiley.a.com - - [20/Feb/1996:4:36:53 -0800] "GET /help HTTP/1.0" 401 571
arrow.a.com - john [29/Mar/1996:4:36:53 -0800] "GET /help HTTP/1.0" 401 571
Table 8.1 The fields in the last line of the sample access log file
Here is an example of an access log using the flexible logging format:
wiley.a.com - - [25/Mar/1996:12:55:26 -0800] "GET /index.htm HTTP/1.0" "GET" "/?-" "HTTP/ 1.0" 304 0 - Mozilla/2.0 (WinNT; I)
The access log in the flexible logging format looks similar to the access log using the Common Logfile Format.
wiley.a.com - - [25/Mar/1996:12:55:26 -0800] "GET / HTTP/1.0" "GET" "/?-" "HTTP/1.0" 304 0 - Mozilla/2.0 (WinNT; I)
wiley.a.com - - [25/Mar/1996:12:55:26 -0800] "GET / HTTP/1.0" "GET" "/?-" "HTTP/1.0" 304 0 - Mozilla/2.0 (X11; I; IRIX 5.3 IP22) Viewing the Error Log File
The error log file contains errors the server has encountered since the log file was created; it also contains informational messages about the server, such as when the server was started. Incorrect user authentication is also recorded in the error log. Use the error log to find broken URL paths or missing files.
To view the error log file from the Server Manager:
- Choose Server Status|View Error Log.
- To see more or fewer than 25 lines of the error log, use the "Number of errors to view" field to enter the number of lines you'd like to see.
- To filter the error messages for a particular word, type the word in the "Only show entries with" field.
The order of the log entries on the screen is the order in which they were
recorded in the log.
Case is important; make sure the case for your entry matches the case of the
word you're searching for. (For example, if you want to see only those error
messages that contain "warning," type
warning.)
[13/Feb/1996:16:56:51] info: successful server startupIn this example, the first line is an informational message--the server started up successfully. The second log entry shows that the client
[20/Mar/1996 19:08:52] warning: for host wiley.a.com trying to GET /report.html, append-trailer reports: error opening /usr/ns-home/docs/report.html (No such file or directory)
[30/Mar/1996 15:05:43] security: for host arrow.a.com trying to GET /, basic-ncsa reports: user jane password did not match database /usr/ns-home/authdb/mktgdb
wiley.a.com requested the file report.html, but the file wasn't in the primary document directory on the server. The third log entry shows that the password entered for the user jane was incorrect.
Setting Log Preferences
During installation, an access log file namedaccess was created for the server. You can customize access logging for any resource by specifying whether to log accesses, what format to use for logging, and whether the server should spend time looking up the domain names of clients when they access a resource.
Server access logs can be in Common Logfile Format, or flexible log format, or your own customizable format. The Common Logfile Format is a commonly supported format that provides a fixed amount of information about the server. The flexible log format allows you to choose (from the Server Manager) what to log. A customizable format uses parameter blocks that you specify to control what gets logged. Once an access log for a resource has been created, you can't change its format unless you archive it or create a new access log file for the resource.
To set access logging preferences:
- From the Server Manager, choose Server Status|Log Preferences.
- Use the Resource Picker to choose the resource you'd like to apply custom logging to.
- Select whether to log client accesses.
- Type the full path for the log file.
- Choose whether to record domain names or IP addresses in the access log.
- Client hostname--The hostname (or IP address if DNS is disabled) of the client requesting access.
- Authenticate username--If authentication was necessary, you can have the authenticated username listed in the access log.
- System date--The date and time of the client request.
- Full request--The exact request the client made.
- Status--The status code the server returned to the client.
- Content length--The content length, in bytes, of the document sent to the client.
- HTTP header, "referer"--The referer specifies the page from which the client o accessed the current page. For example, if a user was looking at the results from a text search query, the referer would be the page from which the user accessed the text search engine. Referers allow the server to create a list of backtracked links.
- HTTP header, "user-agent"-- The user-agent information--which includes the type of browser the client is using, its version, and the operating system it's running on--comes from the User-agent field in the HTTP header information the client sends to the server.
- Method--The request method used.
- URI--Universal Resource Identifier. The location of a resource on the server. For example, for
http://www.a.com:8080/special/docs, the URI is/special/docs. - Query string of the URI--Anything after the question mark in a URI. For example, for
http://www.a.com:8080/special/docs?find_this, the query string of the URI isfind_this. - Protocol--The transport protocol and version used.
- If you don't want to log client access from certain hostnames or IP addresses, type them in the Hostnames and IP Addresses fields.
- Choose whether to include the format string in the logfile.
As a default, the log files are kept in the
logs directory in the server root
directory. If you specify a partial pathname, the server assumes the path is
the logs directory in the server root.
If you choose a custom format, type your custom format in the Custom format field. For more information about the parameters you should use, see Netscape's DevEdge online documentation web site at
http://developer.netscape.com/docs/manuals/
index.html
.
Type a wildcard pattern of hosts the server should ignore when recording
accesses. For example, use
*.netscape.com if you don't want to log
accesses from people whose domain is netscape.com. You can type
wildcard patterns for hostnames, IP addresses, or both.
If you are using the proxy server's log analyzer, you should include a
format string. If you are using a third-party analyzer, you may not want to
include a format string in your logfile.
Archiving Log Files
You can archive the access and error log files and have the server create new ones. When you archive log files, the server renames the current log files and then creates new log files with the original names. You can back up or archive (or delete) the old log files, which are saved as the original filename followed by the date and time the file was rotated. For example,access might become access.24Apr-04AM.
You can archive log files immediately or have the server archive log files at a specific time on specific days. The information about when to archive log files is stored in the cron.conf file in the admin-serv directory in the server root directory; the server's cron configuration options are stored in ns-cron.conf in the admin-serv directory.
Note
Before running the log analyzer, you should archive the server logs.
To archive log files:
- From the Server Manager, choose Server Status|Archive Log.
- Click Archive if you want to rotate the log files immediately.
If you want archiving to occur at specific times on specific days, click the
"Rotate log at" button, choose a time from the pull-down menu, and select
the days for archiving to occur.
Monitoring the Server Using HTTP
You can monitor your server's usage with the interactive server monitor. You can see how many requests your server is handling and how it is handling these requests. If the interactive server monitor reports that the server is handling a great deal of requests, you may need to adjust the server configuration or the system's network kernel to accommodate the requests. The interactive server monitor is shown in Figure 8.1.To monitor your server from the Server Manager:
- Choose Server Status|Monitor Current Activity.
- Click "Monitor current activity on port port_number". The interactive server monitor shown in Figure 8.1 appears.
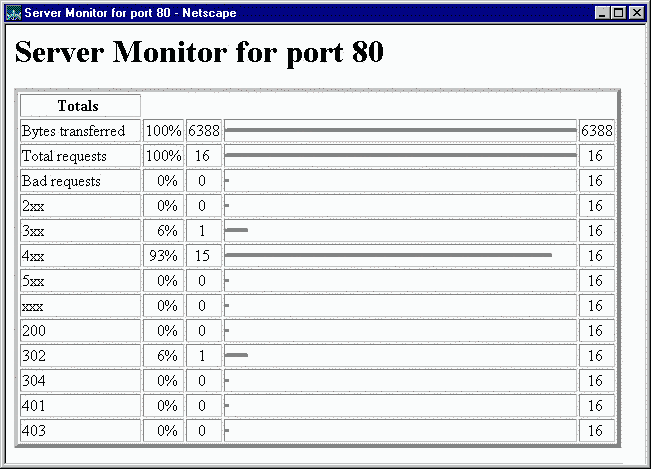 The interactive server monitor reports the totals for the following server values:
- Bytes transferred - the number of bytes the server is transferring
- Total requests - the number of requests the server is handling
- Bad requests - the number of bad requests the server is handling
- 2xx - the number of status codes ranging from 200 to 299 that the server is handling
- 3xx - the number of status codes ranging from 300 to 399 that the server is handling
- 4xx - the number of status codes ranging from 400 to 499 that the server is handling
- 5xx - the number of status codes of 500 and higher that the server is handling
- 200 - the number of successful transactions the server is processing
- 302 - the number of relocated URL status codes the server is processing
- 304 - the number of requests the server sends a local copy of a URL to
- 401 - the number of unauthorized requests the server is handling
- 403 - the number of forbidden URL status codes the server is handling
Working with the Log Analyzer
Use the log analyzer to generate statistics about your server, such as a summary of activity, most commonly accessed URLs, times during the day when the server is accessed most frequently, and so on. You can run the log analyzer from the Server Manager or the command line. Note Before running the log analyzer, you should archive the server logs. To run the log analyzer from the Server Manager:- Choose Server Status|Generate Report.
- Type the name of your server; this name appears in the generated report.
- Choose whether the report will appear in HTML or plain text format.
- Select the log file you want to analyze.
- Total hits--The total number of hits the server received since access logging was enabled.
- 304 (Not Modified) status codes--The number of times the requesting client used a local copy of the requested document, rather than retrieving it from the server.
- 302 (Redirects) status codes--The number of times the server redirected to a new URL because the original URL moved.
- 404 (Not Found) status codes--The number of times the server couldn't find the requested document or the server didn't serve the document because the client was not an authorized user.
- 500 (Server Error) status codes--The number of times a server-related error occurred.
- Total unique URLs--The number of unique URLs accessed since access logging was enabled.
- Total unique hosts--The number of unique client hosts who have accessed the server since access logging was enabled.
- Total kilobytes transferred--The number of kilobytes the server transferred since access logging was enabled.
- Select whether to generate general statistics. You can generate the following general statistics:
- Top number of one-second periods--You can generate the number of one second periods during which requests were highest.
- Top number of one-minute periods--You can generate the number of one-minute periods during which requests were highest.
- Top number of one-hour periods--You can generate the number of one-hour periods during which requests were highest.
- Top number of users--You can generate the top number of users that accessed your server, provided that you included this as an item to log when you enabled access logging.
- Top number of referers--You can generate the number of referers that appear in your log analysis, provided that you included this as an item to log when you enabled access logging.
- Top number of user agents--You can generate the number of user agents that appear in your log analysis, provided that you included this as an item to log when you enabled access logging.
- Top number of miscellaneous logged items--You can generate the number of miscellaneous logged items that appear in your log analysis, provided that you included this as an item to log when you enabled access logging. These miscellaneous items include the request method, the URI, and the URI query.
- Most commonly accessed URLs--You can have the log analyzer show the most commonly accessed URLs or URLs that were accessed more than a specified number of times.
- Hosts most often accessing your server--You can have the log analyzer show the hosts most often accessing your server or hosts that have accessed your server more than a specified number of times.
[Contents] [Previous] [Next] [Index]
Last Updated: 02/12/98 13:36:17
Any sample code included above is provided for your use on an "AS IS" basis, under the Netscape License Agreement - Terms of Use