| Chapter 4- |
|
CST Features and Functions |
This chapter describes the various features and functions of the CST console. It includes the following sections:
The console displays all categories of data collected by CST. You can, among other things, view and annotate events, compare configurations, enter custom information, compute statistics and print reports.
There are two ways to view a CST console depending on the CST components installed.

|
Note - CST 3.5 BETA release does not support operation within Sun Management Center. CST 3.5 General Availability release is expected to support this functionality. |
The difference between the two views is in viewing the hierarchy of the machines that are attached to the CST server.
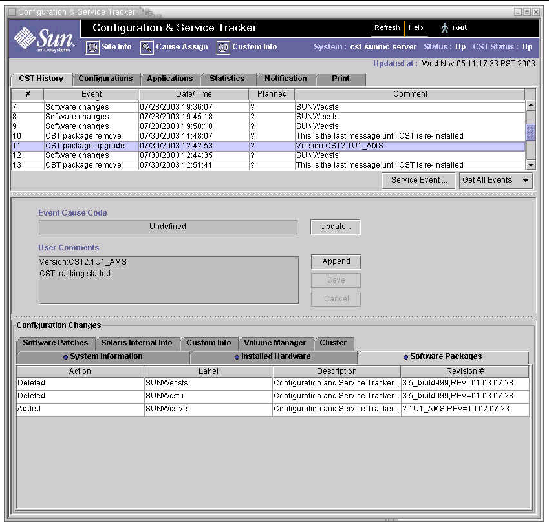
The screen is divided into three sections (or panels). The following table explains each section.
When a system is selected from the hierarchy panel (or the Sun Management Center main window), all the sections in the CST console display information about the selected system. The only exception is the Global Cause Code function, which is accessed by clicking on the CAUSE ASSIGN button in the summary section. This function displays the information about outage events for all systems tracked by this CST installation.
The system summary section is located at the top of the CST console. It displays information about the selected system.
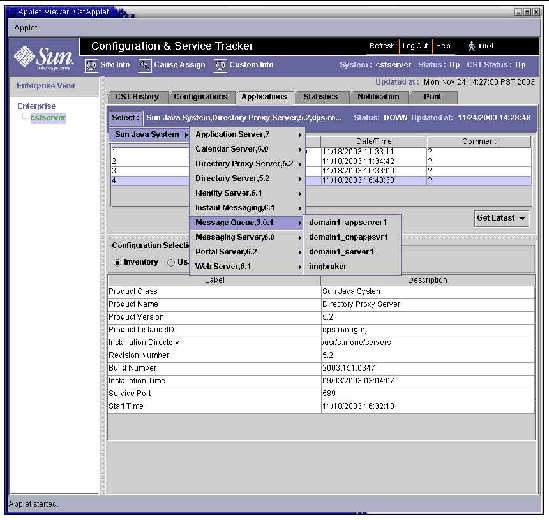
The following table describes the elements included in the top section of the screen, referred to as the summary section.
|
Button to update System View or Enterprise View information.
|
|
|
Button to enable the user to exit CST and close the session. |
|
|
Button to access information About CST plus details about installing and using CST. |
|
|
The login ID of the current user as entered in the Login screen for this session. |
|
|
This dialog box enables the entry of Customer Contact, Sun Contact, and Site Registration information. See Site Information for details. |
|
|
Button that opens the Global Cause Code Update dialog window which enables you to view all system failure or panic events for all systems tracked by the installed middleware and assign an event cause code, to each event individually or to multiple events. |
|
|
Button that opens the dialog window where you can enter system management information. Five categories of detailed information can be entered: Business Location, Asset Information, Service Information, System & Usage Information, and User Defined. |
|
|
The name, as entered by the customer during CST installation, of the selected system, highlighted in the hierarchical list. |
|
|
The status of the highlighted system as of the last refresh. The system can be either up or down. |
|
|
The status of the CST application on the selected system as of the time the selection was made. The application is either up or down. |
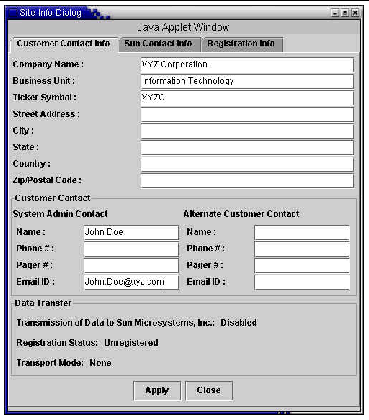
Clicking the SITE INFO button (located in the upper left corner of the screen) displays the Site Info Dialog window. The system administrator should use this form to enter site information that is pertinent to the entire site supported by this middleware.
 [ D ]
[ D ]
The dialog box (see FIGURE 4-4) includes three tabs:
A snapshot of each of these screens and an explanation of the fields is included in the following sections.
This dialog box includes fields where the customer system administrator can enter details on contacting Sun for support on the CST installation.
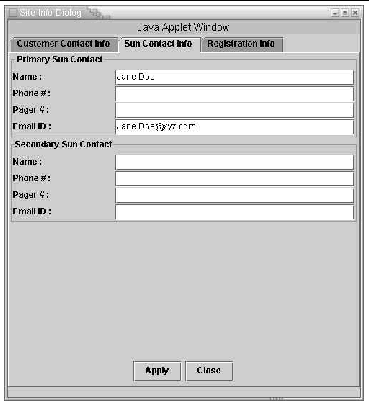
There are two buttons at the bottom of the screen, APPLY and CLOSE.
Completion of this section is required to register your site. See the Site Registration section in the CST Features and Functions chapter.
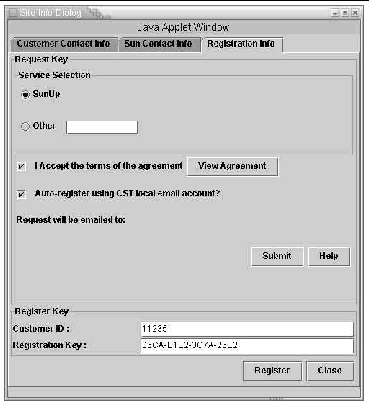
The two sections of this screen are:
Two buttons are the bottom of the screen: REGISTER and CLOSE.
|
Note - Completion of this section is required to register your site. See the CST Administration chapter, the Site Registration section. |
|
Note - The Data Transfer option at the bottom of the Admin dialog box only appears for customer sites which have registered using the Site Registration function. |
1. Click the SITE INFO button on the CST console.
2. Click the tab for the contact information to be completed, customer or Sun contact information.
3. Enter information about your company and contacts into the fields provided on the Customer Contact Info screen. Enter information about your Sun Contacts in the Sun Contact Info screen.
5. to close the screen without saving any entered information, click the CLOSE button.
Events tracked and reported by CST 3.5 can be defined by the customer by assigning a cause code to events. Assigning a cause code to an event adds value to the CST data and increases the usability of your CST reports. Assigning the highest level of cause code, you can track which events were planned and which were not and to which category each defined event is assigned. Details in your cause codes and your comments about the planned event (e.g., monthly maintenance of hardware or application upgrade installed requiring system reboot) add value. Details about unplanned outage (e.g., electrical outage in the greater metropolitan area lasting five minutes or database corruption requiring system down and backup restoration) are, perhaps, even more valuable. Reports with details result in significantly improved recognition of trends and possible remediation.
A cause code can be assigned to a single event, or a cause can be created and then assigned to multiple events.
|
Note - To define and assign a cause to a single event, go to the History folder and use the Event Cause Code function as defined in To Assign an Event Cause Code. |
Access the Cause Assign function to define and assign cause codes to multiple events.
If multiple outage system events are "Undefined," and there is a common cause behind those events, you can assign a Cause Code to multiple events at once.
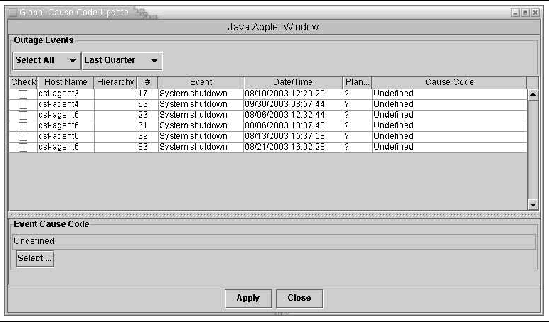
1. Click the CAUSE ASSIGN button, at the top right of the console. This displays all of the system outage events for all systems tracked by this middleware that occurred during the last 24 hours.
2. To change the time period of displayed events, click on the LAST 24 HOURS button to display the dropdown list of available time periods. Select the time period for which you want to view events.
3. Click on the events, in the Check column, to which you are assigning the same Event Cause Code. Or, you can select all displayed events by clicking on the SELECT ALL button.
4. Click the APPLY button. The Event Cause Code Dialog window displays.
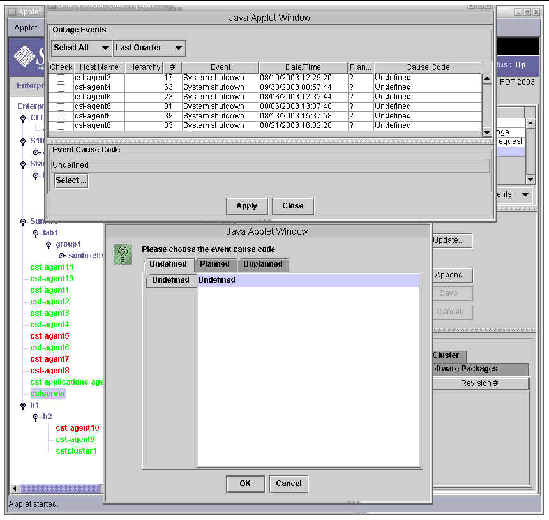
5. Click on the appropriate categories, PLANNED or UNPLANNED, then the specific cause to be assigned to the selected events.
|
Note - If the Global Cause Code dialog window is not visible, move the window, which is in front, up or to the side until the OK button is visible. |
6. Click OK to save the definition of the cause for the selected events.
The Summary Section of the CST 3.5 console includes a button, Custom Info, which allows you to record system management information in five categories. This information is not required by Sun. Recording this information can enhance the internal service level for your systems.
Click the Custom Info button to display the dialog window including five tabs available for your selection:
The system you have selected in the Hierarchy Panel, or in the Sun Management Center console, is the default system displayed in the Selected System field. You can select a different system by clicking on the arrow at the right of the Selected System field and clicking on the name of a different system. This functionality is available on all Custom Info windows.
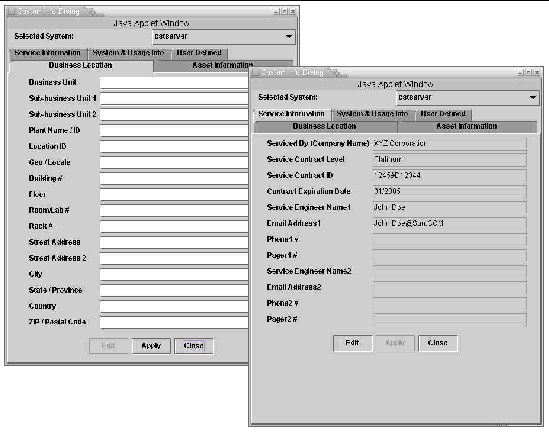
The fields in four of the tab windows are comprehensive based on input from many customers, and the User Defined tab allows you to define information not included in the other tab windows. If you have system management information that does not fit into defined fields, define your own fields and enter your information in the User Defined tab fields.
1. Click the User Defined tab.
2. Click the Label button at the bottom of the screen.
3. Click the Edit button at the bottom of the screen.
4. Type the name of the label for each of the fields you need.
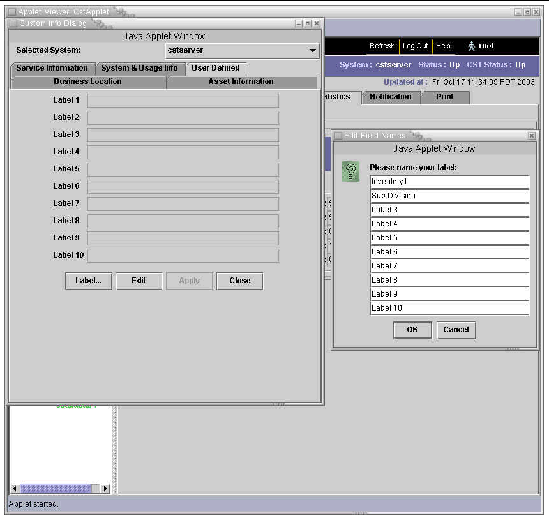
5. Click the OK button at the bottom of the screen. This saves the label names and returns you to the User Defined window.
6. Click the Edit button and type the information for each labeled field.
7. Click the Apply button to save the entered field contents.
8. See the Steps section, for details on entering data into the other tab windows.
All fields are initially grayed out to allow reading of all previously applied information. There are three buttons at the bottom of the screen:
1. Click on the tab where you want to enter or edit information.
2. Click on the Edit button to activate the write function on the displayed screen.
3. Enter system information into the applicable fields.
4. When all information has been entered, click the Apply button at the bottom of the screen to save.
5. To change to another tab window, click on that tab and repeat steps 2 through 4.
|
Note - Entered information, new or changes, is only saved when you click the Apply button on the displayed window. Any information not applied is discarded when the Cust Info function is closed. |
6. When you have completed entering information and applied all information to be saved, click Close. The Close function removes the Cust Info window and returns you to the screen where you were working before clicking on the Cust Info button.
The entered information applies to the system indicated at the top of the window in the Selected System field You can apply the entered information to one system at a time.
The name of the system selected in the Hierarchy Panel is the default system indicated in this window. Click on the tab where you want to enter information. Information displayed in each of the five areas is applied individually to the selected system when you click on the Apply button at the bottom of each tab window.
The Status Display Panel at the top of the screen displays:
The Hierarchy Panel displays the complete enterprise hierarchy view of the various systems tracked by this CST server. The hierarchical view is a graphical tree structure that can be expanded and collapsed by clicking on the desired system.
Include two screen shots to demonstrate the main CST graphical user interface (GUI) and the enterprise view, displayed on the hierarchy panel.
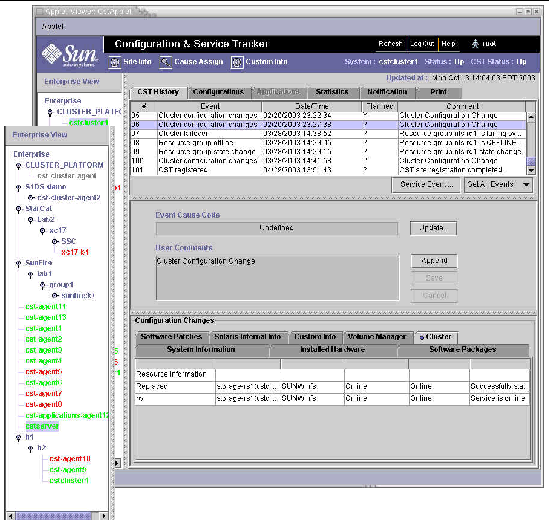
There are six system folders, also called tab folders. The tab folders display information about the selected agent system. The following sections describe the folders in detail.
The CST History folder displays present and past system information in its three sub-sections.

The events displayed when you first bring up the CST console are the latest events for the selected system. The GET LATEST drop-down dialog window on the right side below the list of events allows you to control which events are listed.
1. Click the GET LATEST button beliw the listed events to open the drop-down menu. The choices are: GET LATEST, GET PREVIOUS 10, and GET ALL EVENTS.
2. Click the GET ALL button to pull all events from the repository and display them.
|
Note - The Get All function can take a significant amount of time to complete, depending on the total number of stored events for the selected system. |
You can add value to an event that is listed with a question mark in the Planned field by assigning the Event Cause Code
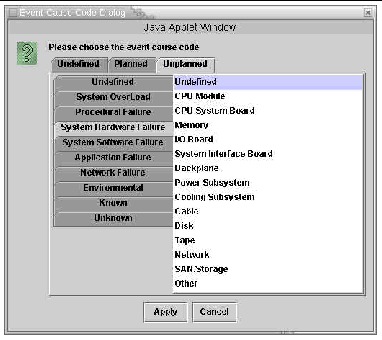
1. Assign an event cause code by clicking on the UPDATE button in the right side of the Event Cause Code section of the screen.
This brings up the Event Cause Code dialog box, where the reason can be assigned.
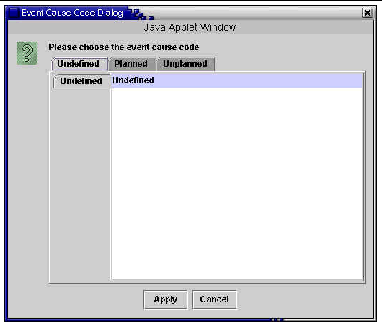
2. Choose from the Undefined, Planned, or Unplanned tabs on the top row.
Events can be marked as Planned if the system administrator had planned in advance and notified other users about the event to minimize event impact. This information can be useful for computing system availability statistics.
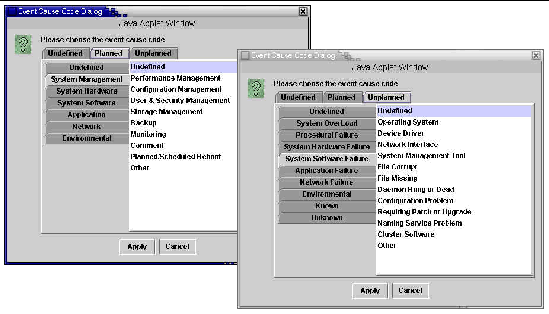
3. If you choose the Planned or Unplanned tab, select the appropriate category and cause for the event.
4. Select the specific cause from the second displayed menu.
If multiple outage system events are "Undefined," and there is a common cause behind those events, you can assign a Cause Code to multiple events at once.

1. Click the CAUSE ASSIGN button, at the top left of the console. This opens the Global Cause Code Dialog window.
2. Click the LAST 24 HOURS button and click on the period for which you want to display events for this function. The choices are: Last 24 Hours, This Week, Last Week, This Month, Last Month, This Quarter, Last Quarter, This Year.
3. aWhen you click your selection, the events, that occurred during the selected period for the selected system, display.
4. You can pick specific events from the displayed list by clicking on the events to which you are assigning the same Event Cause Code. Or, you can select all displayed events by clicking on the SELECT ALL button.
5. Click the SELECT button. The Event Cause Code Dialog window displays.
6. Click on the appropriate category, Planned or Unplanned, then the specific cause to be assigned to the selected events.
|
Note - If the Event Cause Code Dialog window is not visible, move the window, which is in front, up or to the side until the Apply button is visible. |
7. Click APPLY to apply the definition of the cause for the selected events. The list is refreshed with the assigned cause included with each event to which the cause was assigned.
8. Click CLOSE to close this dialog and return to the main CST screen.
1. Add comments to a specific event by clicking the APPEND button. The Comments window is activated, and you can type your comment.
2. Type the comment you wish to add to the event.
3. After completing the comment input, click the SAVE button. The comment displays in the Comment field of the event. The login ID of the session is appended to the comment.
|
Note - After selecting the APPEND button, click inside the User Comments window to enable writing. |
1. Select the History folder in the CST console.
2. Click the SERVICE EVENT button.
You can create a custom service event in the middle section of the History folder. Service engineers or system administrators use this button to capture any specific action or information about the system that might be useful for future reference.
4. Click the SAVE button to create a service event. The Event description will be User's Service.
The new event automatically displays in the event log.
|
Note - Service engineers should use this feature every time they service a system, as these events can provide a useful audit trail describing the actions taken on the system. |
1. Select the History folder in the CST console.
2. Select the event for which you want to see configuration changes.
3. Select a Configuration Changes folder at the bottom.
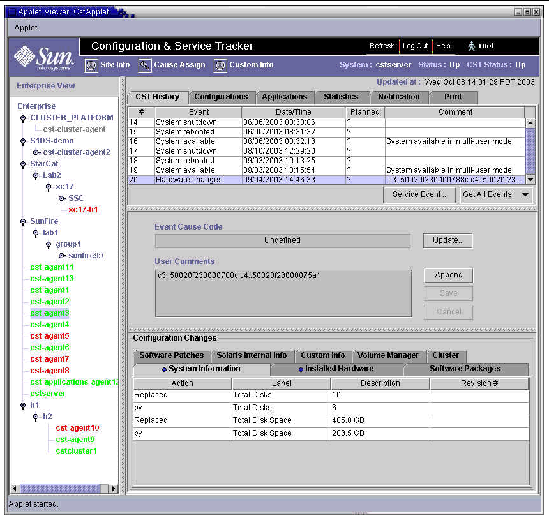
The bottom section of the History folder displays several smaller folders. These folders contain information about configuration changes that were detected at the time of the selected event. The folders match those of the configuration files: System Information, Installed Hardware, Software Packages, Software Patches, Solaris Internal Info, and Custom Info.
Folders which contain data are indicated by a bullet next to the folder name.
The content fields vary according to the folders, and their labels are indicated just above each data section. FIGURE 4-17 gives an example.
The Configurations Folder describes the past and present hardware and software configuration of the system. There are two selections to choose from: current and inception configuration.
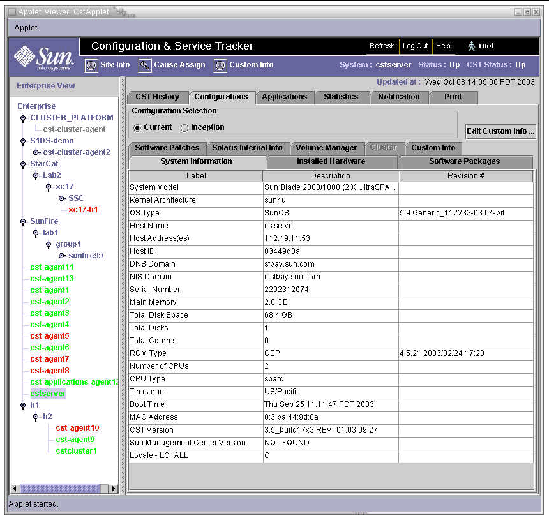
For either choice, there are several sub-folders that contain different categories of configuration information.
|
Displayed configurations can be those present at the time of inception of CST tracking on the selected system: Inception, or the current configurations on the selected system: Current. |
|
|
The machine-populated specifications on the selected system are displayed in this folder. For instance, ROM type and Host Name. |
|
|
All hardware detected by CST is listed with details in the following fields: Label, Description, Part #, Revision #, Serial #, Hierarchy, and Other. A blue dot in the Other field indicates there are other details about the installed hardware not included on this screen. |
|
|
All software packages detected by CST are listed with details in the following fields: Label, Description, and Revision #. The packages are listed in alphabetic order within the Label field. |
|
|
Each software patch installed on the selected system, from inception to the current time, is listed with details. |
|
|
All of the parameters available within your Solaris OS are listed with the assigned values. For instance, "Size of virtual address cache" is listed with its assigned value. |
|
|
For systems with volume manager installed, this folder displays the disk media, disk groups, volumes, plexes and sub-disks. |
|
|
For systems that are part of Sun clusters, this folder displays the cluster summary information, member status, resource list, resource type, resource group, resource, transport path, and quorum votes. |
|
|
Custom information includes system management data you enter by clicking the Cust Info button in the Summary Section. See Custom Info, for details. |
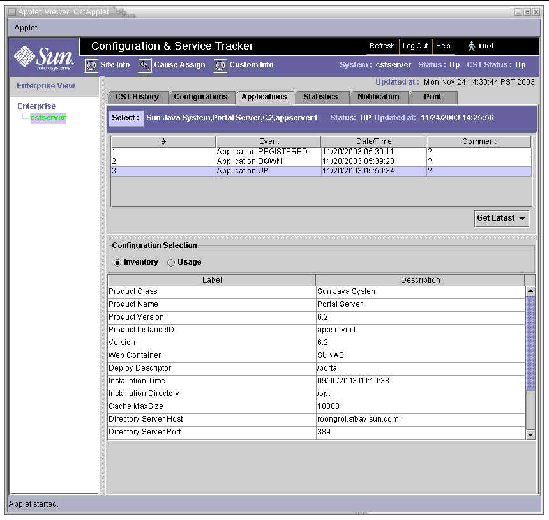
CST 3.5 includes this folder which allows you to view information tracked on supported applications. The Application Folder displays three sub-sections for the selected application.
|
Note - Not all inventory and usage information is available for all applications. |
CST 3.5 tracks Sun Java System applications and other classes of applications. Follow these steps to select the application to review.
1. Select the system name to be reviewed.
2. Click on the Application folder tab. The Application folder displays qualifying events for the tracked applications for the selected date range and selected system.
3. To select a different application, click the Select button located in the upper left section of the screen.
4. A series of dropdown menus allows you to drill down through four layers to select the exact application to be reviewed: Class of application, Name of application and its version number, and the application instance. Click on the instance.
5. .To view a different date range of data on the selected application, click the Get Latest button. Select from the three choices:
The statistics folder presents statistics for your review through its two components:
|
Displays statistics for the selected application on the currently selected system |
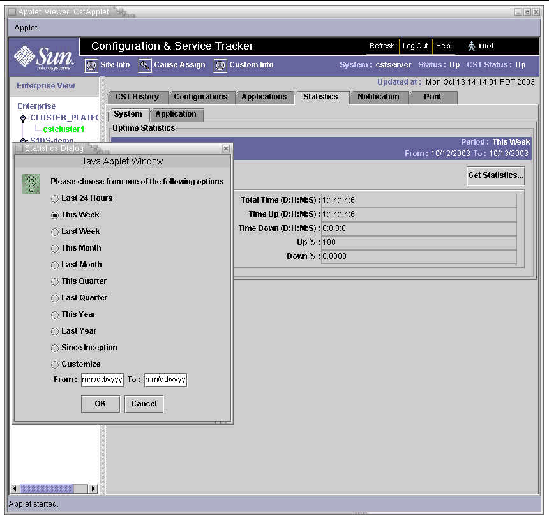
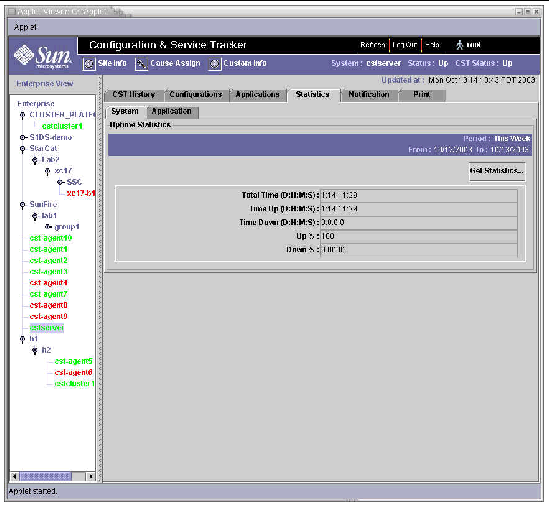
To view statistics on the currently selected system, follow these steps:
1. Select the system name from the Enterprise Hierarchy Panel.
2. Click on the Statistics folder tab.
4. The system statistics initially displayed are for This Week. Ths dates are displayed on the left side of the screen.
5. To select a different date range, click Get Statistics and select from the displayed list.
6. To view statistics for another system, repeat steps 1 through 5.

CST 3.5 tracks up and down events for supported software. To view the statistics for supported applications detected on the selected system, follow these steps.
1. Select the system name from the Enterprise Hierarchy Panel.
2. Click on the Statistics folder tab.
3. Click on the Application tab.
4. Click on the select button in the folder.
5. Choose the application for which you want to view statistics.
6. The system statistics initially displayed are for This Week. Ths dates are displayed on the left side of the screen.
7. To select a different date range, click Get Statistics and select from the displayed list.
The notification folder allows a system administrator to configure different user email addresses to receive email notifications on selected events:
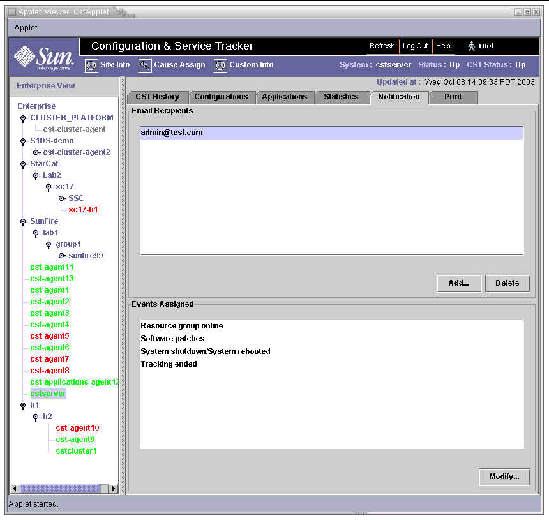
|
Note - If this folder is disabled, it means that either the agent CST is down or the agent CST is of a lower version and does not support this operation. |
This function includes a list of events in the categories:
You can select one or more events for which you want a notification email sent to one or more email addresses. Then, you enter the email address(es) where notification is to be sent.
Use this function to change the events and the email recipients.
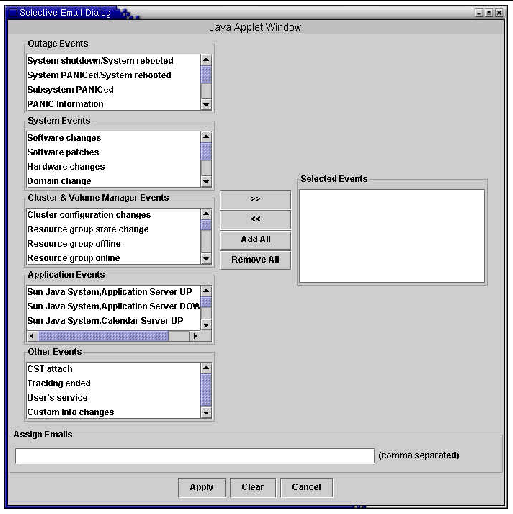
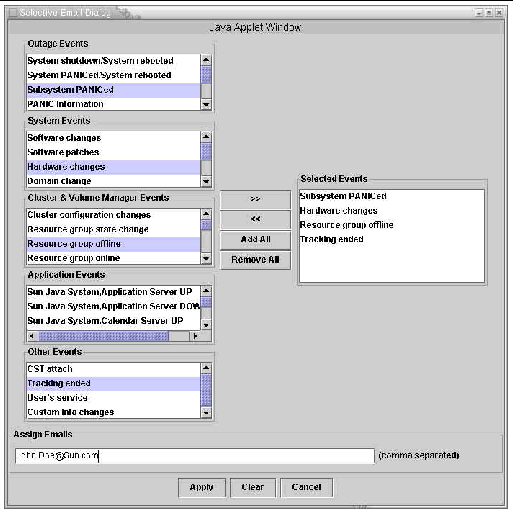
1. Click on the Add button. This opens the Selective Email dialog.
 [ D ]
[ D ]
2. Click on the events from the event list on the left-side of the dialog window. With one or more events selected, click on the ">>" button. This adds the selected event to the Selected Events list.
3. OR, to add all events to the Selected Events list, click the Add All button.
4. Enter an email address or a comma-delimited list of email addresses in the space provided.
5. Click the Apply button and the OK button in the resulting confirmation dialog. This creates an email to event-list mapping in the main Notification window.
6. OR, click the Close button or Cancel button to discard changes without saving any changes, and to close the window.
1. Select the email address for which the mapping is to be deleted.
2. Click on the Delete button and the ok button in the resulting confirmation dialog.
|
Note - Once the mapping is deleted, there is no way to recover the mapping other than to recreate and add it. |
Use this function to change events for which notification is sent to an already identified email address or addresses. See prior sections to modify the email addresses to which notifications are sent.
1. Select the email address for which the mapping is to be modified.
2. Click the MODIFY button. This starts a dialog that is similar to the one in the Add operation, but the email address is displayed in read-only mode. The administrator can edit only the associated event-list.
3. Modify the event list by adding or deleting events from the Selected Events list.
4. Click on the Apply button and the OK button in the resulting confirmation dialog.
The functions within the Print Folder include retrieving, printing, and sending simple reports based on the system event and configuration for the selected system. The reports are sent to the designated email address(es).
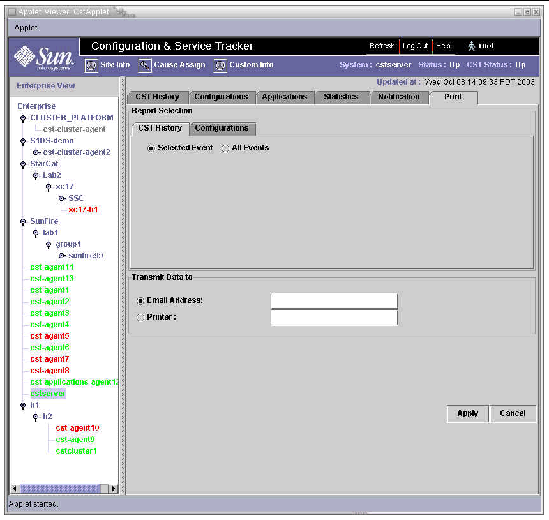
1. When you want a report on only one event, highlight that event in the main CST History folder.
3. Select the CST History folder within the Print folder.
4. Select either the Selected Event or All Events button (see FIGURE 4-26).
The event report is generated.
|
Note - The option to transmit data to Sun Microsystems displays only for customer sites which have registered using the Site Registration function. |
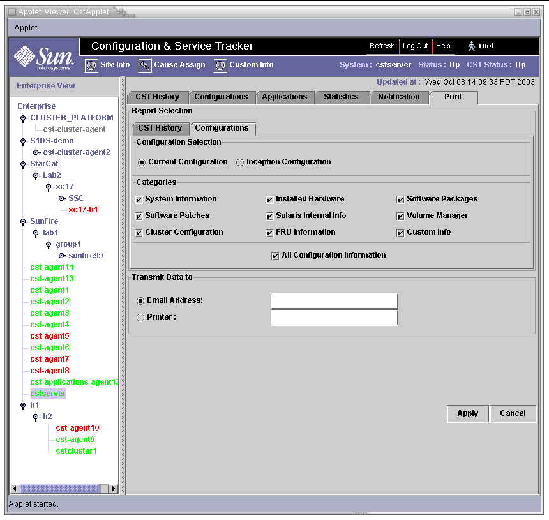
1. Select the Configurations folder within the Print folder.
2. Select either the Current Configuration or Inception Configuration button (see FIGURE 4-27).
3. Select one of the following categories:
Custom information can be generated by selecting the Custom Info button.
The configuration report is generated.
1. To send the report as an email message, select the Email Address button and type the desired email recipient.
2. To send the report to a printer, select the Printer button and type the printer name.
|
Note - In order to print a report, you must type the name of a printer that the middleware is configured to recognize. |
3. To send the report directly to Sun, select the Sun Microsystems, Inc. radio button.
4. To send the report to a printer or send it as email, after selecting the type of report, click the Apply button.
5. To clear and discard your entries, click the Cancel button.
Copyright © 2003, Sun Microsystems, Inc. All rights reserved.