| C H A P T E R 1 |
|
Introduction |
This chapter provides an introduction to the Sun Management Center 3.5 software in relation to the supported platforms.
The chapter contains the following sections:
Sun Management Center 3.5 is an open, extensible system monitoring and management solution that uses Java and a variant of the Simple Network Management Protocol (SNMP) to provide integrated and comprehensive enterprise-wide management of Sun products and their subsystem, component, and peripheral devices.
The Sun Management Center 3.5 Software User's Guide includes definitions, explanations and diagrams that clarify the Sun Management Center architecture. Review that document whenever you have questions about how consoles, servers, agents, domains and modules interact.
Support for hardware monitoring within the Sun Managament Center environment is achieved through the use of an appropriate hardware platform module, which presents hardware configuration and fault reporting information to the Sun Management Center management server and console.
This document relates to the Sun Management Center 3.5 Supplement for Sun Fire, Sun Blade and Netra Systems, which is a hardware platform module that currently supports the following platforms:
|
Note - This document will be updated to support additional Sun Fire Entry-Level Servers, NEBS-Certified Servers (that is, Netra Servers) and Sun Blade Workstations as they become available. |
The Sun Management Center graphical user interface (GUI) presents platforms as icons. For each monitored platform there is an icon representing the platform agent.
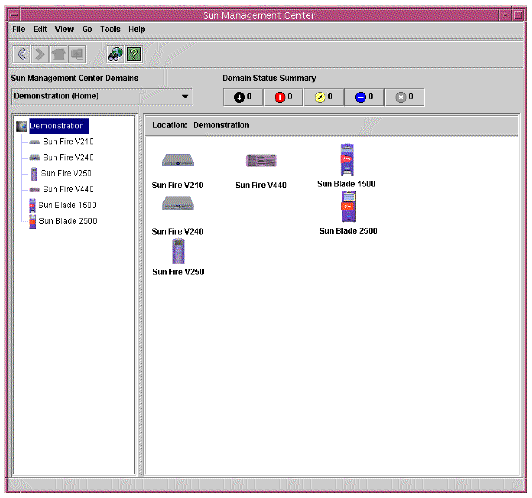
You can expand these icons to provide detailed views of the platform(s).
Sun Management Center 3.5 launches a detail viewer in which the hardware platform module is displayed, in addition to any other traditional Sun Management Center 3.5 monitoring and control modules.
The hardware platform module represents the monitored hardware, and presents the following views:
|
Note - A hardware platform module is also referred to as the Config Reader or platform add-on. |
The browser view displays information representing the platform hardware in the form of tables representing the various physical and logical components.
The browser view represents the hardware configuration in terms of three primary categories:
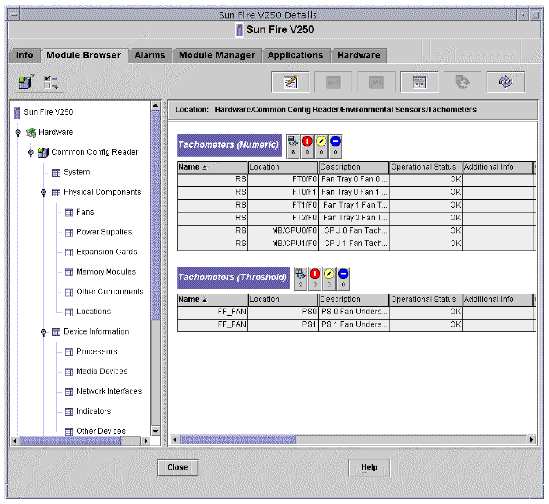
Physical components occupy physical space and include fans, power supply units, the chassis and so on. The browser view represents each physical component using a fundamental set of properties common to all physical components (for example, part number, serial number) with additional properties defined as appropriate.
Devices represent the logical devices comprising the platform. For example, a CPU module could contain one or more processing cores. Hence, in this case the CPU module would be represented by the browser as a physical component, but the processing cores would be represented by the browser view as separate devices.
The browser view represents each device using a fundamental set of properties common to all devices. Additional properties are defined to extend the common set as appropriate. For example, speed is an additional property defined for network interfaces.
The browser represents the various environmental sensors of the platform as a discrete category. Environmental sensors include those for voltage, current, temperature and fan speed. Two classes of sensor are supported:
Environmental Sensor Properties describes the various tables and columns in more detail.
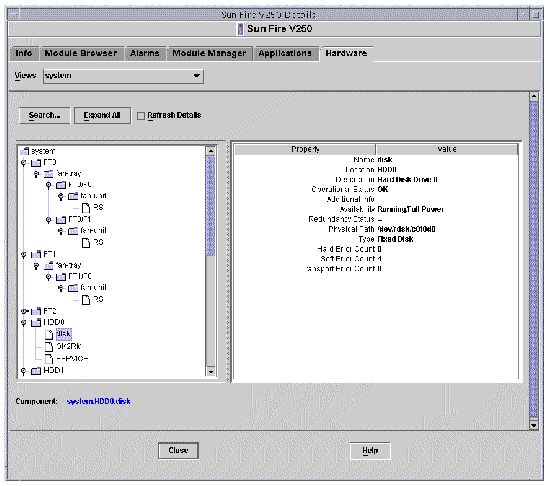
The logical view is a tree structure with each node in the tree corresponding to a single row in one table of the browser view. At the top of the tree is the system object. Using parent-child relationships to represent the physical containment hierarchy of the platform, the children of the system object are a set of locations, each containing one physical component. The children of the physical components are either further locations for the physical or logical devices that they realize, or the environmental sensors for monitoring them.
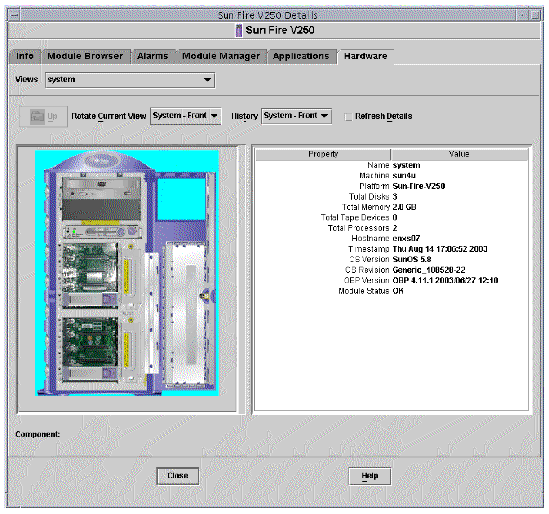
The physical view is represented by projections of the platform (for example, front, rear and top views). The projections enable you to select the individual physical or logical components modeled in the physical or logical components tables, and any LEDs that are visible. You can move the mouse over the physical image to display node information in a panel to the right of the physical image.
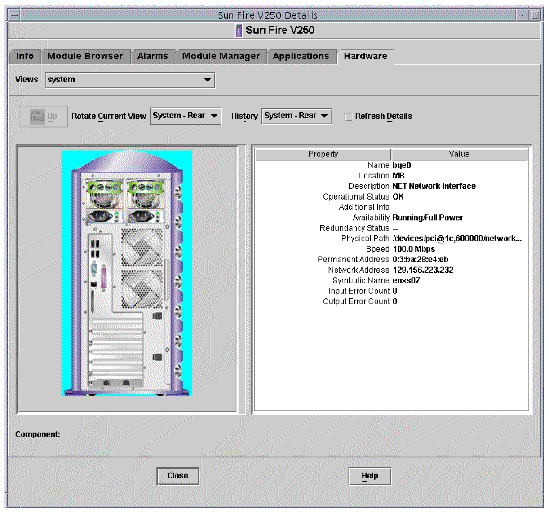
The hardware platform module includes a number of alarm rules that are used by the system to determine the status of the various components. Each alarm rule is applied to a specific property of a table in the hardware platform module. Chapter 4 describes the various alarms in more detail.
Copyright © 2004, Sun Microsystems, Inc. All rights reserved.