Test results can be viewed while a test is running and after the test is complete. By default, test results are generated once a day. For information on how system administrators can change this settings and others related to reports, see the Running the Report Generator Service section.
Follow these steps to view test results:
Select the name of the test from the View Tests window. The test opens.
Click the Results tab. The Results tab displays the latest test results.
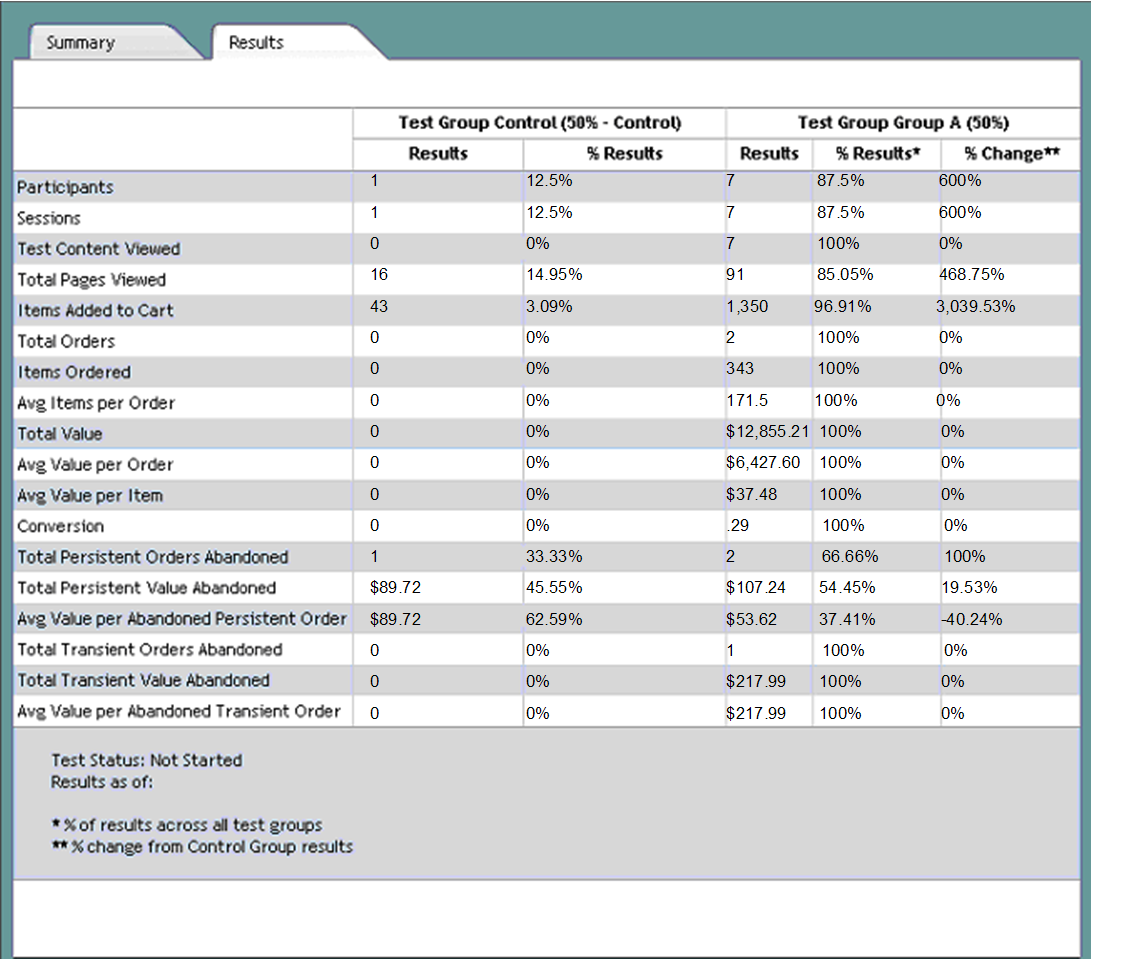
The data in the Results tab is listed by group. Each group listing contains the following columns:
The Results column displays the raw results of the test for the group.
The % Results column displays the percentage that the Results column for this group represents of the total results for all groups.
The % Change column displays the difference between the Control group results and a non-Control group’s results.
The following table describes the data returned in the rows of the Results tab.
Result | Description |
|---|---|
The number of users that were part of a test group while the test was running. If your sample group is small, this number might differ slightly from the percentages assigned to each group. | |
The number of separate sessions started by group members | |
The number of times group members viewed content that was part of the test. | |
The total number of pages viewed by group members during the test. |
ATG Campaign Optimizer for Commerce customers see the following rows as well:
Result | Description |
|---|---|
The number of items added to shopping carts by group members during the test. | |
The total number of orders placed by group members during the test. | |
The total number of items ordered by group members during the test. | |
The average number of items in each order placed by group members during the test. This number is calculated by dividing Items Ordered by Total orders. | |
The total value of all orders placed by group members during the test. | |
The average value of each order placed during the test by group members. This number is calculated by dividing Total Value by Total Orders. | |
The average value of each item placed during the test by group members. This number is calculated by dividing Total Value by Items Ordered. | |
The conversion rate for group members. This number is calculated by dividing the number of sessions in which an order was placed by group members by the total number of group member sessions. | |
The total number of orders that were abandoned by registered users. An order is considered abandoned if it is not placed within a specified time. | |
The total monetary value of all orders that were abandoned by registered users. An order is considered abandoned if it is not placed within a specified time. | |
The average monetary value of the items in abandoned, persistent orders. An abandoned persistent order is an order created by a registered user that isn’t placed within a specified time period. | |
The total number of orders that were abandoned by transient users. These orders were created by anonymous users (not logged in) and never placed. | |
The total monetary value of all orders that were abandoned by transient users. These orders were created by anonymous users (not logged in) and never placed. | |
The average monetary value of the items in abandoned, transient orders. An abandoned transient order is an order created by an anonymous user (not logged in) that is never placed. |
For more information about abandoned orders, see the Managing Abandoned Orders chapter of the ATG Commerce Programming Guide.
