 Accessing PS/nVision
This chapter discusses how to:
Access PS/nVision.
Create report instances and layouts.
Use Microsoft Excel features.
Accessing PS/nVision
You can access PS/nVision from the web or from Windows. You can use any of the following three navigation paths:
From the PeopleSoft Windows-based application (Application Designer): Select Go, nVision.
From Microsoft Windows: Select Start, Programs, PeopleSoft 8.x, nVision. Enter a database name, user ID, and password as you would to start any PeopleSoft application.
From the Web: Select Reporting Tools, PS/nVision.
If you are using Windows, PS/nVision automatically opens Microsoft Excel when it starts. The PS/nVision program itself appears minimized on the Windows taskbar. You can click the PS/nVision icon to open the PS/nVision window, but unless a specific PS/nVision dialog box is currently active in Excel, the PS/nVision window is blank.
Important! Don’t close this window—it will end your PS/nVision session, even though Excel is still running.
You initiate PS/nVision commands using the nVision menu in the Excel menu bar or—depending on your setup—by using a special spreadsheet file, NVSUSER.xls, which opens when you start PS/nVision. When you close Excel, PS/nVision closes automatically as well.
Note. Your Windows locale must support the signon language.
For PS/nVision to appear in the Microsoft Windows navigation path, select
the nVision option, located under the Configuration
Manager – Client Setup dialog box.
In PS/nVision for Microsoft Windows, you use the PeopleSoft Configuration
Manager to configure the locations of various PS/nVision files, such as layouts,
templates, and spreadsheets.
When you first access PS/nVision in Microsoft Windows, if an error message
indicates that PeopleSoft PeopleTools DSN is missing in ODBC data sources,
you need to run the psodbccrinst.exe to install the PS ODBC driver. If an
error message indicates that your client machine is not configured for nVision,
you need to click the Install Workstation option
on the Client Setup tab in the Configuration Manager to load important PS/nVision
DLL files to your machine's Windows registry.
See Also
Enterprise PeopleTools 8.51 Installation guide: Setting Up the Install Workstation, “Installing PeopleSoft ODBC Driver and Crystal Runtime.”
Creating Report Instances and Layouts
Each Excel spreadsheet created with PS/nVision is a report instance or a report layout. A report instance contains data that PS/nVision has retrieved from your PeopleSoft database. Every report instance is based on a report layout. PS/nVision uses the specified layout to determine the data to retrieve for the report and how to display it.
Note. Beginning from PeopleTools release 8.51, all PS/nVision layouts and all report instances (that are used to perform drilldown) must be in OpenXML (.xlsx) format. If you want to use existing layouts and reports that are in Excel 2003 (.xls) format, you must convert their format to .xlsx.
See Converting Existing Layouts and Reports to OpenXML Format.
Creating a PS/nVision report is a three-step process:
Define a report layout that specifies the ledgers, criteria, or queries to use for the report and how to format the report.
The report layout is an Excel spreadsheet that does not include actual PeopleSoft data; it defines the structure of the report—query information, criteria, text, formulas, graphics, formatting, or other information. After a layout has been saved, you can use it repeatedly to run reports.
Create a report request, specifying the layout and runtime options for the report.
Run the report request, using the nVision menu in Microsoft Excel, the Run button on the request dialog box, or a button/macro that calls PS/nVision to run the report.
As the report runs, a copy of the layout—an instance—is populated with data and is saved as a normal spreadsheet file. You can produce multiple instances of the report. For example, you might provide an inventory report for each location within your organization. Each instance is an individual report with current data from your database, selected and formatted according to the instructions in the report layout.
Note. If you are using a scope with your report, you can produce several instances from one layout with one report request.
Most PeopleSoft applications deliver predefined PS/nVision report layouts (such as Salaries by Department, Balance Sheet, Profit and Loss, and Operations Summary). Like any spreadsheet, a layout spreadsheet can be cloned and modified; you may rarely need to build one from scratch.
Besides the features that are available through PS/nVision, you can use Excel features to personalize layouts (and the resulting reports). For example, Excel includes dynamically linked charting and drawing tools for creating colorful graphs and diagrams. Because the layout is the basis for all reports produced from it, you can format and enhance the report once and get the benefits automatically each time the report is run.
Note. If you’re working with PeopleSoft Financials products, you may be interested in using ledgers with PS/nVision and taking advantage of the TimeSpan feature to define reports that roll from period to period without any changes to the layout. Using TimeSpans, you can have the same layout retrieve year-to-date data based on the as of date for which the report is requested.
See Also
Creating Ledger-Based Matrix Layouts
 Layout and Instance Example
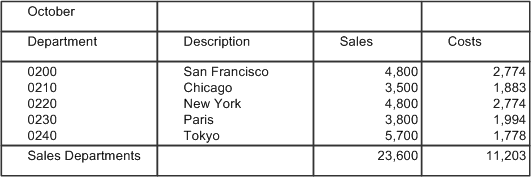
To help you visualize the relationship between a report layout and a report instance, this section includes a sample matrix layout with unique data selection criteria for individual rows and columns. Following the layout is an example of a report based on the layout. The Sales and Costs columns specify account numbers, and the rows specify department numbers. In the final report, each cell contains the data for the account number (column) and department number (row) that intersect at that cell.
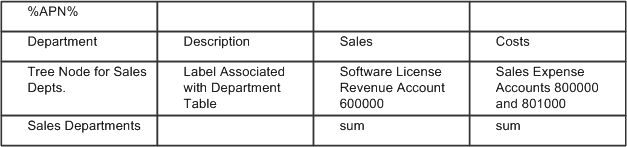
A Sample layout having the Department, Description, Sales, and Costs fields
A Sample layout having the Department, Description, Sales, and Costs fields
The sample layout contains several types of information:
Text
This refers to text that appears as-is in all report instances. In the sample above, the column headings—Department, Description, and so on—are standard text that remains the same in all reports created from the layout.
PS/nVision replaces variables with values when you run a report. The sample layout uses the %APN% variable for the time period reported on. When PS/nVision creates a report with this layout, it replaces the variable with the period covered by the report. If you use a scope to produce multiple instances of a report, you can use variables in the report heading so each reader knows what data the report contains.
PS/nVision examines the tree structure and determines where to obtain the appropriate label for either a tree node or a detail value. In the example, PS/nVision relates a sales department description to the department table entry for each department corresponding to the Sales Depts tree node.
Selection criteria specify the data to retrieve from your PeopleSoft database. For example, the Sales column in the sample layout has criteria that direct PS/nVision to retrieve data from the Sales account.
These formulas perform calculations on the report data. In the example, the bottom row automatically displays totals of the Sales and Costs columns. You could add a calculated column, Gross Income, calculated via an Excel formula that subtracted Costs from Sales.
Formatting information includes attributes such as font size, underlining, column width, print options, and so on. You design your layouts using familiar Excel methods; any formatting and enhancements you place in the layout appear in all reports created from it.
Using Microsoft Excel Features
In addition to the PS/nVision functionality for retrieving data from your PeopleSoft database, you still have all of Microsoft Excel's features at your disposal. This section describes how to:
Insert formulas
Insert and format text
Inserting Formulas
Formulas enable you to perform calculations such as adding column or row data, computing variances, calculating ratios, and so forth. You can use cell references such as =C2+C3, name references such as =Revenue-Expenses, or worksheet functions (see the Excel documentation or online help for a list of commands). All formulas begin with an equal sign (=). You can use a number of formula operators for calculations. The following table lists the most common operators.
|
Symbol |
Description |
Purpose |
|
+ |
Plus sign |
Addition |
|
− |
Minus sign |
Subtraction |
|
* |
Asterisk |
Multiplication |
|
/ |
Slash |
Division |
|
: |
Colon |
Range |
|
|
Space |
Intersection |
|
, |
Comma |
Union |
|
− |
Hyphen |
Negation |
|
% |
Percent sign |
Percent |
|
& |
Ampersand |
Text concatenation operator |
To enter a formula, click in the worksheet cell where you want the formula or text to appear, and begin typing. As you type, your cursor appears in the Excel formula bar (the rectangular box just below the menu bar, above the worksheet). The Cancel and Enter buttons appear to the left of the cursor.
Inserting and Formatting Text
Text is used mainly for column and row headings, captions, and callouts. Excel has a number of formatting features to enhance the appearance of text in your worksheet.
Formatting is also straightforward, provided that you know where to look for the commands. To resize columns and rows in Excel, either highlight the row or column and drag its border, or select Format, Column, Width or Format, Row, Height. You can also select Column Width, Best Fit to automatically set the width for headings. Do not select Best Fit until you have typed the longest line in the column.
To wrap column headings within a cell, select Format, Cells and then select the Wrap Text on the Alignment tab.
Note. You can use conventional Excel commands for additional formatting.
See Also
Microsoft Excel User’s Guide.