25 Understand Special Arithmetic Operands
This chapter contains the topic:
25.1 About Special Arithmetic Operands
You use special arithmetic operands to minimize the number of calculations on your report. Special arithmetic operands for column, row, and cell calculations include:
-
A (Average)
-
< (Store smaller number)
-
> (Store larger number)
-
Z (Store last non-zero number)
To understand special arithmetic operands, you must understand the following concepts:
-
Averaging
-
High/low
-
Zero
25.1.1 About Averaging
You can calculate the average of consecutive columns, rows, or cells.
For example, if you want column 7 to show the average of the amounts in columns 1 through 6, you use the A operand and enter the following:
Figure 25-1 Averaging Columns Using A Operand

Description of "Figure 25-1 Averaging Columns Using A Operand"
This gives the same result as the following column definition:
Figure 25-2 Averaging Columns with a Different Method

Description of "Figure 25-2 Averaging Columns with a Different Method"
When you use the A operand in cell calculations, all cells must be in the same row or in the same column.
For example, R2C2 A R5C2 calculates the average of the consecutive cells included in column 2, as follows:
R3C1 A R3C4 calculates the average of the consecutive cells included in row 3, as follows:
25.1.2 About High/Low
If you implement the greater than symbol (>), the system stores the highest number found in that column, row, or cell. If you implement the less than symbol (<), the system stores the lowest number in that column, row, or cell. The columns, rows, or cells do not need to be consecutive.
For example, if you want column 5 to contain the smallest number found in columns 1, 2, and 4, enter it as follows:
FASTR compares the amount in column 1 with the amount in column 2 and selects the smaller number. It then compares the smaller of these numbers with the amount in column 4 and prints the smaller number in column 5.
The following example illustrates this.
When using the < and > operands, be careful with credit amounts. Even though 100.00 - is a higher credit amount than 50.00 -, it is a smaller number.
In the following example, column 4 contains the largest number found in columns 1, 2, and 3 (C1 > C2 > C3). The first two rows show revenues (credit amounts), and the last two rows show expenses (debit amounts).
This example illustrates that the largest number for a debit account is the highest amount for that account. However, the largest number for a credit account is not the highest amount for the credit account. The smallest number for a credit account is the highest amount. Therefore, to find the highest amount for a debit account, you use the > operand, but to find the highest amount for a credit account, you use the < operand.
The following illustrates how the system locates the absolute value of a column using the greater than ( > ) operator.
| Column 1 Account Range (AR) | Column 2 C01*-1 (C) | Column 3 C01>C02 (C) |
|---|---|---|
| 75- | 75 | 75 |
| 100 | 100- | 100 |
| 50 | 50- | 50 |
| 25- | 25 | 25 |
| 60- | 60 | 60 |
25.1.3 About Zero
You can store the last non-zero number to avoid unrealistic results when you have division calculations that use zero as a divisor.
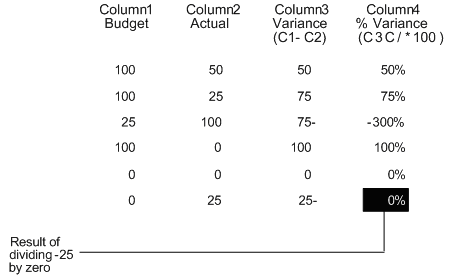
For example, assume the columns in the following example are from a budget variance report. Column 1 shows budget amounts. Column 2 shows actual amounts. Column 3 shows how much budget varies from actual. Column 4 shows by what percent budget varies from actual.
Figure 25-8 Budget Variance Report Example

Description of "Figure 25-8 Budget Variance Report Example"
All rows in column 4 show realistic percentages except the last row. The last row shows 0% variance even though the budget amount is zero and the actual amount is 25. This is because FASTR divides the amount in column 3, which is 25, by zero, the amount in column 1. FASTR always gives zero as the result of dividing a number by zero, even though you cannot divide by zero.
The Z operand provides a solution to this problem. The Z operand stores the last non-zero number found in a pair of columns. If no non-zero numbers are found, the system stores zero. In the previous example, you can define a non-printing column that stores the last non-zero number found when reading column 2 and then column 1, as follows:
The non-printing column is used as the divisor for the percent variance calculation. The following example shows the results. Column 3 is the non-printing column and the last column calculates percent variance using column 3 as the divisor.
Figure 25-10 Results of Non-Printing Column Calculation

Description of "Figure 25-10 Results of Non-Printing Column Calculation"
The percent variance for all rows is the same as in the first example, except for the last row. Because column 3 stored 25 as the last nonzero number in that row, 25 became the divisor in the percent variance calculation, not 0. The result is -100% instead of zero for the percent variance in that row.


