27 Print Analysis Reports
This chapter contains these topics:
You can compare and compute variances and ratios that reflect your company's financial activity.
27.1 Printing Variance Analysis Reports
From General Accounting (G09), choose Financial Reports
From Financial Reports (G10), choose Variance Analysis or Variance Analysis with Five Months
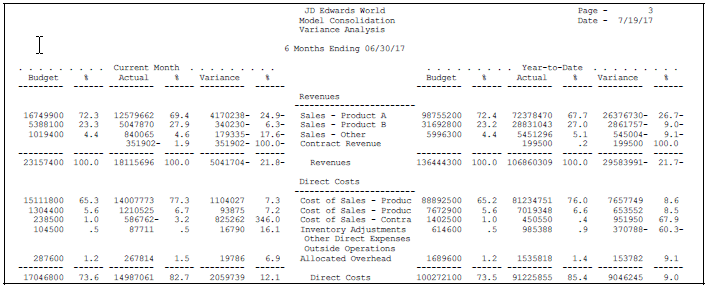
To compare actual to budget amounts and compute current period and year-to-date variances, use the variance analysis reports. Two formats are available:
-
Variance Analysis
-
Variance Analysis with Five Months Actual
If you set up Enhanced Subledger Accounting, you can set the Enhanced Subledger Selections processing option to view these balances on the report. See Chapter 63, "Work with Enhanced Subledger Accounting" for more information.
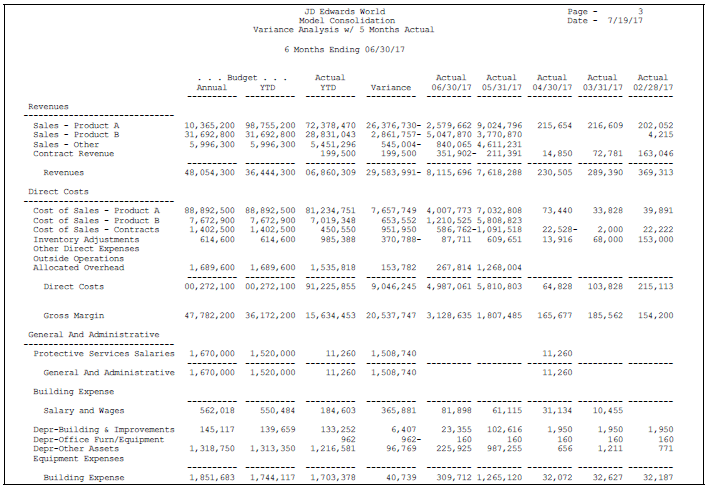
27.1.2 Variance Analysis with Five Months Actual
Figure 27-2 Variance Analysis with 5 Months Actual report

Description of "Figure 27-2 Variance Analysis with 5 Months Actual report"
27.1.3 Processing Options
See Section 84.21, "Variance Analysis (P10212)."
See Section 84.22, "Variance Analysis with 5 Months (P10411)."
27.2 Printing Financial Ratios Reports
From General Accounting (G09), choose Financial Reports
From Financial Reports (G10), choose Financial Ratios
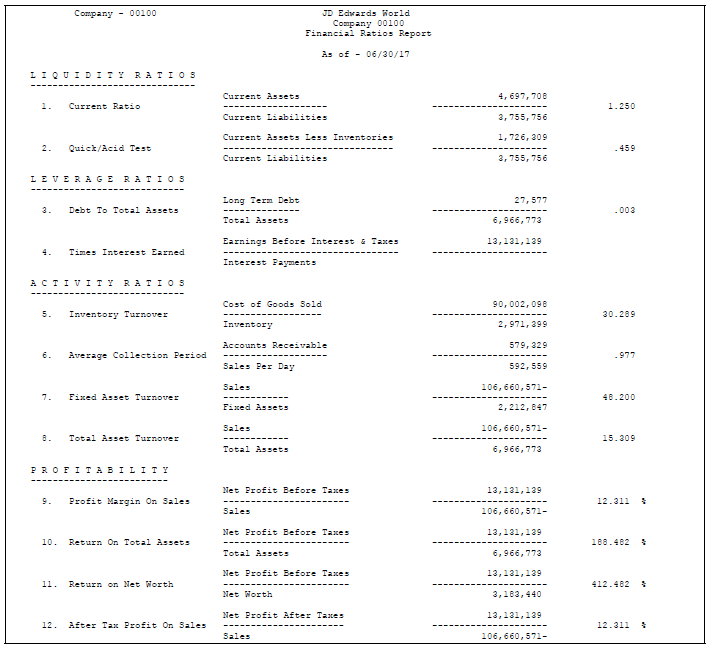
To analyze financial information, such as debt to total assets, inventory turnover, and profit margin on sales, use the Financial Ratios report. This report includes the following standard ratios:
-
Liquidity
-
Leverage
-
Activity
-
Profitability
You can print this report as a consolidated ratio analysis across all companies or on a company-by-company basis. Use data sequencing to do so.
If you set up Enhanced Subledger Accounting, you can set the Enhanced Subledger Selections processing option to view these balances on the report. See Chapter 63, "Work with Enhanced Subledger Accounting" for more information.
If you leave the Fiscal Period/Year processing option blank, the system uses the financial reporting date for each company if company or business unit is the first data sequence item. Otherwise, it uses the financial reporting date for company 00000.
27.2.1 How Do AAIs Affect Financial Ratios?
The Financial Ratios report uses the account ranges that are set up in AAI items F01 through F20. The accounts within these ranges are accumulated balances.
To calculate ratios based on other AAIs, you need to define a custom financial ratios report using the FASTR report writer.
The following examples show how the system calculates different types of financial ratios:
27.2.1.1 Liquidity Ratios
| Ratio | Calculation |
|---|---|
| Current Ratio | Current Assets (F01 through F06) / Current Liabilities (F08 through F09) |
| Quick/Acid Test | Current Assets less Inventories (F01 through F06) - (F04 through F05) / Current Liabilities (F08 through F09) |
27.2.1.2 Leverage Ratios
| Ratio | Calculation |
|---|---|
| Debt to Total Assets | Long Term Debt (F10 through F11) / Total Assets (F01 through F08) |
| Times Interest Earned | Earnings before Interest and Taxes (Net Income - (F19 through F20) - (F17 through F18)) / Interest Payments (F17 through F18) |
27.2.1.3 Activity Ratios
| Ratio | Calculation |
|---|---|
| Inventory Turnover | Cost of Goods Sold (F15 through F16) / Inventory (F04 through F05) |
| Average Collection Period | Accounts Receivable (F02 through F03) / Sales per Day (F13 through F14) / (fiscal period x 30) |
| Fixed Asset Turnover | Sales (F13 through F14) / Fixed Assets (F06 through F07) |
| Total Asset Turnover | Sales (F13 through F14) / Total Assets (F01 through F08) |
27.2.1.4 Profitability
| Ratio | Calculation |
|---|---|
| Profit Margin on Sales | Net Profit before Taxes (net income) - (F19 through F20) / Sales (F13 through F14) |
| Return on Total Assets | Net Profit before Taxes (net income) - (F19 through F20) / Total Assets (F01 through F08) |
| Return on Net Worth | Net Profit before Taxes (net income) - (F19 through F20) / Net Worth (F01 through F12) |
| After Tax Profit on Sales | Net Profit after Taxes (net income) / Sales (F13 through F14) |
27.2.3 Data Sequence for Financial Ratios
Depending on the type of ratio report you want to print, sequence by one of the following:
-
Object account and subsidiary for a total consolidated ratio report
-
Company, object account, and subsidiary for an individual ratio computation by company report
If region is a reporting function that provides a full range of accounts for meaningful ratios, use this business unit category code in your data sequence.

