Patch Reporting Utilities
Applied Patches
With the Applied Patches reporting tool, you can view information about the patches applied to your system. This patch history includes information such as:
-
Patch number
-
Driver file name
-
Platform
-
APPL_TOP on which the patch was applied
-
Contents and language of the patch
-
Files changed or copied
-
Bug fixes included in each driver file
-
Whether the fix was applied successfully, or reason it was not applied
-
Timing information (start time, end time, elapsed time during application, restart time)
How Patch Information Is Stored
The adop utility stores patch information in the database automatically each time it successfully applies a patch. However, if the patch is not applied successfully, or when you run adop in pre-install mode, patch history is not written directly to the database, but instead is written to these patch information files:
-
javaupdates<YYYYMMDDhhmiss>.txt, which contains information about changes to Java files
-
adpsv<YYYYMMDDhhmiss>.txt, which contains information about changes to all files except Java files
Note: In the file name, hh is in 24-hour format.
Both files are located in the <APPL_TOP>/admin/<SID> directory. Each time you run adop, it checks this directory for the existence of the patch information files. If it finds them, it automatically uploads the information they contain to the patch history database. If the upload is successful, adop then deletes the files from the directory. The adop log file records whether the upload was successful or unsuccessful.
Patching Modes
The way you run adop affects the way it stores patch history information. When you apply a patch in test mode (using apply=no on the command line), adop does not write to the patch information files, and it does not upload patch history information to the database. When you apply a patch in pre-install mode (using preinstall=y on the command line), adop writes patch history information to the patch information files, and it uploads the contents of these files to the database the next time it runs. See: adop Modes.
The Applied Patches Interface
The Applied Patches reporting tool is a Web-based utility in Oracle Applications Manager. The Simple Search page serves as a home page.
Simple Search page
From this page, you can perform a simple search or access the Advanced Search page. You can use either of these pages to query the database for applied patches (the default) or to see a history of changed files. The results of either type of query appear at the bottom of the search page.
Patch Details page
In the search results for both applied patches or file history, there is a Details column. Clicking any link in this column accesses the Patch Details page. From this page, you can go to the Timing Details page, the Files Copied page, the Bug Fixes page, or the Action Summary page.
Note: The discussion of each page contains more detail. The OAM help feature also contains information about the Applied Patches utility.
Accessing Applied Patches Information
To query the patch history database for information about patches applied to your system and the files affected, log in to Oracle Applications Manager and choose Applied Patches from the Site Map.
Step 1: Log in to Oracle Applications Manager
Follow the instructions in Accessing Patch Wizard to access OAM. From the Applications Dashboard, click the Site Map tab.
Step 2: Go the Simple Search page
From the Site Map, Applied Patches is on the Maintenance tab under the Patching and Utilities heading. Click the Applied Patches link to go to the Simple Search page.
Step 3: Select search criteria
From the Simple Search page, you can perform a query for applied patches or file history. Or, you can go to the Advanced Search page to perform a more detailed search.
Note: See detailed descriptions of individual pages in this chapter. See also Analyzing Applied Patches.
Applied Patches Search Pages
This section describes queries for applied patches.
Simple Search
You can perform a Simple Search from this page by entering the required information in the input fields.
Applied Patches Page - Simple Search
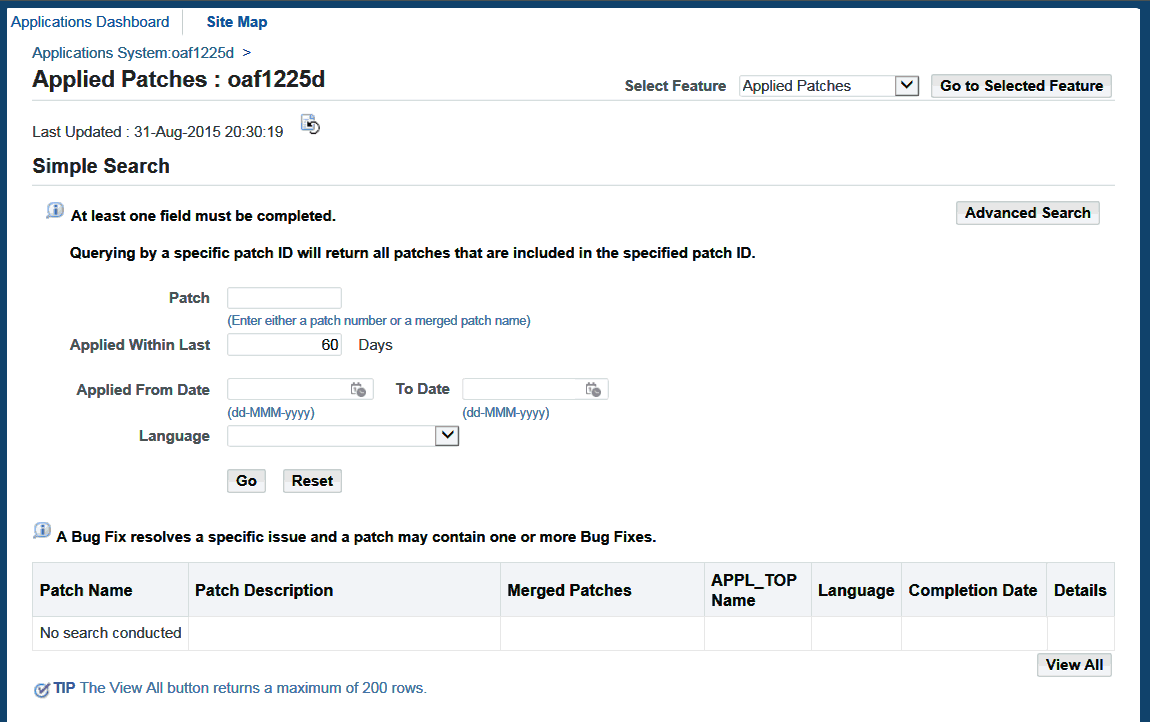
There are four fields in the Simple Search section:
-
Patch: Enter the patch number in this field.
-
Applied Within Last <number> Days: This field allows you to restrict the search to a specific timeframe. The default is 60 days.
-
Applied From Date <begin date> To Date <end date>: This field allows you to search for patches that were applied during a specified period of time. Click the calendar icon to select the date or enter the date directly in the field. Some examples for the use of this field are:
-
Enter only the begin date. This search returns all patches applied from the begin date through today's date.
-
Enter only the end date. This search returns all patches applied up to the end date.
-
Enter the begin date and the end date. This search returns all patches applied between the begin date and the end date.
-
-
Language: This drop-down list allows you to select the language of a patch to be queried. You can select only one language in this field. To select multiple languages, go to the Applied Patches Advanced Search page.
You must enter a value in at least one of the fields. If you do not, an error page reminds you to go back and enter a value. To submit the query, click the Go button. The Reset button clears the entered search criteria.
Advanced Search
Click the Advanced Search button to see the Applied Patches Advanced Search page, then enter the search criteria information.
Applied Patches Page - Advanced Search
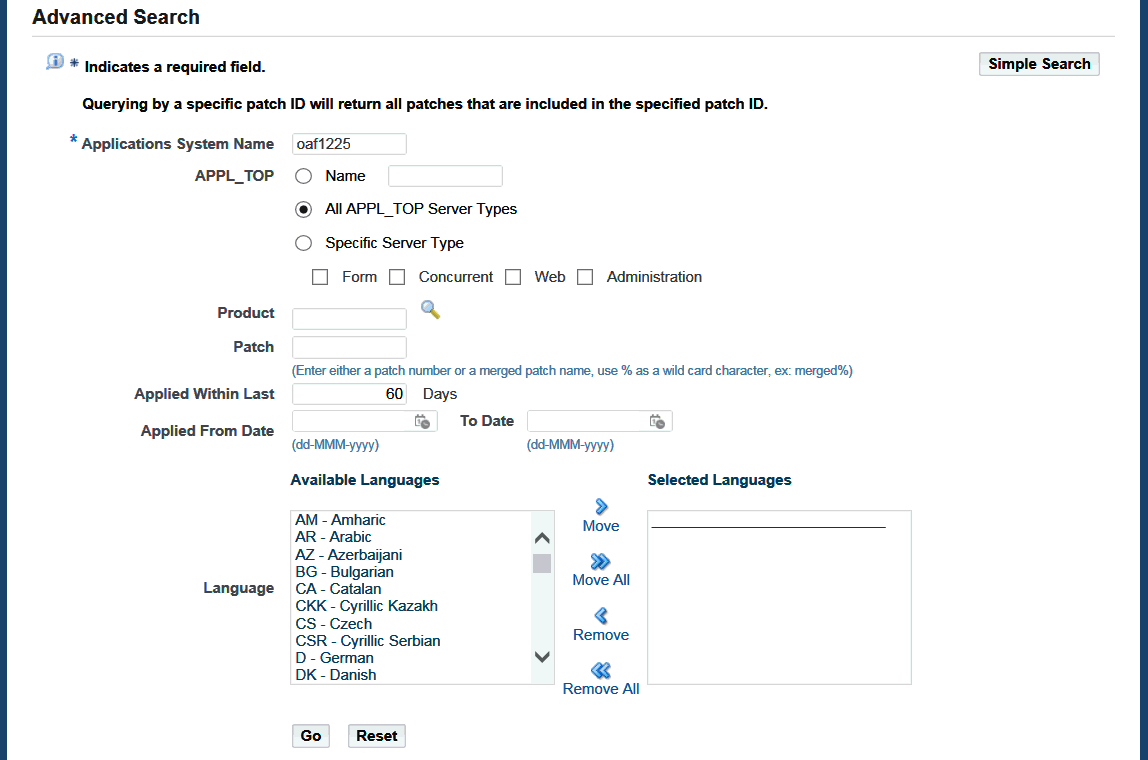
On the Advanced Search page, there are additional search criteria to narrow the results of a query:
-
Applications System Name (required): Defaults to the name of your Oracle E-Business Suite system. If you have migrated applied patches information from another system, and want to search those records, enter the name of that system.
-
APPL_TOP: Select Name and enter the name of the APPL_TOP where the patches were applied.
-
Product: Enter the product short name of the product that owns the patch in this field. The product short names for gl, ap, and fa are SQLGL, SQLAP, and OFA respectively. For all other products, the short name is the uppercase equivalent to the product abbreviation. For example, "AD" or "INV". This field is not case-sensitive.
-
Patch: Enter the patch number in this field.
-
Applied Within Last <number> Days: Restricts the timeframe during which the patches were applied.
-
Applied From Date <begin date> To Date <end date>: Narrows the search to a specified period of time. Click the calendar icon to select the date or enter the date directly in the field.
-
Language: Select the language of a patch to be queried. Select one language or multiple languages in the Available Languages box and click the Move button.
Search Results
After a search, the results appear at the bottom of the search page. If the results section contains multiple pages of retrieved information, use the Previous and Next links or the drop-down list to navigate from page to page. The retrieved patch information is presented in increments of 25 line items per page. Each line item represents an applied patch.
The details provided for each patch are:
-
Patch Name: Name of the patch.
-
Patch Description: Describes the patch.
-
Merged Patches: Lists patches that have been merged.
-
APPL_TOP Name: Name of the APPL_TOP where the patches were applied.
-
Language: Patch language.
-
Completion Date: Date and time the patch application was completed.
-
Details: Provides access to the Patch Details report.
Click a Details icon in the report to open the Patch Details report, which provides details for a specific patch. From the Patch Details report, you can drill down and access reports showing timing details for the patch, all files copied to the file system by this patch, all bug fixes that were applied by this patch, and all actions taken by the patch driver.
Note: For more information on the Patch Details report, see: Patch Details.
File History Search Pages
To search for files that have been updated by a patch, click the File History option in the Select Feature drop-down list on the Applied Patches search pages.
Simple Search
You can perform a Simple Search from this page by entering the required information in the input fields.
File History Page - Simple Search
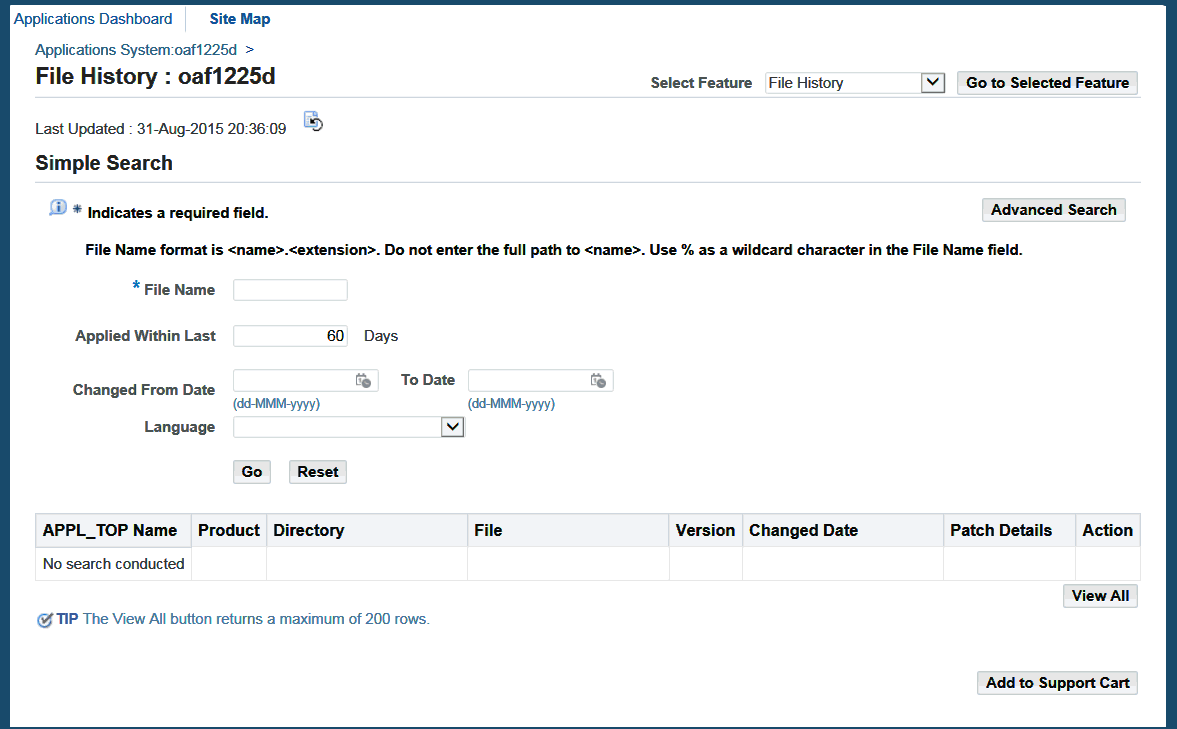
The following fields are in the Simple Search section:
-
File Name (required): Enter the name of a file in this field. Do not include a directory path. This field is case-sensitive and accepts a % wildcard symbol in combination with literal characters.
-
Applied Within Last <number> days: Enter the number of days to include in the search. The default is 60 days.
-
Changed From Date <begin date> To Date <end date>: Search for files that were updated during a specified period of time. Click the calendar icon to select the date or enter the date directly in the field. Some examples for the use of this field are.
-
Enter only the begin date. This search returns file history information from the begin date through today's date.
-
Enter only the end date. This search returns file history information up to the end date.
-
Enter the begin date and the end date. This search returns file history information between the begin date and the end date.
-
-
Language: Select the language of a file to be queried. You can select only one language in this field. To select multiple languages, go to the File History Advanced Search page.
To submit the query, click the Go button. The Reset button clears the entered search criteria.
Note: If you have not entered a value in the File Name field, a message prompts you to go back and complete the field.
Advanced Search
Click the Advanced Search button. Then enter the search criteria information on the Advanced Search page.
File History Page - Advanced Search
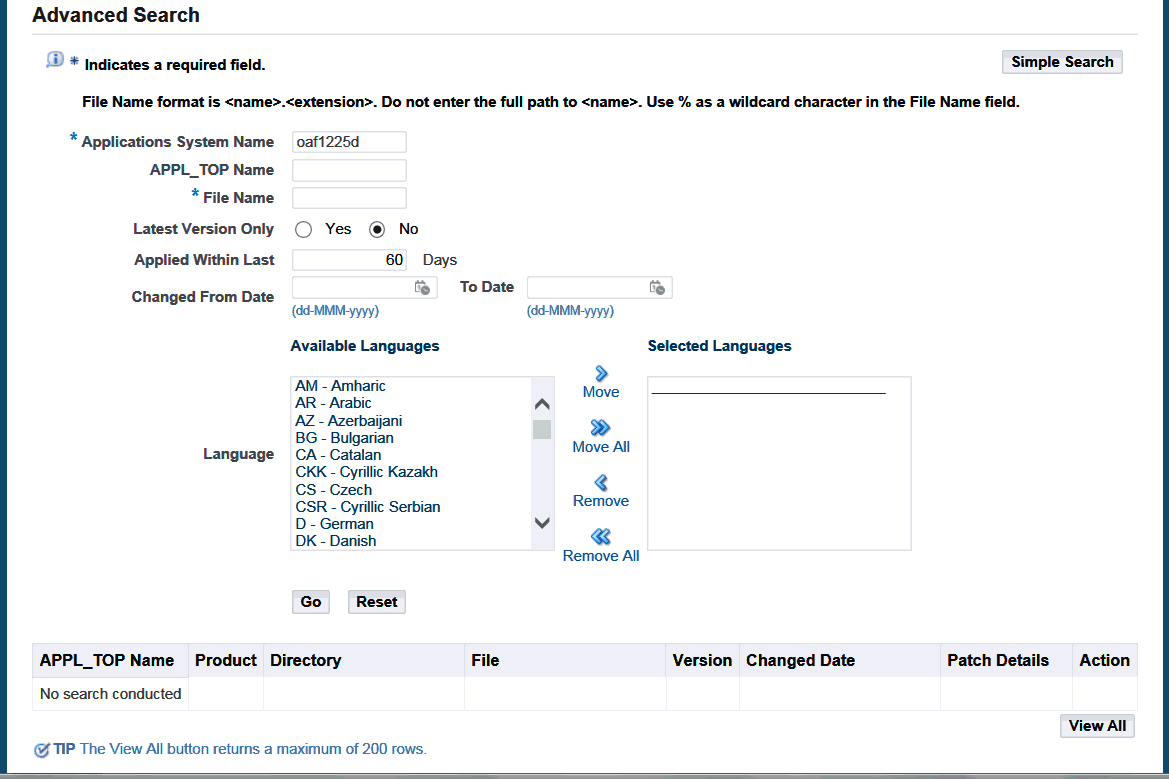
There are additional search criteria on the Advanced Search page to narrow the results of a query:
-
Applications System Name (required): Defaults to the name of your Oracle E-Business Suite. If you have migrated file history information from another system, and want to search those records, enter the name of that system.
-
APPL_TOP name: Name of the APPL_TOP containing the file.
-
File Name (required): Enter the name of a file in this field. Do not include a directory path. This field is case-sensitive and accepts a % wildcard symbol in combination with literal characters.
-
Latest Version Only: The options are Yes or No. Yes returns information for only the latest version of the file. No returns information for all versions of the selected file.
-
Applied Within Last <number> days: Enter the number of days.
-
Changed From Date <begin date> To Date <end date>: Search for file history information spanning a specified period of time. Click the calendar icon to select the date or enter the date directly in the field.
-
Language: Select the language of a patch to be queried. Select one language or multiple languages in the Available Languages box and click the Move button.
Search Results
After a search, the results appear at the bottom of the page. Each line item represents a file that was changed due to its inclusion in a patch. The details provided for a file are:
-
APPL_TOP Name: This is the name of the APPL_TOP containing the files.
-
Product: Name of the product that owns the file.
-
Directory: Directory path where the file is located.
-
File: Name of the file.
-
Version: Version number of the file.
-
Changed Date: Date this version of the file was updated by a patch.
-
Patch Details: Click on the patch number to see the Patch Details report for the patch in which the file was included.
-
Action: Click on the icon to see the Action Summary report for the action that updated the file.
If a file has never been patched, the message "The above criteria resulted in no rows" appears in the APPL_TOP Name column. If the number of files retrieved exceeds 200, the report lists only the first 200 files. Use the filter to reduce the number of files in the report.
Patch Details
From the Applied Patches page, click the Details icon in a selected row from the results section, or from the File History page, click the patch number link in the Patch Details column, to open the Patch Details report. This report provides details for a specific patch. The patch summary information is carried over and appears at the top of the Patch Details report.
Patch Details Report
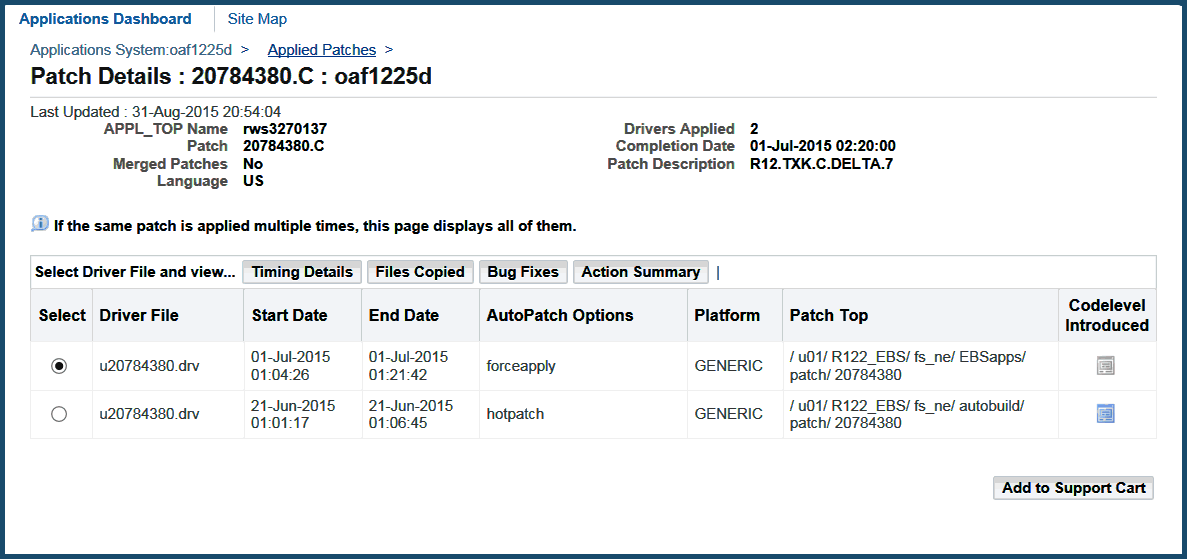
This report contains the following information:
-
Select: This option button determines which driver file details are presented in the Timing Details report, Files Copied report, the Bug Fixes report, or the Action Summary report.
-
Driver File: Name of the driver file.
-
Start Date: Date and time the application of the driver file began.
-
End Date: Date and time the application of the driver file was complete.
-
adop Options: Displays any command line options used to run the driver file.
-
Platform: Platform of the driver file.
-
Patch Top: Location of the driver when it was run.
-
Codelevel Introduced: Link to the Codelevel Introduced report for the patch.
To see additional details for a patch, click one of the following buttons on the report:
-
Timing Details: Takes you to the adop Timing Details report.
-
Files Copied: Takes you to the Files Copied report.
-
Bug Fixes: Takes you to the Bug Fixes report.
-
Action Summary: Takes you to the Action Summary report.
Codelevel Introduced
From the Patch Details page, click the Codelevel Introduced icon to access the Codelevel Introduced report.
Codelevel Introduced Report
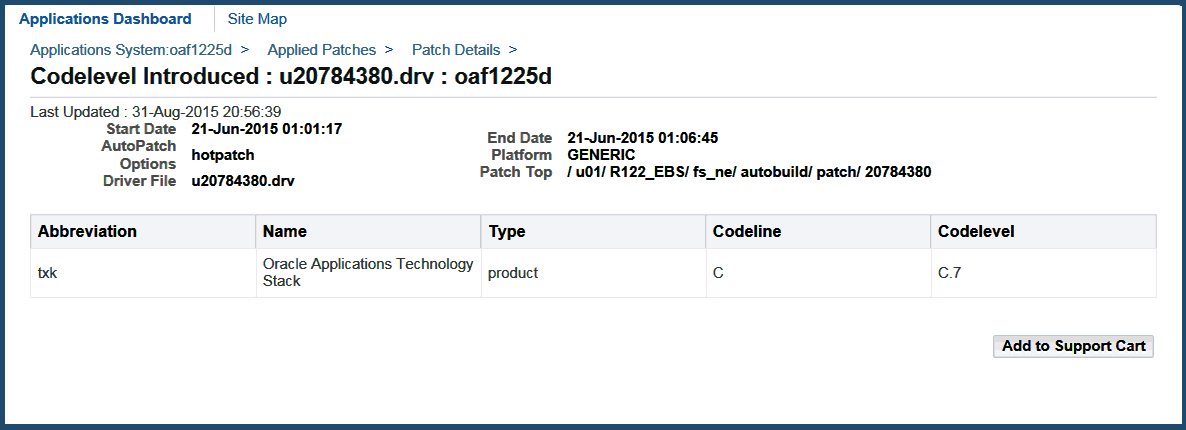
This report contains the following information about the codelevel introduced:
-
Abbreviation: The abbreviation for the product, product family, or feature to which this patch applies.
-
Name: The full name of the product, product family, or feature to which this patch applies.
-
Type: Indicates whether this patch applies to a product, product family, or feature.
-
Codeline: Indicates the codeline of the current product, product family, or feature in the patch. (For example, codeline A for Release 12.0, codeline B for Release 12.1, and so on.)
-
Codelevel: Indicates the codelevel of the current product, product family, or feature in the patch. (For example, codelevel A.1 for RUP1, A.2 for RUP 2, and so on.)
You can sort each of these columns by clicking the column title at the top of the report.
Timing Details
The adop Timing Details can also be accessed through the Timing Reports link from the Maintenance tab on the OAM Site Map.
See Timing Reports for more information on Timing Details.
Files Copied
The Files Copied report lists all files copied to the file system as a result of the actions in the selected driver file. You access this report by selecting a driver file in the Patch Details report and clicking the Files Copied button.
Files Copied Report
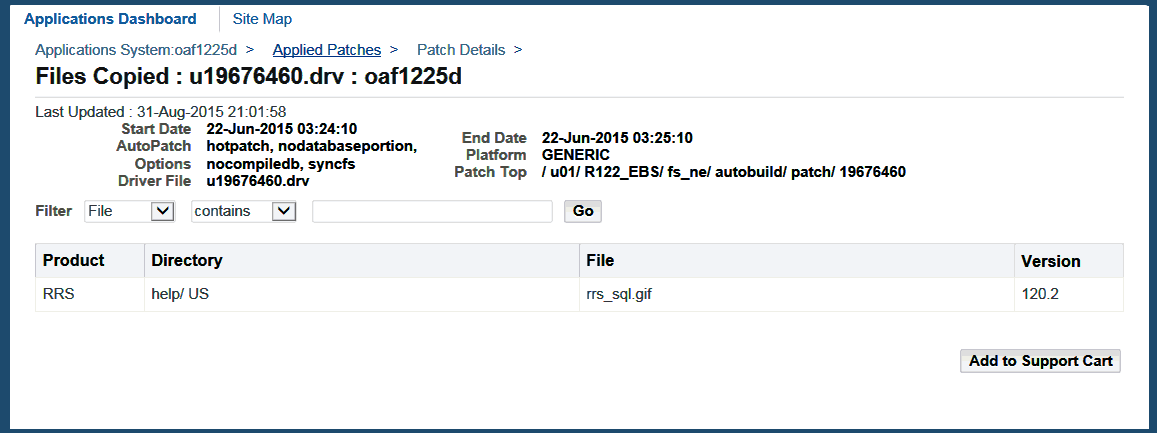
This report contains the following information about the files copied:
-
Product: Short name for the product that owns the file.
-
Directory: Directory path where the file was copied.
-
File: Name of the file.
-
Version: Version number of the copied file.
You can sort each of these columns by clicking the column title at the top of the report. If there are no files copied in the patch, no rows are displayed. If the number of files copied exceeds 200, the report lists only the first 200 files. Use the filter to reduce the number of files in the report.
Bug Fixes
The Bug Fixes report lists all bug fixes included in the selected driver file. Select a driver file in the Patch Details report and click the Bug Fixes button.
Bug Fixes Report
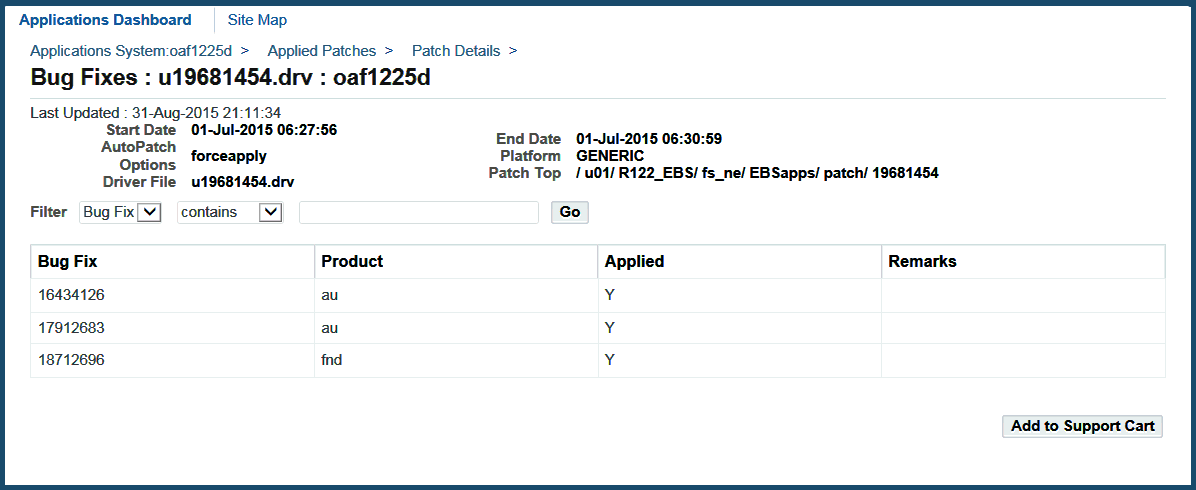
This report contains the following information about bug fixes:
-
Bug Fix: Number of the bug fixed as a result of the selected driver file. Some items in this column are links. Clicking a linked item accesses the Action Summary report.
-
Product: Short name for the product for which the bug was fixed.
-
Applied: Indicates whether the bug fix was applied.
-
Remarks: If the bug fix was not applied, the reason is stated here.
You can sort each of these columns by clicking the column title at the top of the report. If there are no bug fixes in the patch, no rows are displayed. If the number of bug fixes exceeds 200, the report lists only the first 200. Use the filter to reduce the number of items in the report.
Action Summary
The Action Summary report provides summary information for the actions of a selected driver file. Each line item represents a performed action. You access this report either by selecting a driver file in the Patch Details report and clicking the Action Summary button, by clicking the Action icon in the File History search results, or by clicking a bug fix number in the Bug Fix column of the Bug Fixes report.
Action Summary Report
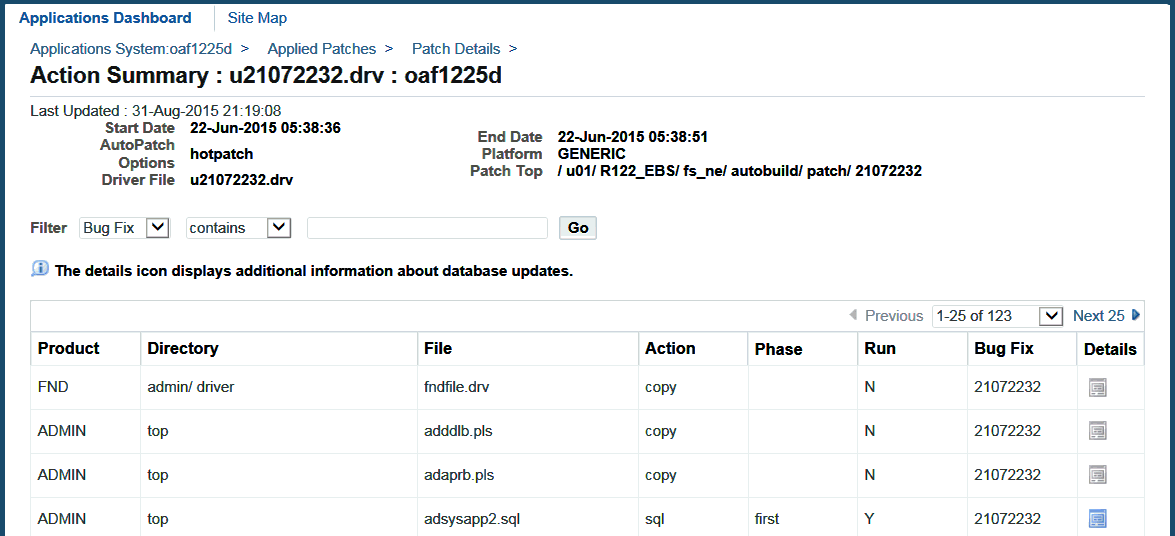
The Action Summary report contains the following summary information:
-
Product: Short name for the product that owns the file referenced by the action.
-
Directory: Directory path for the file referenced by the action.
-
File: Name of the file referenced by the action.
-
Action: Type of action performed on the updated file.
-
Phase: Phase in which the action occurred.
-
Run: Signifies whether the action was executed.
-
Bug Fix: Number of the bug fixed as a result of the selected driver file.
-
Details: This link is active if adop performed database actions, usually SQL or EXEC actions where Run = y. Click this link to access the Action Details report.
You can sort each of these columns by clicking the column title at the top of the report. If the number of actions exceeds 200, the report lists only the first 200. Use the filter to reduce the number of items in the report.
Action Details
To access this report, click the Details icon in a selected row of the Action Summary report. The Action Summary information is carried over and presented at the top of the report.
Action Details Report
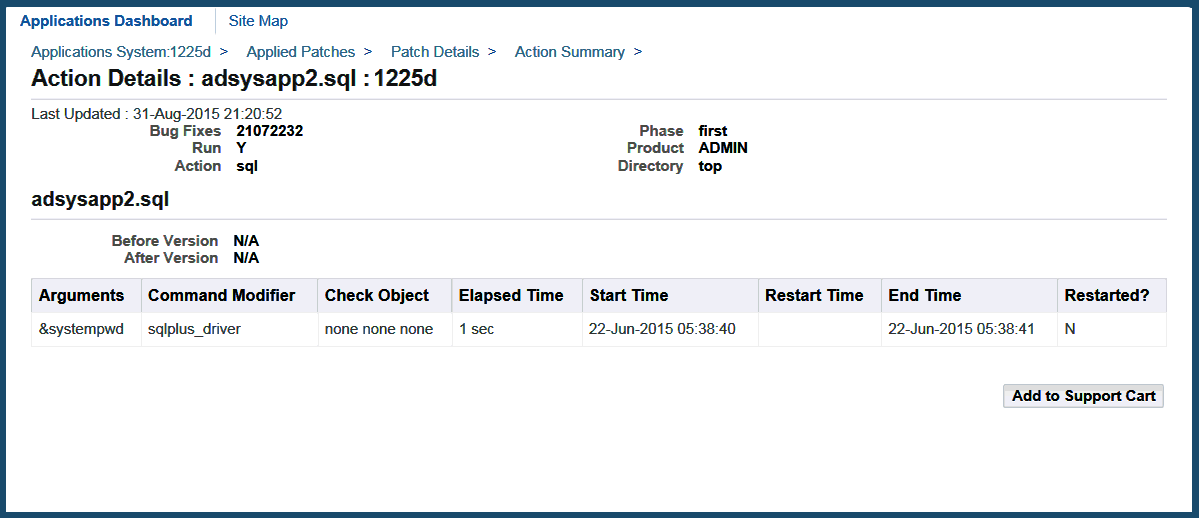
This report contains the following information about action details:
-
Arguments: Specific argument for SQL and EXEC commands.
-
Command Modifier: SQL or EXEC command modifier in the database section of the driver.
-
Check Object: Name of the database object to check for, along with name and password of the schema where adop looks for the checked object.
-
Elapsed Time: Time required to complete the action.
-
Start Time: Date and time the action began.
-
Restart Time: Date and time the action was restarted.
-
End Time: Date and time the action was complete.
-
Restarted?: States whether the action was restarted.
N/A in the report represents action details that are not specified. For example, in the Arguments field, N/A means no additional arguments were specified.
Timing Reports
The Timing Reports utility provides the job history of applied patches. It captures statistics about, and job timing information for, adop and AD Administration maintenance sessions that run parallel workers. Both adop and AD Administration store information about a processing session in database tables. You can access this information, either during the session or after it is complete, through the OAM interface.
Note: You can also access job timing information during a current session or for a completed session by running adtimrpt.sql from the command line. This script creates the adt<session_id>.lst report. For more information, see: AD Job Timing Report in the Maintenance section of this book.
During a parallel session, AD utilities assign processing jobs to workers. For jobs that affect the database, job actions are grouped in phases to reduce dependencies between jobs - workers do not have to wait for another worker to complete a dependent job before completing their assigned task. See: Using Parallel Processing in the Maintenance section of this book.
The Timing Reports utility lists processing tasks and provide details about the elapsed time for phases, jobs, and sessions. The information includes:
-
Jobs run successfully on the first try
-
Failed jobs that were restarted and then run successfully
-
Failed jobs that were skipped
-
Long-running jobs
-
Summary information for each parallel phase
-
Time taken to run a job
-
Overall elapsed time for each session
The Timing Reports Interface
The Timing Reports interface consists of a main page, a Timing Details page, and a View Log Files page which provides links to reports about specific maintenance session information.
Main Page
From the Timing Reports main page, you can view a list of all in-progress, stopped, aborted, and completed maintenance sessions. Click the Details icon to access the Timing Details page or click the Log Files icon to access the View Log Files page.
Timing Details Page
There are two types of Timing Details reports - those associated with an adop session and those associated with an AD Administration session.
Note: The discussion of each page contains more detail. The OAM help feature also contains information about the Timing Reports.
View Log Files Page
This page contains a list of log files generated for the corresponding maintenance session.
Accessing Timing Reports
To access the Timing Reports main page, log in to Oracle Applications Manager and choose Timing Reports from the Site Map.
Step 1: Log in to Oracle Applications Manager
Follow the instructions in Accessing Patch Wizard to access OAM. From the Applications Dashboard, click the Site Map tab.
Step 2: Access Timing Reports
From the Site Map, Timing Reports is on the Maintenance tab under the Patching and Utilities heading. Click the Timing Reports link to go to the main page.
Step 3: Filter the results
There is a filter at the top of the page that allows you to narrow the contents of the list. You can filter based on the following status of the tasks: Any tasks, In-progress tasks, Completed tasks, Stopped tasks, or Aborted tasks. You can also filter by Task Name, Status, Start Date, and Run Time. Click Go to activate the filter.
Note: See descriptions of individual pages in this chapter for details. See also AD Administration in the Maintenance section of this book.
Timing Reports Main Page
The Timing Reports main page shows information for each maintenance session.
Timing Reports Main Page
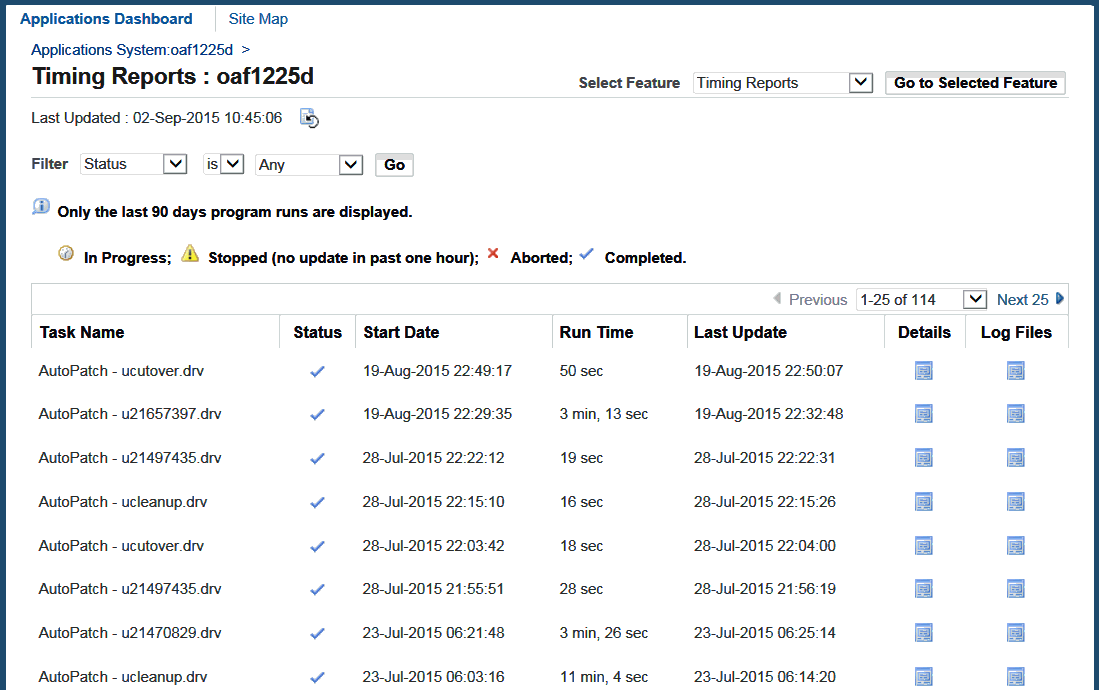
-
Task Name: Name and brief description of the maintenance session.
-
Status: Status of the timing report. A clock icon means the session is still in-progress, an exclamation icon means the session has stopped, an X icon means the session was aborted (that is, the AD utility was restarted with the gf option), and a check mark means the session has completed.
-
Start Date: Date and time the maintenance session began.
-
Run Time: Time required to complete the maintenance session.
-
Last Update: Time the timing information was last updated.
-
Details: Access the Timing Details for the maintenance session.
adop Timing Details
Click the Details icon of a selected row (with an adop task name) in the Timing Reports list to open the adop Timing Details report. This report provides details for a specific session of adop.
adop Timing Details Report
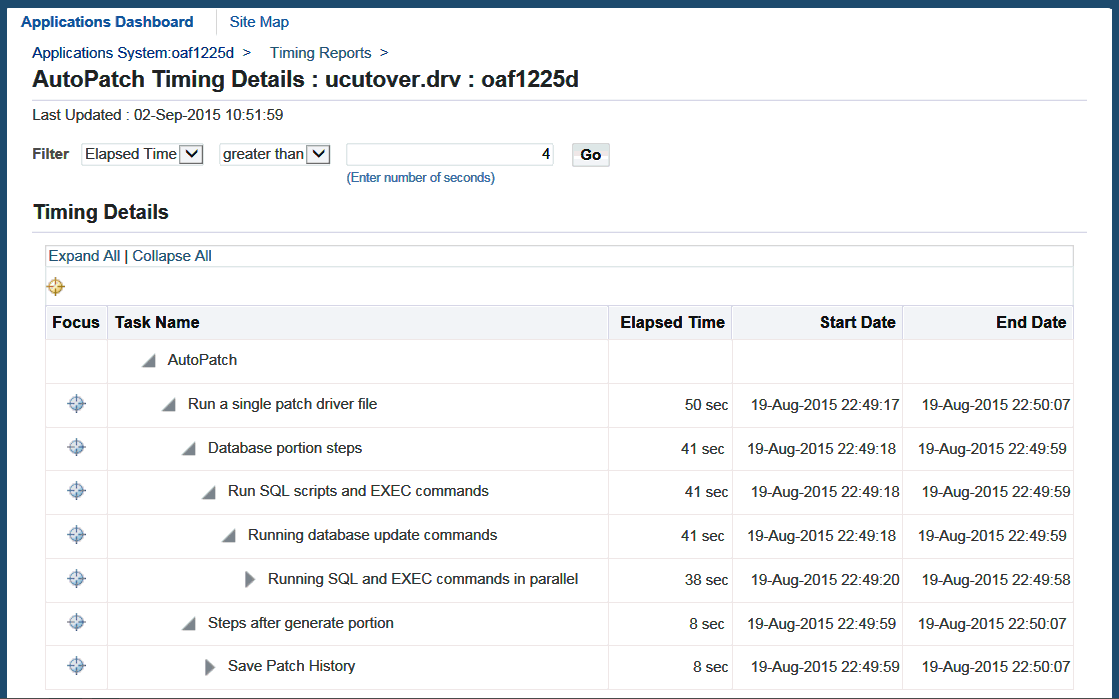
The adop Timing Details report lists every task performed in a maintenance session. The Timing Details section contains the following information for each task:
-
Focus: Select the circle icon next to a task to see just the sub-tasks within it.
-
Task Name: Name of the task. Click the triangle icon to expand or contract the sub-tasks within the task. The underlined Task Names are links to the Job Timing report for that particular task.
-
Elapsed Time: Time required to complete the task. This field is not applicable for stopped or in-progress tasks.
-
Start Date: Date and time the task began.
-
End Date: Date and time the task was complete. This field is not applicable for stopped or in-progress tasks.
Use the filter to adjust the list of tasks based on their elapsed time. The default list shows all tasks with elapsed time of greater than 4 seconds. Use the Expand All link to see all sub-tasks and the Collapse All to see just the top-level task.
When you access the adop Timing Details report for a stopped or in-progress task, the page defaults to display the most recently performed sub-tasks. For in-progress tasks, you can use the Refresh icon to get the latest running tasks. The Refresh icon is a picture of a page with a blue circular arrow.
Run Information
Additional adop task information is available by clicking the triangle icon for the Run Information section at the bottom of the page. The subsections in Run Information are General, Timing Summary, and Files Installed on this APPL_TOP.
adop Timing Details Report - Run Information

General
This subsection contains the following information:
-
Utility Name: Name of the utility used to perform the task.
-
Task: Task performed.
-
Log File: Name and location of the log file.
-
Driver File: Name and location of the patch driver file.
-
Patch Top: Location of the patch driver files.
-
Options: Command options used when running adop.
-
Platform: Platform of the system.
-
Applications System Name: Name of the Applications system on which the task was performed.
-
Oracle Database: Name of the database.
-
Oracle Home: Directory path to the Oracle home used to link the executables.
-
APPL_TOP Name: Name of the APPL_TOP.
-
APPL_TOP Directory: APPL_TOP directory path.
Timing Summary
This subsection contains the following information:
-
Start Date: Date and time the task began.
-
End Date: Date and time the task was complete. This field does not apply for stopped or in-progress tasks.
-
Total Run Time: Time required to complete the task. This field does not apply for stopped or in-progress tasks.
Files Installed on this APPL_TOP
This subsection contains the following information:
-
Java and HTML: States whether the APPL_TOP on which the task was performed supports HTTP (Web) services.
-
Forms: States whether the APPL_TOP on which the task was performed supports forms services.
-
Concurrent Processing: States whether the APPL_TOP on which the task was performed supports concurrent processing services.
AD Administration Timing Details
Click the Details icon of a selected row (with an AD Administration task name) in the Timing Reports list to open the AD Administration Timing Details report. This report provides details for a specific session of AD Administration.
AD Administration Timing Details Report
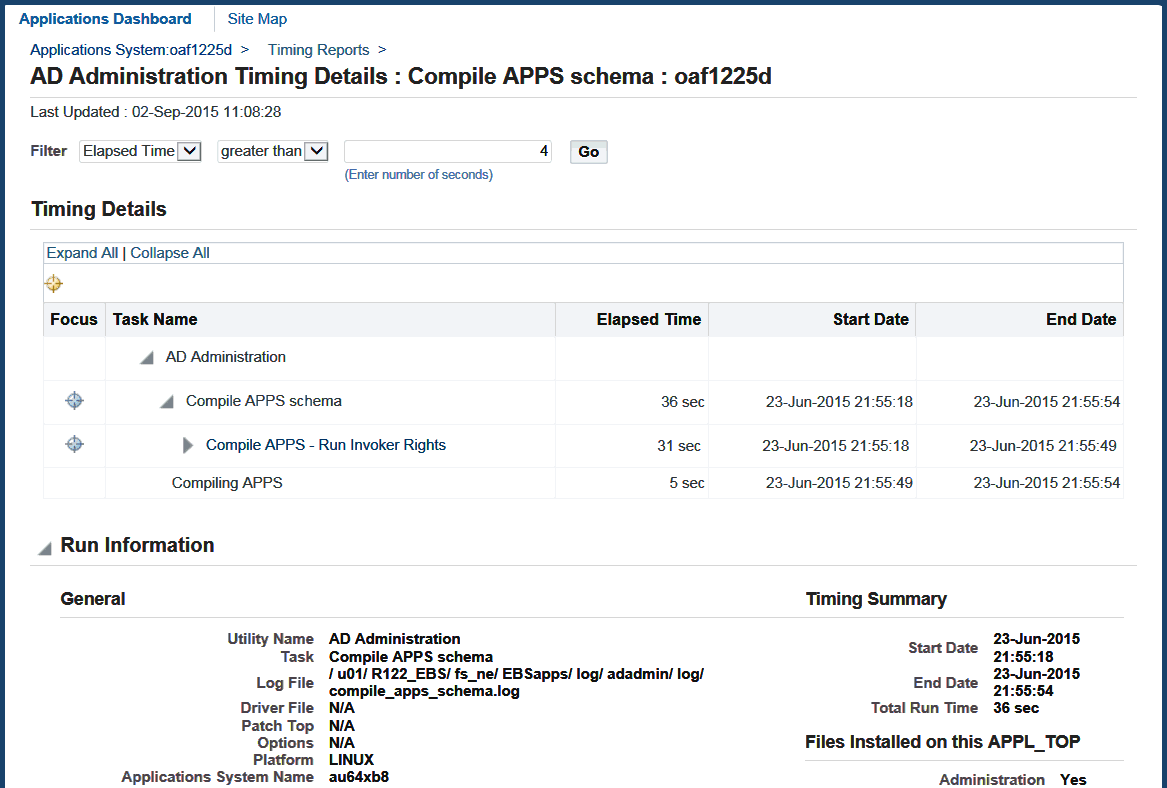
The Timing Details and Run Information sections contain the same types of information for each task as the adop Timing Details report. See: adop Timing Details.
In-Progress Timing Details
You can use the In-Progress Timing Details page to monitor the job while it is running. Click the Refresh icon to view the steps that are in progress.
In the In-Progress AD Utility section, you can filter the results by elapsed time.
The adop Timing Details section contains the following information for each task:
-
Focus: Select the circle icon next to a task to see just the sub-tasks within it.
-
Task Name: Name of the task. Click the triangle icon to expand or contract the sub-tasks within the task. The underlined Tasks Names are links to the Job Timing report for that particular task.
-
Elapsed Time: Time required to complete the task. This field is not applicable for stopped or in-progress tasks.
-
Start Date: Date and time the task began.
-
End Date: Date and time the task was complete. This field does not apply for stopped or in-progress tasks.
-
Number of jobs in this task: Number of jobs contained within each level of the task.
-
Number of jobs completed: Number of jobs completed within this level of the task.
Job Timing
The underlined Task Names in the adop Timing Details report and the AD Administration Timing Details report link to the Job Timing report for that particular task. This report provides timing information for each job within the selected task and allows you to drill down into each task to view any exception reports.
Job Timing Report
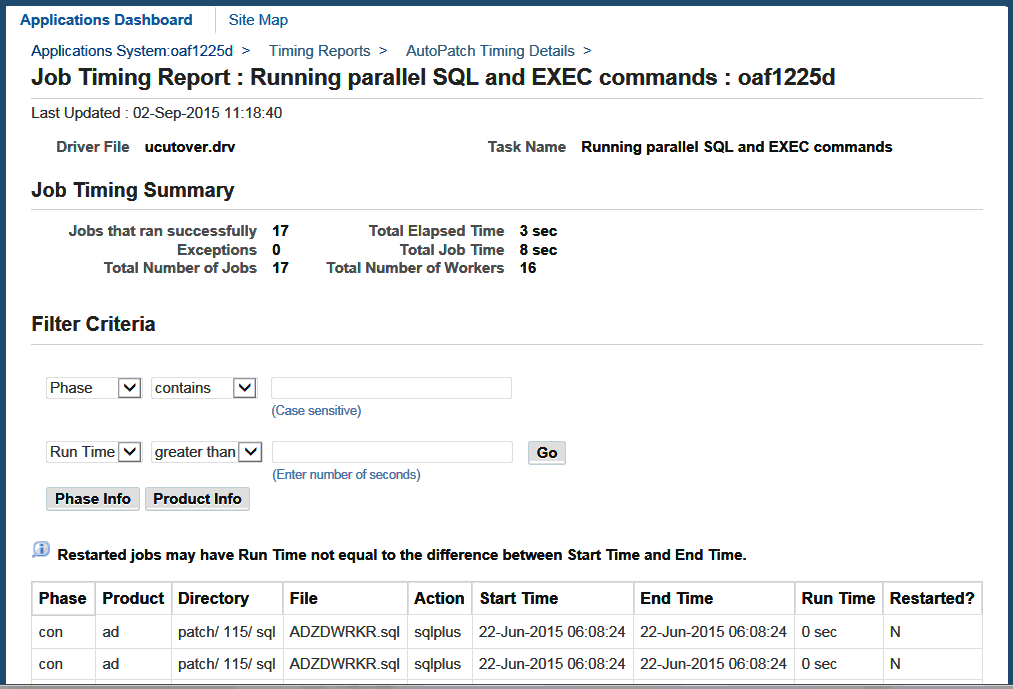
Click a Task Name on the Timing Details report to open the Job Timing report. The Job Timing Summary information appears at the top of the Job Timing report and the details appear at the bottom.
The summary information includes:
-
Jobs that ran successfully: Number of successful jobs.
-
Exceptions: Number of jobs that were not completed successfully. If exceptions exist, it is a hyperlink to the Exception report.
-
Total Number of Jobs: Number of jobs within the task.
-
Total Elapsed Time: Time required to complete the task.
-
Total Job Time: Time required to complete the jobs within the task.
-
Total Number of Workers: Number of workers used to perform the task.
The Job Timing Details section contains the following information for each job:
-
Phase: Database processing phase.
-
Product: Abbreviation for the product being updated.
-
Directory: Directory path of the file run by the job.
-
File: File used to perform the job.
-
Action: Action of the job.
-
Start Time: Date and time the job began.
-
End Time: Date and time the job completed.
-
Run Time: Total time of the job.
-
Restarted?: States whether the job was restarted.
The filters at the top of the Details section allow you to adjust the list of jobs based on the property and run time of jobs. You can filter based on the following properties of the jobs: Phase, Product, Directory, File, Action, or Restarted. Click Go to activate the filter.
Click the Phase Info button to open the Phase Information report.
Phase Information
Clicking the Phase Info button provides timing information by phase for a task selected in either the adop Timing Details report or the AD Administration Timing Details report.
Phase Information Report
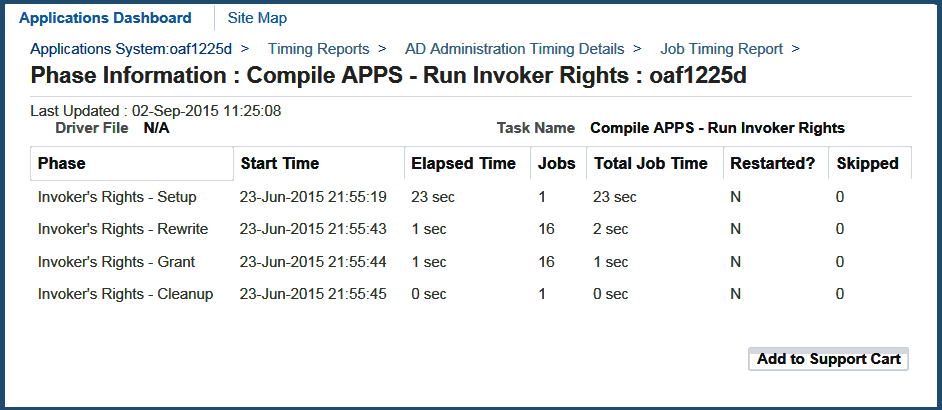
The general information presented at the top of the Phase Information report are:
-
Driver File: Name of the driver file.
-
Task Name: Name of the task performed.
The Phase Information details include:
-
Phase: Database processing phase.
-
Start Time: Date and time the phase began.
-
Elapsed Time: Time required to complete the phase.
-
Jobs: Number of jobs in the phase.
-
Total Job Time: Time required to complete the jobs within the phase.
-
Restarted?: States whether any jobs within the phase was restarted.
-
Skipped: Number of jobs within the phase that were skipped.
Product Information
Clicking the Product Info button displays timing information for all products, with the aggregate timing information for database tasks being shown in the Total Job Time column for each product.
Overall Product Summary

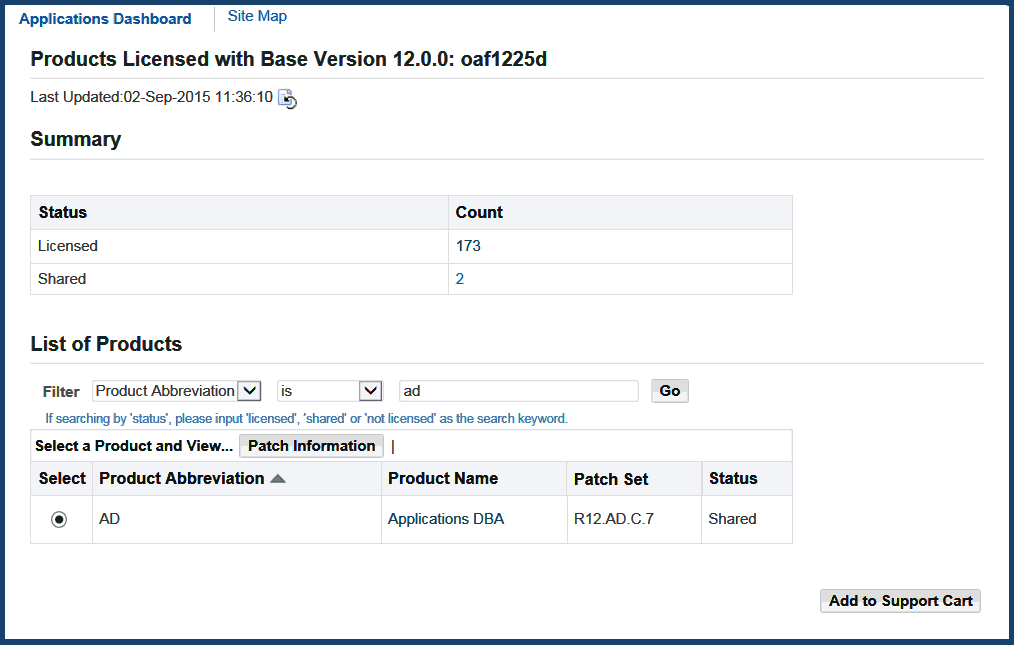
Clicking the link for an entry in the Product column displays full status details for a specific product. The example shown below is for FND.
Specific Product Details
Exceptions
Clicking the Exceptions number in the Job Timing report opens the Exception report. This report is available only for jobs that have an Exceptions value greater than zero in the Job Timing report. It provides a list of exceptions encountered during the maintenance session.
Exception Report
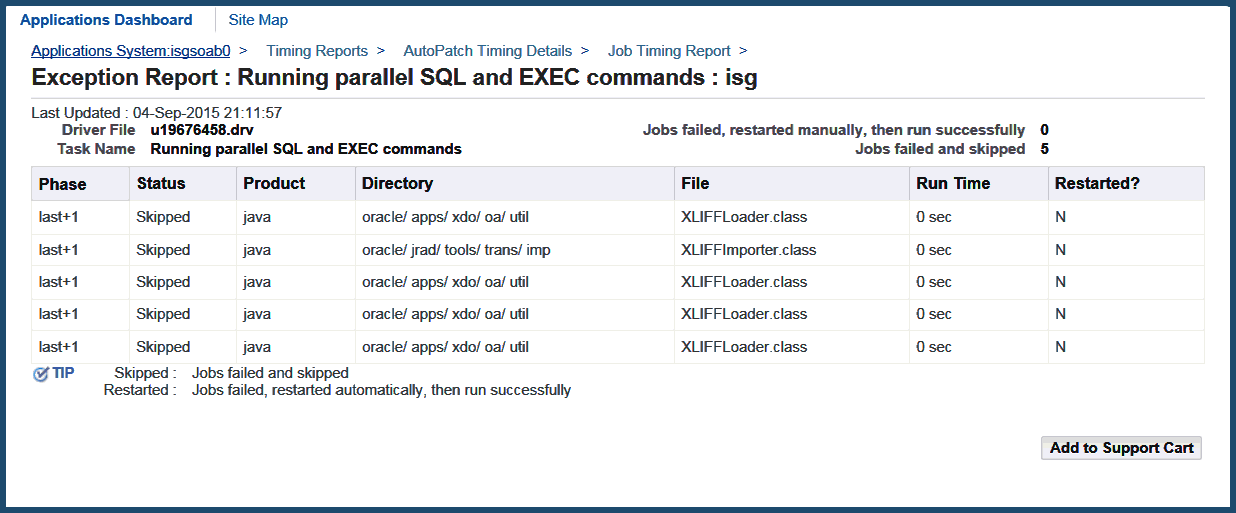
The general information includes:
-
Driver File: Name of the driver file being run when the exception occurred.
-
Task Name: Task being performed when the exception occurred.
-
Jobs Failed, then restarted successfully: Number of jobs that initially failed but were restarted successfully.
-
Jobs Failed and skipped: Number of failed jobs that were skipped.
The Exception details include:
-
Phase: Database processing phase.
-
Status: Status of the exception.
-
Product: Owner of the file with the exception.
-
Directory: Location of the file.
-
File: File being processed when the exception occurred.
-
Run Time: Total time the process ran.
-
Restarted?: States whether the job with the exception was restarted.
View Log Files
Clicking the Log Files icon of a selected row opens the View Log Files page. This page lists all the log files generated for a specific maintenance session. You can view log files of completed jobs or jobs that are in progress.
View Log Files Page
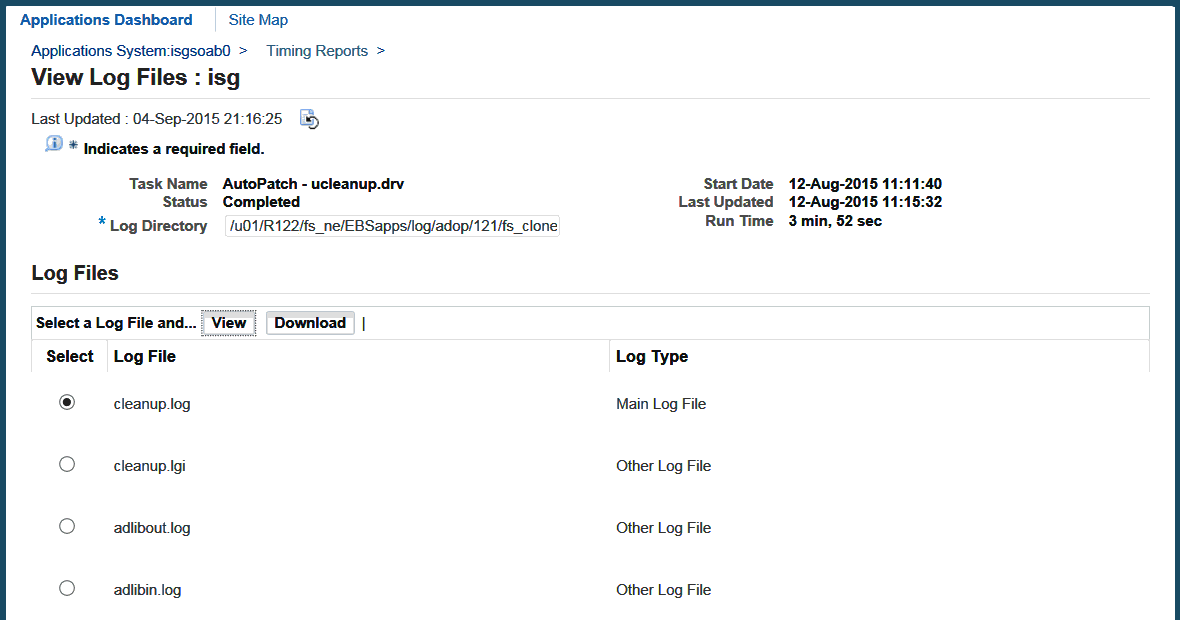
The View Log Files page contains the following information:
-
Task Name: Name of the task for which these log files have been generated.
-
Status: Status of the task. Valid status types are: In-progress, Completed, Stopped, or Aborted.
-
Log Directory: Location of the listed log files. It is defined by the user when the task is run. This is a required field.
-
Start Date: Date and time the task was started.
-
Last Updated: Date and time the task was completed.
-
Run Time: Time required to complete the task.
The following buttons apply to the Log Files section:
-
View: Use this button to view a log file after you have selected the radio button of the corresponding log file.
-
Download: Use this button to download a log file after you have selected the radio button of the corresponding log file.
The Log Files section contains the following information:
-
Select: Use this radio button to select the corresponding log file for viewing or downloading.
-
Log File: Name of the log file.
-
Log Type: Log files can be one of these types:
-
Main - primary log files for patch applications and AD Administration tasks.
-
Worker - generated by the processes that run in parallel, using a number of workers.
-
Other - informational files and log files created by the copy portion of a universal (u) patch driver, for example.
-
View Log Details
Details of each log file are displayed on the View Log Details page. To access this page, select the radio button next to one of the log files and click the View button. The page displays up to 500 lines. It automatically defaults to the last page in the log file.
View Log Details Page
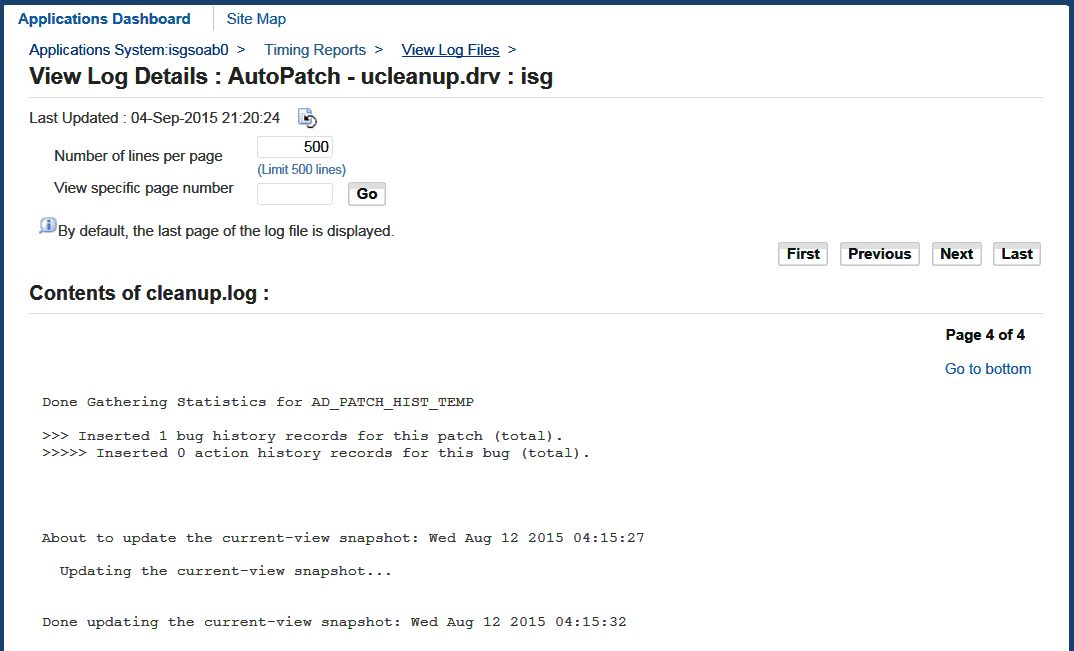
The View Log Details page contains the following information:
-
Number of lines per page: Use this to specify the number of lines per page you want to display. The maximum number of lines per page you can display is 500.
-
View specific page number: Use this to view a specific page. Enter the page number in the field and click the Go button.
You can use the following buttons to navigate to specific portions of the log file:
-
First: Go to the first page.
-
Previous: Go to the previous page.
-
Next: Go to the next page.
-
Last: Go to the last page.
Contents of ...
This section displays the contents of the log file. Click the Go to bottom link to navigate to the last page of the log file. From the last page of the file, click the Return to top link to go back to the first page.
Software Updates
Software Updates is a portal from which you can view all the patching-related activities of your system. From the Software Updates main page, you can access information such as:
-
patches that have or have not been applied
-
latest three patch recommendation requests from the Patch Wizard page
-
latest eight jobs run from the Timing Reports page
-
links to patching related pages
The Software Updates Interface
The Software Updates page is a Web-based utility in Oracle Applications Manager. From this page, you can get an overview of all patching-related information.
Accessing Software Updates
To view patching-related activities for your system, log in to Oracle Applications Manager and click the Software Updates tab.
Step 1: Log in to Oracle Applications Manager
Follow the instructions in Accessing Patch Wizard to access OAM.
Step 2: Click on the Software Updates tab
From the Applications Dashboard, click the Software Updates tab.
Software Updates Page
This section describes the Software Updates page.
Software Updates Page
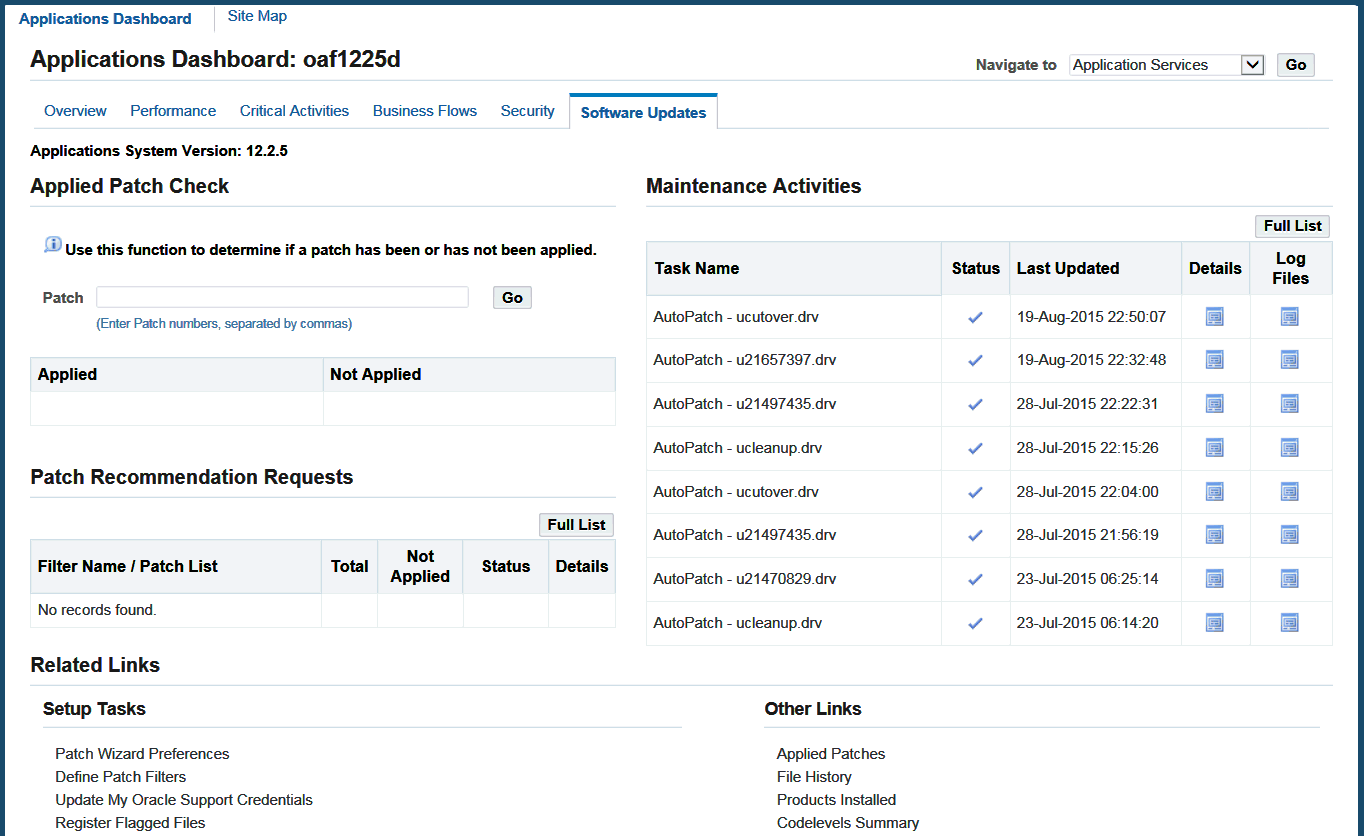
The top of the page indicates the version of your Oracle E-Business Suite system.
Applied Patch Check
Use the Applied Patch Check field to check if a patch or a series of patches have been applied to your system. Enter a patch ID or a series of IDs separated by commas to check if the patch or patches have been applied to your system. The table below the field contains two columns: Applied and Not Applied. Your queried patch ID appears in the corresponding column depending on whether it has been applied or not.
Patch Recommendation Requests
This section lists the latest three patch recommendation requests from the Patch Wizard main page. From this section, you can view the following information: Filter Name/Patch List, Total (Applied and Unapplied), Unapplied, Status, and Details.
Click the Full List button in the Patch Recommendation Results section to go directly to the Patch Wizard main page. Click the Details icon to go directly to the Recommended Patches Results of the associated patch. See: Accessing Patch Wizard.
Maintenance Activities
This section lists the latest eight jobs from the Timing Reports page. From this section, you can view the following information: Task Name, Status, Last Updated, Details, and Log Files.
Click the Full List button in the Maintenance Activities section to go directly to the Timing Reports main page. Click the Details icon to go directly to the Timing Details report of the associated task, or click the Log Files icon to go directly to the View Log Files page of the associated task. See: Timing Reports.
Related Links
This section lists the links related to patching activities for your system.