Defining a Demand Plan
This chapter covers the following topics:
- About defining a Demand Plan
- Procedure to define a Demand Plan
- Input Parameters
- Scenarios
- Events
- Price lists
- Options
- Scope
- Validate plan
About defining a Demand Plan
A demand plan is a group of parameters that defines both the inputs and outputs of the demand planning process as well as the dimensional levels along which the demand analysis is to occur.
Though each Demand Plan is defined for an organization, it is global and is not owned by that organization.
You can associate up to four User Dimensions with a Demand Plan. The remaining Demand Planning Dimensions can be collapsed into other User Dimensions. Although you cannot view more than four User Dimensions at one time, this collapsing allows you to toggle between them. For details about defining user dimensions, see: Flexible Data Stream User Procedures.
There may be situations where different units of measure exist for items within the same product family. This makes it extremely difficult to determine what the forecast should be at an aggregate level when there is no common unit of measure. The Base UOM field provides a method to change the units for all items within a higher level of aggregation to a common unit of measure as determined by the Demand Planning Administrator.
You can prioritize demands at the scenario level. Prioritizing demands at the scenario level allows you to push forecast scenarios with specified demand priorities to any downstream application that takes output of Oracle Demand Planning as input.
Procedure to define a Demand Plan
Each tab in the Demand Plans window will be discussed.
Dimensions
This section describes the demand plan dimensions tab.
To define the demand plan dimensions and header level information:
-
Choose the Demand Planning System Administrator responsibility.
-
In the Navigator, select Demand Plans.
-
If you have not previously indicated, then choose an organization to open the Demand Plans window.
-
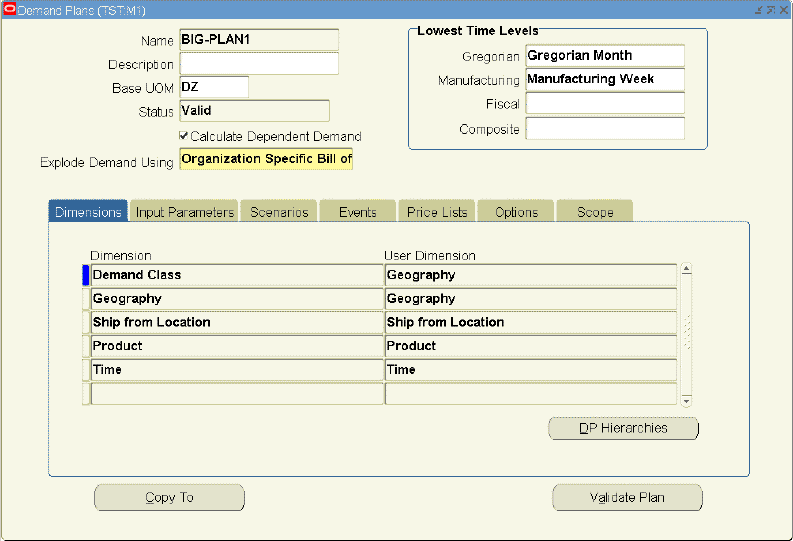
Use this window to define a Demand Plan. The bottom region of this form is used for collapsing the various demand planning dimensions to the user dimensions associated with this Demand Plan.
In this example, the name and description of the Demand Plan is BIG-PLAN1. The base unit of measure is each. The lowest time level is Manufacturing Week for the Manufacturing calendar type and Gregorian Month for the Gregorian calendar type. Five demand planning dimensions are being collapsed into four user dimensions: demand class and geography are being collapsed into the geography user dimension. Ship from location is assigned to the ship from location user dimension. Note that the other user dimensions, product and time, must always be included in a Demand Plan, and should not be collapsed with any other dimension.
Collapsing the Demand Class dimension into the Geography dimension allows you to toggle between the two dimensions. However, this setup will not allow you to analyze the data by the Demand Class and Geography dimensions simultaneously. To do that, you can collapse the Demand Class dimension to the Ship From Location dimension, instead of the Geography dimension. This will enable analysis simultaneously by the Demand Class and Geography dimensions or by the Ship From Location and Geography dimensions.
If you want to calculate dependent demand based on organization specific model bills in a demand plan, it is mandatory to have a Ship From Location dimension in the demand plan, and no other dimension should be collapsed with it.
Note: Events are downloaded with four user dimensions: geography, product, time, and organization. Collapsed dimensions like demand class are downloaded as a hierarchy of one of the user dimensions (like geography). Although the event works with the collapsed dimension, the collapsed dimension name is not shown as the event qualification in the shared database.
-
Complete the fields in the Demand Plans window as follows:
Field Function Legal Values Name Demand plan name VARCHAR2(30) Description Detailed description for the demand plan VARCHAR2(240) Base UOM Base UOM is the unit of measure used for aggregating at higher levels above the item level in the product dimension.
The Base UOM field provides a method to change the units for all items within a higher level of aggregation to a common unit of measure as determined by the Demand Planning Administrator.
This is a required field. The demand plan validation will fail if the Base UOM is not defined.
The list of values for this field will be empty if you have not defined any UOM conversion. If the list of values is empty, create a UOM Conversion for your primary UOM in the source instance and recollect the data.
For more details on UOM Conversion, see Multiple Step UOM Conversion.VARCHAR2(3) Status Shows the Demand Plan status. For details, see: Validate plan. Invalid or valid Calculate Dependent Demand If this is checked, it activates dependent demand forecast explosion process for a demand plan. This is a plan level control. Also, this is used to enable global forecasting.
If this is not checked, then model bills of material, planning percentages, and dependent sales histories are not used by the Oracle Demand Planning Engine for that demand plan.Checked or unchecked (default) Explode Demand Using If you choose Organization Specific Bill of Material, the demand plan is created for an organization specific forecast, and Demand Planning uses the organization specific model bills.
If you choose Global Bills of Material, you enable global forecasting. In this case, Oracle Demand Planning uses generic model bills from the item validation organization to calculate dependent demand for all the organizations in the demand plan. Calculating dependent demand based on global model bills is optional.Organization Specific Bill of Material (Default Value) or Global Bills of Material Lowest Time Levels:
Gregorian, Manufacturing, Fiscal, CompositeShows the lowest level of time you want to track for the four available calendar types.
For details, see: Lowest Time Levels for the demand plan.Lookup Values:
Gregorian: Year, Quarter, Month, and Day.
Manufacturing: Period, Week, and Day.
Fiscal: Year, Quarter, Month, and Day.
Composite: Year, Quarter, Month, Week, and Day.Dimension (tabbed region) The Dimensions associated with this Demand Plan. Lookup Values User Dimension (tabbed region) The collapsed Dimensions available for the Demand Plan. Lookup Values
Lowest Time Levels for the demand plan
There are three types of seeded calendars available in Oracle Demand Planning: manufacturing, fiscal, and Gregorian. You can define your own Oracle Demand Planning specific custom calendar by using composite calendars. User defined composite calendars allow you to align weeks to months so that your manufacturing and fiscal reporting needs can be met by one calendar.
The Composite Calendar can be loaded in a time hierarchy via flat files. Loading the calendars means bringing the level values for the levels, such as Day, Manufacturing Week, Fiscal Month, Fiscal Quarter, and Fiscal Year, of time dimension.
The user can select one time bucket per calendar type for a demand plan as the lowest time level.
All the calendar types for which a lowest time level has been specified are used in Oracle Demand Planning . However, using more number of calendars in demand planning effects performance.
Note: A demand plan's default time level is higher than a day.
To select one time bucket per calendar type for a Demand Plan:
The List of values includes the time levels pertaining to the respective calendar type and not used.
-
Logon to the Demand Planning System Administrator responsibility.
-
In the Navigator, select Demand Plans.
The Demand Plans window appears.
-
Select the calendar type. For example, select Manufacturing Week for the Manufacturing calendar and select Fiscal Month for the Fiscal calendar.
If you select day for any of the calendars, the lowest time level for all the other calendar types should also be day.
The Output Period Type, which is the bucket at which the Demand Planning Engine would upload the forecasts to the Demand Planning Server, for any demand plan scenario cannot be lower than the lowest time level selected for the demand plan. The list of values for Output Period Type is restricted to the calendar types for which the lowest time level has been selected.
The demand planning input parameters are aggregated to the selected lowest time levels.
For example, assume that the input parameter, Booking History is available at the Day level and you select manufacturing week and fiscal month to be the lowest levels in the demand plan:
The manufacturing calendar time hierarchy will be displayed in the Demand Planning Engine as:
Manufacturing Week - Manufacturing Period - Year
The fiscal calendar time hierarchy will be displayed in the Demand Planning Engine as:
Fiscal Month - Fiscal Quarter - Fiscal Year
Booking History data will be displayed at the lowest time levels: Manufacturing Week of Manufacturing Calendar, and Fiscal Month of Fiscal Calendar and at all the higher levels in the time hierarchies.
When lowest time levels are higher than day and multiple time hierarchies (calendars) are included in a demand plan, it calls for a dynamic data translation. Only those days are made part of the time dimension, which are the end dates of an aggregate bucket period. Data at a time level that is lower than an aggregate bucket level is moved to the end date of the aggregate bucket level. This leads to a minimal number of days at the lowest level. The user does not see the day level.
Data translation from one time hierarchy to another becomes a matter of aggregation and allocation. When only one calendar type is selected for a demand plan, all the data is translated to a single day. The leftover days will not be visible to the user and will be programmatically hidden.
Example 1
Assume that the following numbers are available in the Demand Planning Server. Also, assume the following levels: All products, All Geography, and All Organization. Booking History appears as:
| Date | Quantity | Date | Quantity | Date | Quantity |
|---|---|---|---|---|---|
| 30-Dec | 200 | 11-Jan | 200 | 23-Jan | 200 |
| 31-Dec | 300 | 12-Jan | 200 | 24-Jan | 200 |
| 1-Jan | 200 | 13-Jan | 200 | 25-Jan | 200 |
| 2-Jan | 300 | 14-Jan | 200 | 26-Jan | 200 |
| 3-Jan | 300 | 15-Jan | 200 | 27-Jan | 200 |
| 4-Jan | 100 | 16-Jan | 200 | 28-Jan | 200 |
| 5-Jan | 200 | 17-Jan | 200 | 29-Jan | 200 |
| 6-Jan | 200 | 18-Jan | 200 | 30-Jan | 200 |
| 7-Jan | 200 | 19-Jan | 200 | 31-Jan | 200 |
| 8-Jan | 200 | 20-Jan | 200 | 1-Feb | 200 |
| 9-Jan | 200 | 21-Jan | 200 | 2-Feb | 100 |
| 10-Jan | 200 | 22-Jan | 200 |
Assume that the lowest time level is selected as Fiscal Month for the Fiscal calendar type and Manufacturing Week for the Manufacturing calendar type. Also assume the definitions of the lowest time levels are:
| Manufacturing Weeks (Manufacturing Calendar) | Fiscal Month (Fiscal Calendar) |
|---|---|
| Week N-1 (30 Dec 01-5 Jan 02) | Dec (1 Dec 01 - 31 Dec 01) |
| Week N (6-12 Jan 02) | Jan (1 Jan 02 - 31 Jan 02) |
| Week N+1 (13-19 Jan 02) | Feb (1 Feb 02 - 28 Feb 02) |
| Week N+2 (20-26 Jan 02) | |
| Week N+3 (27 Jan-02 Feb 02) |
In this scenario, the following days will be left and all other days will be removed:
| Days left in the system | Quantity (assuming Sum aggregation method) |
|---|---|
| 31 Dec 01 | 500 |
| 5 Jan 02 | 1100 |
| 12 Jan 02 | 1400 |
| 19 Jan 02 | 1400 |
| 26 Jan 02 | 1400 |
| 31 Jan 02 | 1000 |
| 02 Feb 02 | 300 |
The data will be displayed in monthly buckets of the fiscal calendar:
| Fiscal Months (Fiscal Calendar) | Monthly Numbers |
|---|---|
| Dec 01 | 500 |
| Jan 02 | 6300 |
| Feb 02 | 300 |
The data will be displayed in weekly buckets of the manufacturing calendar:
| Manufacturing Weeks (Manufacturing Calendar) | Weekly Numbers (adding daily quantities) |
|---|---|
| Week N-1 (30 Dec 01-5 Jan 02) | 1600 |
| Week N (6-12 Jan 02) | 1400 |
| Week N+1 (13-19 Jan 02) | 1400 |
| Week N+2 (20-26 Jan 02) | 1400 |
| Week N+3 (27 Jan-02 Feb 02) | 1300 |
Example 2
Now assume that the Jan 02 number (6300) is changed by the planner to 12600. This change will be reflected as:
| Days left in the system | Quantity (assuming Sum aggregation method) |
|---|---|
| 31 Dec 01 | 500 |
| 5 Jan 02 | 12600 * 1100/6300 = 2200 |
| 12 Jan 02 | 12600 * 1400/6300 = 2800 |
| 19 Jan 02 | 12600 * 1400/6300 = 2800 |
| 26 Jan 02 | 12600 * 1400/6300 = 2800 |
| 31 Jan 02 | 12600 * 1000/6300 = 2000 |
| 02 Feb 02 | 300 |
The data will be displayed as weekly buckets of the manufacturing calendar:
| Manufacturing Weeks (Manufacturing Calendar) | Weekly Numbers (adding daily quantities) |
|---|---|
| Week N-1 (30 Dec 01-5 Jan 02) | 2700 |
| Week N (6-12 Jan 02) | 2800 |
| Week N+1 (13-19 Jan 02) | 2800 |
| Week N+2 (20-26 Jan 02) | 2800 |
| Week N+3 (27 Jan-02 Feb 02) | 2300 |
The user may specify different aggregation and allocation methods for different data streams. The aggregation method will be respected when aggregating data to a higher time bucket.
Example 3
In the example above, if the aggregation method had been Average the data for the truncated days would have been:
| Days left in the system | Quantity (assuming Average aggregation method) |
|---|---|
| 31 Dec 01 | 250 |
| 5 Jan 02 | 220 |
| 12 Jan 02 | 200 |
| 19 Jan 02 | 200 |
| 26 Jan 02 | 200 |
| 31 Jan 02 | 200 |
| 02 Feb 02 | 150 |
In the case of a chaotic data stream or when aggregation or allocation is not allowed, the data will not be aggregated or allocated. The data from the plan level lowest time bucket upwards would be displayed. If all the data in a chaotic data stream are in buckets lower than the lowest time levels, this would result in the loss of all the data for that stream.
Note: For two calendars that are of the same type, the lowest level would be shared. It is a requirement that the lowest level be identical for calendars of the same type.
Now, the next step is to associate hierarchies with each dimension in the demand plan. At least one hierarchy needs to be assigned for each of the dimensions. For example, for the Product dimension, you can choose the Product Family hierarchy or the Product Category hierarchy or both.
Hierarchies
This section describes demand plan hierarchies.
To define Demand Plan hierarchies:
-
Choose the Demand Plan System Administrator responsibility.
-
In the Navigator, choose Demand Plans.
The Demand Plan window appears.
-
Select DP Hierarchies to open the Demand Plan Hierarchies window.
-
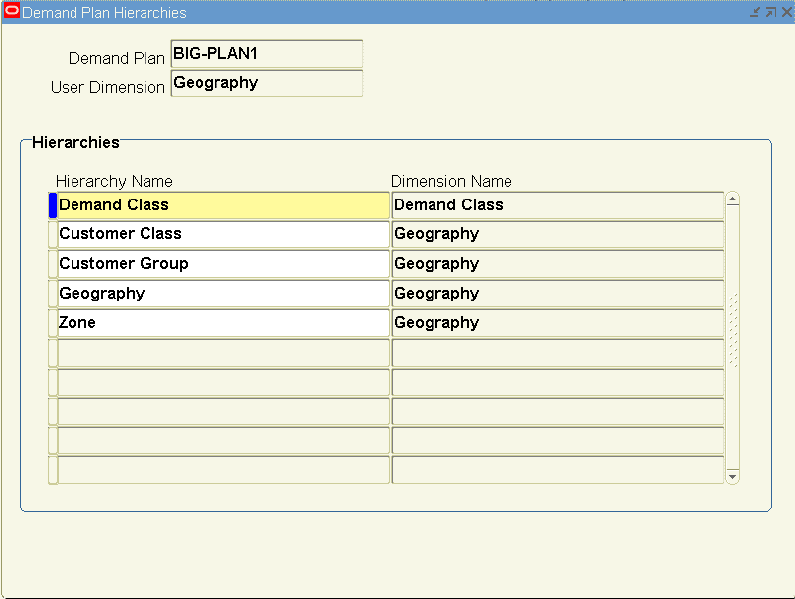
Select hierarchy names for the dimension. Use this window to associate hierarchies with a Demand Plan. You can select only the hierarchies that belong to the demand planning dimensions that are collapsed into the user dimensions for this Demand Plan.
In this example, hierarchy names are being associated with the geography user dimension for the Demand Plan.
-
Complete the fields in the Demand Plan Hierarchies window as follows:
Field Function Legal Values Demand Plan Demand Plan Name. VARCHAR2(30). User Dimension The User Dimension defined from the Demand Planning Dimensions for the Demand Plan. From selected dimension in the Oracle Demand Planning window. Hierarchy Name Name of the Hierarchy. List of Values. Dimension Name Demand Planning Dimension associated with the Hierarchy Name. Populated automatically.
The time hierarchies (calendar types) for the demand plan are restricted by the selection of lowest time levels. Multiple calendars can be selected for each calendar type. The system validation ensures that the definition of the lowest time level is same for all the selected calendars of the same type. For example, if the lowest time level for the manufacturing calendar type is Manufacturing Week, two calendars for the San Jose Organization and the Seattle Organization are selected as time hierarchies, and week 1 in San Jose Organization calendar is 1 Jan 02 to 7 Jan 02, then week 1 in Seattle Organization calendar should be from 1 Jan 02 to 7 Jan 02.
In Oracle Demand Planning, every enabled organization can have its own calendar. You can select to allocate data by workday patterns in the organization's calendar. You can use the Workday Allocation Weights data stream to store daily allocation weights based on workday patterns of organizations. For details, see: Input Parameters and To collect Calendars associated to Organizations:.
Input Parameters
Input Parameters determine the data that will be imported into Demand Planning Engine for creating and analyzing forecasts. Multiple inputs can be specified and used in different scenarios. The following input parameters are preseeded data streams:
| Input Parameter | Description |
|---|---|
| Manufacturing forecast | This data stream allows you to use the manufacturing forecast as a reference forecast for comparing to your statistical forecast. If a manufacturing forecast has been defined in the source in weekly buckets for a date range, the data is expanded to all the weeks in that date range by expanding the single row of data into multiple rows. This stream has its allocation set to Stream Dimension Levels. If you want to change the allocation floor to the lowest dimension level to allocate the data to a level lower than the data read-in levels, you should specify some other data stream as a basis for allocation. |
| Booking history - booked items | This data stream captures the sales history of items, which were actually booked (by substitution or directly). Cross-sell, up-sell, and substitution relationships between items can also be collected into demand planning. For details, see: Oracle Advanced Supply Chain Planning User's Guide. |
| Booking history | This data stream allows planners to capture the actual historical demand of items that were originally requested by the customer, regardless of whether they were substituted with another end item. |
| Shipment history - shipped items | This data stream captures the sales history of items, which were actually shipped. Cross-sell, up-sell, and substitution relationships between items can also be collected into demand planning. For details, see: Oracle Advanced Supply Chain Planning User's Guide. |
| Shipment history | This data stream allows planners to capture the actual historical demand of items that were originally requested by the customer, regardless of whether they were substituted with another end item. |
| Sales opportunities | This data stream shows the sales opportunity data. For details, see: Using Sales Forecasts and Opportunities. |
| Constrained forecast | In conjunction with supply plan, this data stream allow users to compare a unconstrained forecast to a constrained forecast. The constrained forecast represents a total picture of the satisfied demand, including sales orders that represent the portion of predicted demand that has already been realized, the consumed forecast that has been constrained, and the constrained estimate of shipments. The demand forecasts generated in Oracle Demand Planning are unconstrained, meaning the capacity constraints are not considered. The unconstrained demand forecasts are sent to Oracle Advanced Supply Chain Planning from where the resulting supply plan, constrained by material and resource availability, are sent back to Oracle Demand Planning for comparison. The comparative analysis feature enables planners to plan promotions and allocate demand across multiple organizations. To use this parameter, Oracle Demand Planning users must have access to Oracle Advanced Supply Chain Planning because the constrained forecasts are created there. Also, this data stream has its allocation set to Stream Dimension Levels. If you want to change the allocation floor to the lowest dimension level, you should specify some other data stream as a basis for allocation. For details, see: Oracle Advanced Planning and Scheduling Implementation and User's Guide. |
| Supply plan | In conjunction with constrained forecast, this data stream allows users to compare a unconstrained forecast to a supply plan. The supply plan represents the planned production to be compared to the forecast or planned demand. For details, see the description of the Constrained Forecast data stream (above). |
| Sales forecast - best case | This data stream provides a summary sales forecast. The best case sales forecast considers all the sales opportunities as 100% likely to close. For details, see: Oracle Sales Online User's Guide and Using Sales Forecasts and Opportunities. |
| Sales forecast - worst case | This data stream provides a summary sales forecast. The worst case sales forecast considers only the closed opportunities. For details, see: Oracle Sales Online User's Guide and Using Sales Forecasts and Opportunities. |
| Sales forecast - probable case | This data stream provides a summary sales forecast. The probable case sales forecast is a weighted calculation based on the open opportunities and their win probability. For details, see: Oracle Sales Online User's Guide and Using Sales Forecasts and Opportunities. |
| Sales forecast - pipeline | This data stream provides an aggregated total opportunity forecast using Sales Opportunity data collected into Oracle Demand Planning from Oracle Sales Online. The pipeline is the sum of all line items for an opportunity. For details, see: Oracle Sales Online User's Guide and Using Sales Forecasts and Opportunities. |
| Sales forecast - weighted pipeline | This data stream provides an aggregated opportunity forecast using Sales Opportunity data collected into Oracle Demand Planning from Oracle Sales Online. The weighted pipeline is the sum of the line items multiplied by the win probabilities. For details, see: Oracle Sales Online User's Guide and Using Sales Forecasts and Opportunities. |
| Sales forecast from customers | This data stream enables collaborative demand planning. The customer's sales forecasts are brought into Oracle Demand Planning via Oracle Collaborative Planning. Then the sales forecasts are compared to the Oracle Demand Planning forecasts to arrive at the final forecasts calculations that are used in planning operations. For details, see: Oracle Collaborative Planning Online Help. |
| Order forecast from customers | This data stream enables collaborative demand planning. The customer's order forecasts are brought into Oracle Demand Planning via Oracle Collaborative Planning. Then the order forecasts are compared to the Oracle Demand Planning forecasts to arrive at the final forecasts calculations that are used in planning operations. For details, see: Oracle Collaborative Planning Online Help. |
| Input scenarios | This data stream allows you to use the previous period forecasts from the same or different demand plan. It has its allocation set to Stream Dimension Levels. If you want to change the allocation floor to the lowest dimension level to allocate the data to levels lower than the data read-in levels, you should specify some other data stream as a basis for allocation. |
| Workday Allocation Weights | This data stream is used to specify different daily allocation weights for different organizations based on their workday patterns. The appropriate allocation weights are automatically populated in this data stream on the basis of the manufacturing calendars associated to the different organizations enabled in Oracle Demand Planning. For details, see: Lowest Time Levels for the demand plan. |
| Order Backlog | This data stream brings in backlog sales order amount and quantity data at the various dimension levels. The orders can be collected in an additive manner from Oracle Order Management. For details, see: To collect Order Backlog data:. |
| Material Requirements - Planned Maintenance | This data stream collects the material demand for routine maintenance from a unit maintenance plan in Oracle Complex Maintenance, Repair, and Overhaul. For details, see: To collect Material Requirements for Planned Maintenance:. |
| Material Requirements - Scheduled Visits | This data stream provides information on materials needed for a scheduled maintenance visit. For details, see: To collect Material Requirements for Scheduled Visits:. |
| Material Usage History - Planned Maintenance | This data stream collects historical material consumption associated with routine maintenance, and is used as a reference for comparisons. For details, see: To collect Material Usage History for Planned Maintenance:. |
| Material Usage History - Unplanned Maintenance | This data stream collects historical consumption of unplanned material associated with non-routine maintenance, and is used to forecast the material requirements for future non-routine maintenance. For details, see: To collect Material Usage History for Unplanned Maintenance:. |
| Service Parts - Return History | This data stream collects return history of defective service parts from Oracle Field Service. For details, see: To collect Service Parts Returns History:. |
| Service Parts - Usage History | This data stream collects the consumption history of service parts from Oracle Field Service and Oracle Depot Repair. For details, see: To collect Service Parts Usage History:. |
| Return History | This data stream collects product returns (return material authorizations) from Oracle Order Management. For details, see: To collect Return History:. |
| Promotional History | This data stream collects the promotional sales history from Oracle Order Management. This allows you to separately identify and net the incremental promotional sales from the regular sales to get the baseline sales history, which is then used as a basis to create a baseline statistical forecast. The incremental sales forecast due to planned promotions is added to the baseline forecast to arrive at the total sales forecast. The estimation of future promotional sales is purely judgmental. Promotions are set up as modifiers in Oracle Advanced Pricing. For details, see: the Oracle Advanced Pricing User's Guide. There are several types of modifiers in Oracle Advanced Pricing. Oracle Demand Planning brings promotional history pertaining to only the following modifier types:
Oracle Demand Planning does not collect the promotions themselves. These modifiers can be applied to the sales orders as well as to the order lines. For details, see: the Oracle Order Management User's Guide. Promotional History constitutes the entire quantity of any sales order line for which any of the above modifiers have been applied. |
| Historical Sales from Customers | This data stream collects customers' historical sales data from Oracle Collaborative Planning. At the outset of implementing a VMI program with your customers, and periodically thereafter, you may be able to receive customer sales history and use it to create the customer's sales forecast. This sales forecast can be published back to Oracle Collaborative Planning. Within Oracle Demand Planning, this sales forecast serves as one of the inputs to the consensus forecasting process. The data is collected by ship date. The customers' sale history must be pre-adjusted by the customer by the replenishment lead-time. Oracle Demand Planning and Oracle Collaborative Planning do not offset the ship dates to reflect the time it takes for you to ship the material to the customer site. |
Note that multiple dates are collected for some data streams. Specifically, Booking history and Booking history - booked items collect booked, promised, request, scheduled arrival, and scheduled ship date. Shipment history and Shipment history - shipped items collect booked, promised, request, scheduled arrival, scheduled ship date, and shipped date. Constrained forecast collects arrival and ship date. Order forecast from customers collects receipt and ship date. Order backlog collects booked, request, scheduled arrival, and scheduled ship date. Material usage history - planned maintenance and Material usage history - unplanned maintenance collect request and schedule date. You can select which of these dates to collect in the Demand Plan Input Parameters tab under the Forecast by field.
In addition, users can define any custom data stream and use it as an input parameter. If you want to specify demand priority for your scenarios, the demand priority information is defined in a custom stream, and needs to be listed as an input parameter. For details, see: About Flexible Data Streams.
The following table specifies the dimension levels at which the data is read-in for each seeded data stream. Some dimension levels in some of the data streams are kept flexible in which case the data can be read-in at any one dimension level.
To view this information, go to Setup > Data Streams > Defined - Advanced > Define Dimension and Levels window.
| Seeded Data Stream | Dimension | Level |
|---|---|---|
| Manufacturing forecast | Geography Product Sales Channel Ship from Location Time |
Ship To Location Item Sales Channel Organization Flexible |
| Booking history - booked items | Geography Product Sales Channel Sales Representative Ship from Location Time |
Ship To Location Item Sales Channel Sales Rep Organization Day |
| Booking history - requested items | Geography Product Sales Channel Sales Representative Ship from Location Time |
Ship To Location Item Sales Channel Sales Rep Organization Day |
| Shipment history - shipped items | Geography Product Sales Channel Sales Representative Ship from Location Time |
Ship To Location Item Sales Channel Sales Rep Organization Day |
| Shipment history - requested items | Geography Product Sales Channel Sales Representative Ship from Location Time |
Ship To Location Item Sales Channel Sales Rep Organization Day |
| Sales opportunities | Geography Product Sales Channel Sales Representative Ship from Location Time |
Ship To Location Item Sales Channel Sales Rep Organization Day |
| Constrained forecast | Geography Product Ship from Location Time |
Customer Item Organization Day |
| Supply plan | Geography Product Ship from Location Time |
All Geography Item Organization Day |
| Sales forecast - best case | Geography Product Sales Channel Sales Representative Ship from Location Time |
Flexible Flexible All Sales Channel All Sales Rep All Organization Flexible |
| Sales forecast - worst case | Geography Product Sales Channel Sales Representative Ship from Location Time |
Flexible Flexible All Sales Channel All Sales Rep All Organization Flexible |
| Sales forecast - probable case | Geography Product Sales Channel Sales Representative Ship from Location Time |
Flexible Flexible All Sales Channel All Sales Rep All Organization Flexible |
| Sales forecast - pipeline | Geography Product Sales Channel Sales Representative Ship from Location Time |
Flexible Flexible All Sales Channel All Sales Rep All Organization Flexible |
| Sales forecast - weighted pipeline | Geography Product Sales Channel Sales Representative Ship from Location Time |
Flexible Flexible All Sales Channel All Sales Rep All Organization Flexible |
| Customer sales forecast | Geography Product Ship from Location Time |
Ship To Item Organization Day |
| Customer order forecast | Geography Product Ship from Location Time |
Ship To Item Organization Day |
| Input scenarios | Geography Product Sales Channel Sales Representative Ship from Location Time |
Scenario output level Scenario output level Scenario output level Scenario output level Scenario output level Scenario output level |
| Workday Allocation Weights | Ship from Location Time |
Organization Day |
| Order Backlog | Geography Product Sales Channel Sales Representative Ship from Location Time |
Ship To Location Item Sales Channel Sales Rep Organization Day |
| Material Requirements - Planned Maintenance | Product Ship from Location Time |
Item All Organizations Day |
| Material Requirements - Scheduled Visits | Product Ship from Location Time |
Item Organization Day |
| Material Usage History - Planned Maintenance | Product Ship from Location Time |
Item Organization Day |
| Material Usage History - Unplanned Maintenance | Product Ship from Location Time |
Item Organization Day |
| Service Parts - Return History | Product Ship from Location Time Geography |
Item Flexible Flexible Flexible: customer, zone, or all geographies. |
| Service Parts - Usage History | Product Ship from Location Time Geography |
Item Flexible Flexible Flexible: customer, zone, or all geographies. |
| Return History | Product Sales Channel Sales Representative Ship from Location Time |
Item Sales Channel Sales Rep Organization Day |
| Promotional History | Demand Class Geography Product Sales Channel Sales Representative Ship from Location Time |
Demand Class Ship To Location Item Sales Channel Sales Rep Organization Day |
| Historical Sales from Customers | Geography Product Ship from Location Time |
Ship To Location Level Item Level Organization Level Day |
To define Input Parameters:
-
Choose the Demand Planning System Administrator responsibility.
-
In the Navigator, choose Demand Plans.
The Demand Plans window appears.
-
In the Demand Plans window, select the Input Parameters tab to open the Input Parameters window.
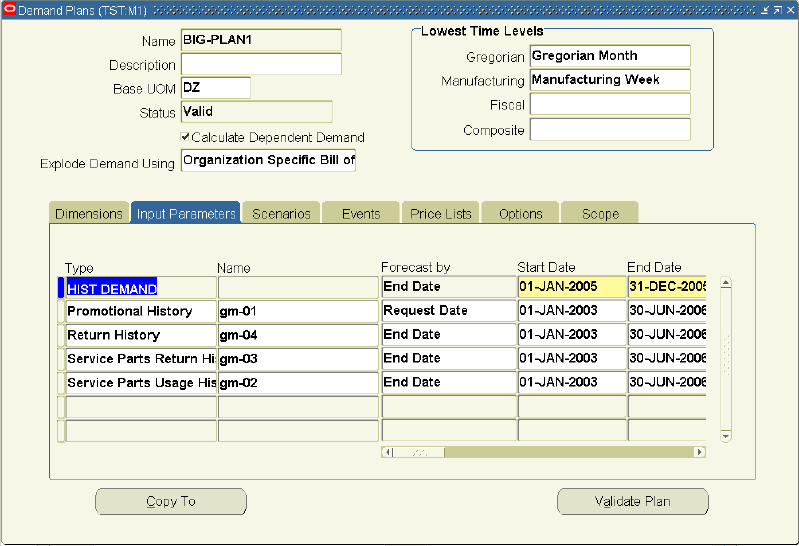
In the Input Parameters window you can specify a historical or future date range depending on the type of input parameter that needs to be uploaded into Demand Planning Engine.
-
Complete the fields in the Input Parameters window as follows:
Field Function Legal Values Type Type of Input Parameter. List of Values show all the preseeded and custom data streams. Name Name of the input parameter. For example, forecast name for the input manufacturing forecast, or the forecast name for the input scenario. VARCHAR2(240). Forecast by If there are multiple dates in the input parameter, select which one should be used. Specifically, the Booking history, Booking history - booked items, Shipment history, Shipment history - shipped items, Constrained forecast, Order forecast, Order backlog, Material usage history - planned maintenance, Material usage history - unplanned maintenance input parameters collect multiple dates. Different types of dates available for different input parameters. Types include: booked, promised, request, scheduled arrival, scheduled ship, shipped, receipt, ship, and schedule date.
Using arrival date gives you the ability to: view, analyze, and forecast data based on the scheduled arrival date. It incorporates delivery performance in the planning process. Also, it allows for the consumption of the forecast and plan supplies by scheduled arrival date in Oracle Advanced Supply Chain Planning.Start Date Start Date for the Input Parameter. DATE End Date End Date for the Input Parameter. DATE Input Demand Plan Name Applicable for input scenarios only when a forecast from some other demand plan is fed to this demand plan. The value that appears is based on what you select for the parameter name. Input Scenario Name Applicable for input scenarios only when a forecast based on some other scenario is fed to this demand plan. The value that appears is based on what you select for the parameter name. Quantity Used If there are multiple quantities in the input parameter, select which one should be used. This is especially relevant for the input manufacturing forecast. The list of values for the input manufacturing forecast are: 1. Original Quantity and 2. Current Quantity. Amount Used If there are multiple amounts in the input parameter, select which one should be used. If an input parameter has several amounts, all the values show up in the list of values. No seeded data stream has multiple amounts. Forecast Used This is specific only to the Input Scenario Name. This field is not used any more, and all the forecasts are treated as an Overridden forecast. Lookup Values: 1 = Overridden Forecast and 2 = Baseline Forecast. View Name This is an optional field for all the Input Parameters you can use to write your own view to filter and group the fact data so that only the relevant information is uploaded into the Demand Planning Engine. However, the View Name that you enter must have view structure similar to MSD_CS_DATA_V column. For details about the list of columns for MSD_CS_DATA_V, see: Control file. VARCHAR2(30). For custom fact views, the format should be similar to CS_DATA_V. Allocation / Aggregation Stream Type, Name, and Period These three fields are used to specify some other data stream as a basis of aggregation or allocation of data for the input parameter. Period is applicable for Average Weights allocation function. If the input parameter has been so specified as to base the allocation and aggregation values on another data stream, all the data streams show up in the list of values. For details, see: About Flexible Data Streams. Exclude from Rolling Cycle Differentiates static from dynamic input parameters. Dynamic input parameters refer to those data streams, which roll forward every cycle. Static input parameters refer to those data streams, which do not change from one cycle to another in a prespecified manner.
If checked, the demand plan dates are not rolled forward for the corresponding input parameter and scenario based on the selected input parameter.
If not checked and the "Roll demand plan dates forward to the next cycle" concurrent program is run, the following happens:-
Start and End date for input parameters are rolled forward by the specified number of periods.
-
History and horizon dates for the corresponding scenarios are rolled forward by the specified number of periods.
The demand plan and scenario names are retained, and only the forecast name (input scenarios is switched) is changed to the latest forecast version. For details, see: Automating the Planning Cycle.Checked or unchecked -
-
Save the demand plan.
Scenarios
Scenarios represent forecasts with a set of forecasting assumptions, such as 5% economic growth, a certain set of new product introductions, or the implementation of a promotion campaign. A Demand Plan can contain multiple scenarios for what-if simulations.
The output level of the scenario should reflect the level of detail required by the customer of your forecast.
To define Demand Plan scenarios:
-
Choose the Demand Plan System Administrator responsibility.
-
In the Navigator, choose Demand Plans.
The Demand Plans window appears.
-
In the Demand Plans window, select the Scenarios tab to open the Demand Plan Scenarios window.
-
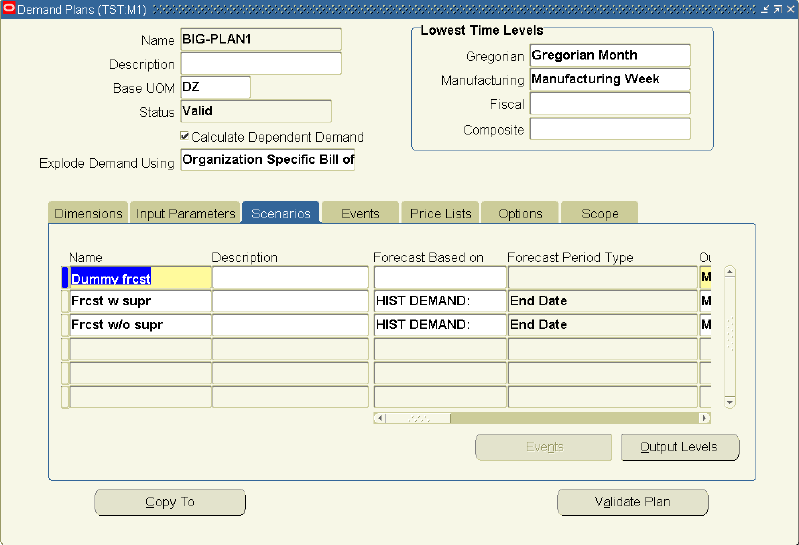
Use this window to define scenarios for a Demand Plan. Specify the following:
-
A scenario name,
-
The time level at which the forecast needs to be published back from Demand Planning Engine to the Planning Server,
-
The forecast horizon that is the time frame in which the forecast for this scenario needs to be generated,
-
Information about the type of history to be used for generating the forecast, and
-
The type of accuracy measure to be published with the forecast for this scenario from the Demand Planning Engine to the Demand Planning Server.
-
-
Complete the fields in the Scenarios window as follows:
Field Function Legal Values Name Scenario Name. VARCHAR2(30). Description Detailed description for the Scenario. VARCHAR2(240). Forecast Based On The input parameter used to generate the forecast for this Scenario. All the input parameters that have been defined earlier show up as list of values. Forecast Period Type This is the date used to generate the forecast for this Scenario. View only. This shows the date type selected for the input parameter selected in the Forecast Based On field. Output Period Type The time at which the Scenario will be published back from the planning engine to the server.
This type should be the same as or higher than the lowest time level selected.
Also, if the Publish box is checked, then you must choose Day or a manufacturing calendar bucket in output period. If you want to choose Fiscal Month or Gregorian Month as the output type, then you should first uncheck the Publish box.Lookup Values, depending on the demand plan calendars and the lowest time levels. History Start Date The Start Date of the historical data used for forecasting. DATE. History End Date The End Date of the historical data used for forecasting. DATE. Horizon Start The Start Date for the forecast for this Scenario. DATE. Horizon End The End Date for the forecast for this Scenario. DATE. Price List Any one price list can be selected for a scenario. You can simulate future revenue on the basis of different price lists. All the price lists that were brought into Oracle Demand Planning appear in the list of values. Accuracy Measure Choose between two calculations of forecast accuracy. The calculations are displayed at the level where the forecast is generated in the Demand Planning Engine. Lookup Values: MAD = mean absolute deviation, MAPE = mean absolute percentage error, and none. Demand Priority Scenario If you use any downstream applications that use Oracle Demand Planning output for planning purposes, specify the demand priority you want associated with this scenario. A custom stream must be set up with the demand priorities you want to use. After the custom stream is loaded and defined as the Demand Priority stream, you add the Demand Priority stream as an input parameter. You can specify demand priorities for item, demand class (optional) and time buckets.
See About Flexible Data Streams for more information about creating custom streams.
See Input Parameters for more information about adding the Demand Priority stream as an input parameter.Consume in Supply Plan Select if the forecast should be consumed in Oracle Advanced Supply Chain Planning. Unchecked or checked (default). Publish If checked, this option indicates that the scenario will be published back from the Oracle Demand Planning Server to the e-Business source instance. Unchecked or checked (default). The demand plan is accordingly validated later. Enable If checked, this option indicates that the scenario will be visible to Demand Planning Engine. Unchecked or checked (default). This must be checked to see the forecast for this scenario in the Demand Planning Engine. -
Open the Scenario Events window by selecting Events from the Demand Plan Scenario window.

-
Complete the fields in the Scenario Events window as follows:
Field Function Legal Values Scenario Scenario Name Lookup Values. This changes depending on what you selected in the Demand Plan Scenarios window. Event Name Demand Planning Event Lookup Values. Priority User assigned. It determines the order in which the events are applied. Number -
Open the Scenario Output Levels window by selecting Output Levels from the Demand Plan Scenario window.
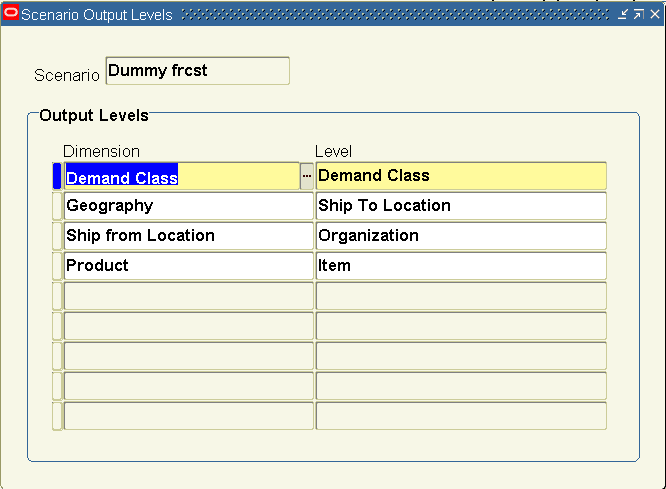
Use this window to define the various levels in the Demand Planning Dimensions at which the forecast for this scenario is to be published from Demand Planning Engine to the Planning Server, except for the time dimension.
If you want to consume your forecast by demand class in Oracle Advanced Supply Chain Planning, you must select Demand Class as a scenario output level for that scenario.
-
In this example, Level Demand Class in the Demand Class Dimension, Level Ship To Location in the Geography Dimension, Level Organization in the Ship from Location Dimension, and Level Item in the Product Dimension will be the level of detail published back to the Planning Server for this scenario.
-
Complete the fields in the Scenario Output Levels window as follows:
Field Function Legal Values Scenario Scenario Name Lookup Values. This changes depending on what you selected in the Demand Plan Scenarios window. Dimension Demand Planning Dimension Lookup Values. Level The Level associated to the Demand Planning Dimension at which the Scenario will be published back from the Planning Engine to the Server. Lookup Values.
A scenario will be available to Oracle Advanced Supply Chain Planning only if Output Levels are as follows:
| Dimension | Mandatory | Dimension Levels |
|---|---|---|
| Time | Yes | Day, Manufacturing Week, or Manufacturing Period |
| Product | Yes | Item or Product Family |
| Ship From Location | Yes, for Organization - for specific forecasts | Organization |
| No, for Global Forecasts | Organization or All organization, if included in demand plan | |
| Geography | No | Ship To Location, Customer, Customer Zone, Zone, or All Geography |
Events
Events, such as promotions, new product introductions, and product phase outs can be defined in the Demand Planning Server. For details, see: About Events. The events so defined can be associated with a demand plan in two ways:
-
From Events in the Demand Plan window, Scenarios tab. The events associated in this manner are applied to the forecast of the corresponding scenario. For details, see: Events.
-
From the Events tab on the Demand Plan Window. The events so associated to a demand plan are not applicable for a specific forecast scenario but appear as independent entities in Demand Planning Engine. A Demand Planning Administrator, Demand Planner, or Demand Plan Manager working in the Demand Planning Engine may later apply one or more of these events to any measure.
To associate events with Demand Plans:
-
Choose the Demand Plan System Administrator responsibility.
-
In the Navigator, select Demand Plans.
The Demand Plans window appears.
-
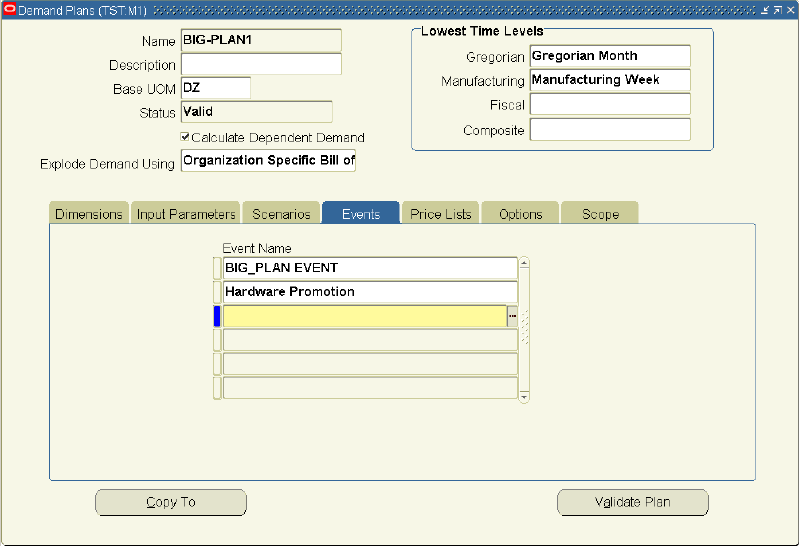
In the Demand Plans window, select the Events tab to open the Events window.
-
Select any number of events.
Price lists
Price lists are defined in the source instance and are brought over to the Demand Planning Server using the collection programs that are provided in Oracle Demand Planning. These price lists can be associated to a demand plan in two ways:
-
In the Price List field from the Scenarios tab by selecting from a list of the available price lists. The price list so associated is applied to the forecast of the corresponding scenario.
-
From the Price Lists tab on the Demand Plan Window. The price lists so associated to a demand plan are not applicable for a specific forecast scenario but appear as independent entities in Demand Planning Engine. The Demand Planning Administrator on the Demand Planning Engine side may later apply any one of these price lists to any forecast.
To associate price lists with a Demand Plan:
-
Choose the Demand Plan System Administrator responsibility.
-
In the Navigator, select Demand Plans.
The Demand Plans window appears.
-
In the Demand Plans window, choose the Price Lists tab to open the Price lists window.
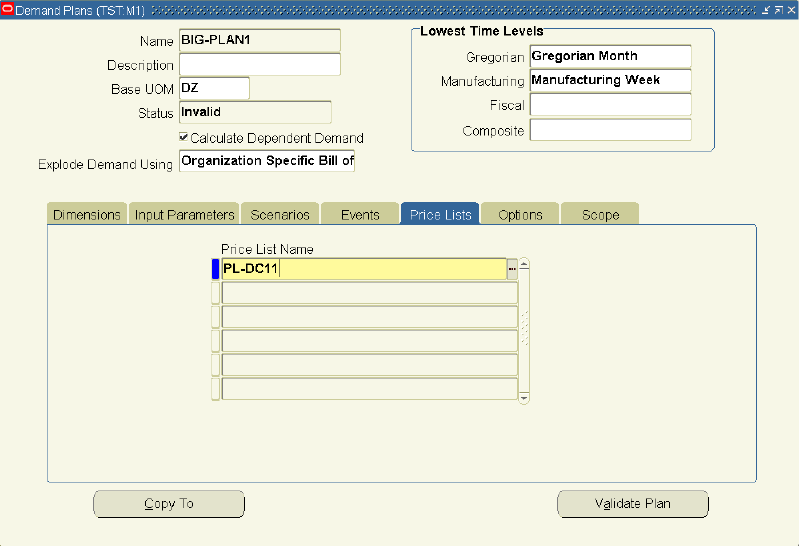
Note: It is mandatory to specify the Price List Name while defining a demand plan. You can use wildcard characters to find the Price List Name.
-
Select any number of price lists.
Options
Both quantity and amount forecast data can be uploaded from Oracle Demand Planning to the planning server for use by other Oracle applications. Oracle Demand Planning provides a threshold rounding value that can be defined in the demand plan definition form Options tab. The Demand Planning Engine does not writeback any forecast values that fall below the threshold rounding value.
You also specify the number of decimal places that you want the data to be rounded off to during the upload process.
Your specifications serve as the default display formatting settings in the Demand Planning Engine. By default, the system sets the threshold value to be 0.5 and the decimal round off factor to be 6 decimal places.
Oracle Demand Planing also provides the ability to accurately round fractional quantities to whole units. The fractional quantities, which are non-integer forecast numbers, are rounded by cumulating the fractional part of the demand across time buckets to one.
This helps in preventing under-forecasting and over-forecasting for: critical but slow moving service parts, low volume high cost products, and products with large units of measure.
After carefully considering the impact on the overall demand, you can use the rounding rule to cumulate fractions within a level in the product dimension, such as item, product family, and all products:
-
Item level: fractions for an item are not carried over to other items. Thus, the forecast for an item may theoretically increase by 1 and if there are 5000 SKUs, the overall demand may theoretically increase by 5000.
-
Product family level: fractions are adjusted across the member items of a product family and thus some demand (less than 1) may be stolen from one family member item to another. However, the forecast at the product family level will not increase by more than 1. If there are 50 product families for 5000 family members, the overall demand may theoretically increase by 50. Units of measure are not considered for rounding across items and it is assumed that all the family member items have the same unit of measure.
-
All products level: fractions are adjusted across all the items and thus some demand (less than 1) may be stolen from one item to another regardless of their units of measure. Though the overall forecast will not change, this may lead to moving the demand of 0.5 tons as 0.5 kilograms.
For details, see:Editing Measures about display formatting and Creating Formula Measures for how to specify rounding rules for measures.
To specify Rounding Control parameters:
-
Choose the Demand Plan System Administrator responsibility.
-
In the Navigator, choose Demand Plans.
The Demand Plans window appears.
-
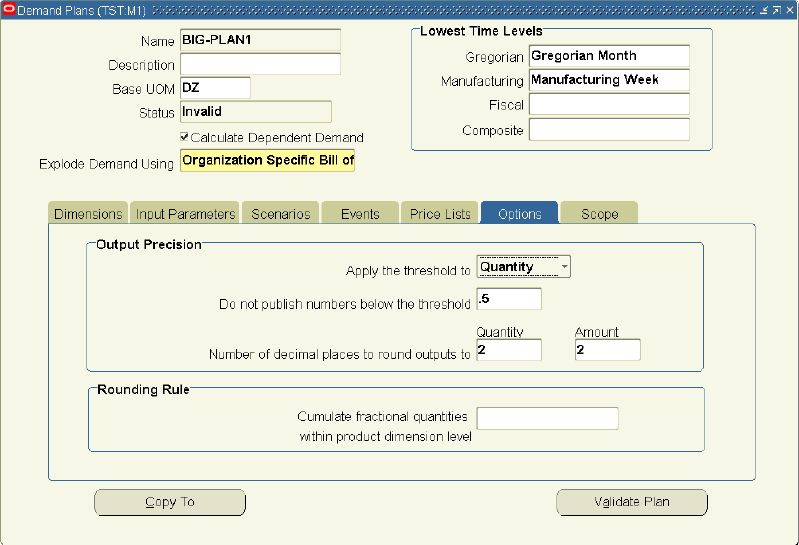
In the Demand Plans window, select the Options tab to open the Options window.
-
Complete the following in the Output Precision section:
-
From Apply the threshold to drop-down, select Quantity or Amount.
-
In Do not publish numbers below the threshold field, enter the threshold value.
-
Enter the decimal places value in the Quantity and/or Amount fields of the Number of decimal places to round outputs to.
-
-
Complete the following in the Rounding Rule section:
-
In the Cumulate fractional quantities within a product dimension level field, select the product dimension level within which the fractional quantities will be cumulated for rounding rule for the demand plan. The drop-down list of values varies depending on the product hierarchies included in the demand plan.
The demand plan level rounding level is applied to all the forecast scenarios and to the selected input parameters.
-
To select input parameters to round:
-
In the Demand Plans window, select the Input Parameters Tab.
-
On the desired input parameters, check the Apply Rounding Rule box.
The demand plan level rounding rule is applied to those input parameters for which the Apply Rounding Rule box is checked and by default to all the forecast scenarios specified under Scenarios tab.
Scope
You can specify the scope of a demand plan by restricting by the line of business. The demand plan is scoped by a level value in the ship from location dimension or product dimension. The levels and level values that available for selection are independent of the product or organization dimensions/hierarchies included in the demand plan.
You can also specify the scope of a demand plan by restricting to items based on the data stream. The demand plan is scoped by items in a data stream. The data streams that are available for selection are not limited to those which are included as demand plan input parameters.
For details about lines of business specific demand plans, see: Line of Business Specific Demand Plans.
To specify demand scope:
-
Choose the Demand Plan System Administrator responsibility.
-
In the Navigator, choose Demand Plans.
The Demand Plans window appears.
-
In the Demand Plans window, select the Scope tab to open the Scope window.
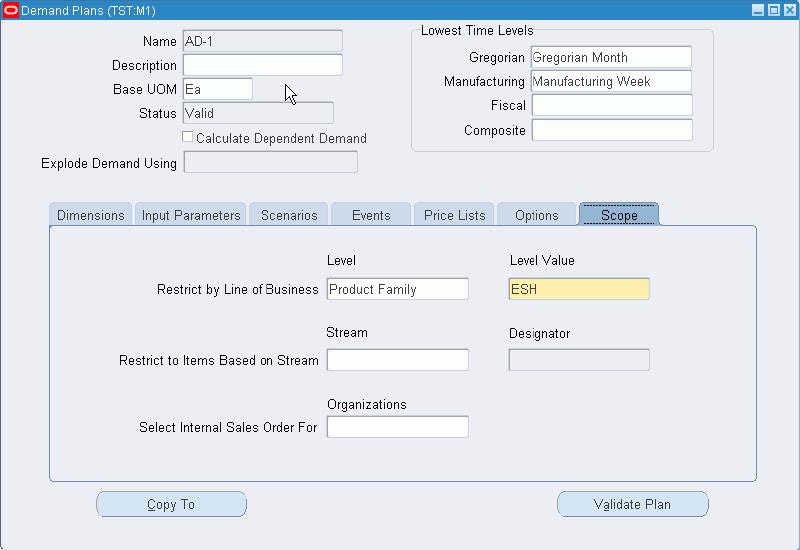
For more information about limiting the scope of a demand plan, see Line of Business-Specific Demand Plans.
Validate plan
You must validate a Demand Plan to ensure that it has been correctly defined. The plan validation process looks at the Dimensions, Hierarchies, Output levels, and other information that you have specified for the Demand Plan. Of special interest is the validation for the output levels, which are the levels at which the forecasts are uploaded to the Demand Planning Server from Demand Planning Engine. If the Publishable check box has been checked (inferring that the forecasts will ultimately be published back to the source instance) on the Input Parameters tab in the Demand Plans window, the validation process ensures the output levels to be:
-
Day for the Time Dimension, if Gregorian or Fiscal Calendars are used in Oracle Demand Planning. This restriction does not apply to the Manufacturing Calendar, for which all the levels are allowed.
-
Organization for the Ship From Location Dimension.
-
Product or Product Family for the Product Dimension.
However, if the Publishable check box is not checked, the validation process only ensures that the output levels have been defined for all the Demand Plan Dimensions. It is suggested to revalidate the demand plans after collecting fresh data.
To validate a Demand Plan:
-
Choose the Demand Plan System Administrator responsibility.
-
In the Navigator, select Demand Plans.
The Demand Plans window appears.
-
In the Demand Plans window, select Validate Plan.
A concurrent request is submitted.
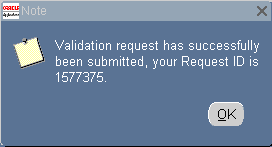
The concurrent request outcome can be checked as described in About Data Validation.