Analysis Workbench
This chapter describes the Analysis Workbench and how you can use it to analyze your inventory plans.
This chapter covers the following topics:
- Overview of Analysis Workbench
- Analyzing Inventory Plans
- Using the Analysis Workbench
- Creating and Editing Preference Sets
- Analyzing Service Level Versus Profit
- Analyzing Postponement
- Analyzing Safety Stocks
- Analyzing Inventory Budgets
- Analyzing Revenue and Cost Breakdown
- Analyzing Service Level Breakdown
Overview of Analysis Workbench
You create and run several inventory plans to evaluate different scenarios. You compare and analyze these plans to determine the most optimal one. Analysis Workbench enables you to compare and analyze multiple inventory plans by providing graphical and tabular comparison.
You can analyze the output from your inventory plans at both aggregate and detail levels. The Analysis Workbench provides context-sensitive drill down that enables root-cause analysis. For example, if achieving a specific service level costs an excessive amount of money, you can drill down to cost analysis for a break down of costs and identify the categories or items that contribute to the high costs.
You can use the Analysis Workbench to view and analyze factors such as budgets, inventory levels, and costs. In addition, you can use the Analysis Workbench to determine target service level. The following are some of the questions for which you can find answers using the Analysis Workbench:
-
What is my most profitable service level?
-
Have I achieved my target service levels?
-
How much inventory do I have to carry for a target service level?
-
Where should I position my inventories?
-
How is my inventory budget allocated?
-
What is my cost breakdown?
Note: The Analysis Workbench is displayed in a Web browser. For information on the Web browsers that you need for Analysis Workbench, see OA Framework Documentation.
Analyzing Inventory Plans
You can use the analysis pages to analyze the output of your inventory plans. The following analysis pages are available in the Analysis Workbench:
-
Service Level versus Profit Analysis
This page enables you to determine the estimated profit for a specific service level. You can use this page to analyze multiple plans corresponding to different service levels and identify the plan with the most profitable service level.
-
Postponement Analysis
This page enables you to view the effect of postponement on safety stock carrying cost and inventory value.
-
Safety Stock Analysis
This page enables you to analyze the safety stock levels. You can use this page to analyze the safety stock details for a specific service level.
-
Inventory Budget Analysis
This page enables you to analyze inventory budgets. You can analyze the budget value and the corresponding inventory value and service level details. You can use this page to determine the budget required to meet a specific service level.
-
Revenue and Cost Breakdown
This page enables you to view revenue and cost breakdown details such as production cost, carrying cost, and purchasing cost.
-
Service Level Breakdown
This page enables you to view the achievable service levels at various levels of aggregation.
You can view information related to a specific aspect of your inventory plan in an analysis page. For example, you can view the cost-related information such as planned production cost and planned purchasing cost in the Revenue and Cost Breakdown page. For a complete analysis of your inventory plans, you may need to use multiple analysis pages along with Planner Workbench.
The following is an example of how you may want to use the analysis pages for analyzing your inventory plans:
After you create and run plans with various target service levels, you may determine the most profitable service level using the Planned Service Level Vs Profit page.
-
You may then use the Inventory Budget Analysis page to find out the budget required to achieve the most profitable service level.
-
You may then determine the safety stock levels for the most profitable service level using the Safety Stock Analysis page.
-
You can then access the Planner Workbench for more information on factors such as item level supply and demand, the BOM structure, and sourcing.
Using the Analysis Workbench
The following are the steps involved in using the Analysis Workbench.
-
Run your inventory plans.
You need to run the plans that you want to analyze before you use the Analysis Workbench. For information on running inventory plans, see Running an Inventory Plan.
-
Select the category set in the Preferences window of the Planner Workbench.
To use the Analysis Workbench, you need to select the category set of the items that are to be displayed in the Analysis Workbench. You can specify the category set in the Category Set field of the Other tabbed region in the Preferences window. For more information on the Preferences window, see Oracle Advanced Planning Implementation and User's Guide. You can analyze only those categories and items belonging to the category set that you select in the Preferences window.
Note: You can analyze items and categories belonging to one category set at a time. The items and categories that appear in the analysis pages belong to an item category set defined in the Inventory Optimization Workbench preferences, Others tab.
-
Specify the number of decimal places in the Preferences window of the Planner Workbench.
Optionally, you can specify the required number of decimal places for the numerical data displayed in the Analysis Workbench. You can specify this in the Decimal Places field of the Material Plan tabbed region in the Preferences window. After you set the decimal places, numerical data is displayed with the specified number of decimal places in all the analysis pages. For more information on the Preferences window, see Oracle Advanced Planning Implementation and User's Guide.
-
Create your preference sets.
Optionally, you can create preference sets. Preference sets enable you to customize how information is displayed in an analysis page. For example, you can choose to hide or display the graphical display in an analysis page. For more information, see the section on creating and editing preference sets.
-
Navigate to the Analysis Workbench from the Navigator.
-
Select an analysis page based on your needs.
-
Search and select one or more plans for analysis.
You can select specific plans and navigate to other analysis pages for a complete analysis of the plans.
Note: You can analyze only plans that have matching start dates, weekly buckets, and period buckets.
The Search Criteria area in the analysis pages enables you to analyze specific elements of your inventory plans. For example, you can analyze the details of a specific organization in the plan. After you select the plans for analysis, you can search based on the following:
-
Organization
-
Category
-
Demand class
-
Period
-
Item
-
Customer
-
Customer class
-
ABC classification
The availability of fields for searching these parameters depends on the analysis page that you select. You can save a specific search criteria as the default for an analysis page by clicking Save As Default in the analysis page. The selected search criteria appear automatically every time you navigate to the analysis page.
-
-
Use the View By field to specify your view by preference. For example, you can view by period for a month-wise display of the details. The availability of this field depends on the analysis page that you select.
Creating and Editing Preference Sets
A preference set is a group of options that you specify for viewing information in the analysis pages. Preference sets enable you to specify how and what information you want to be displayed in an analysis page. For example, you can specify the row headings for the tabular display in the Inventory Budget Analysis page. You can create and edit preference sets using the Preferences pages.
You can create multiple preference sets for an analysis page. You can also make a preference set as the default for an analysis page so that the preference set is chosen automatically every time you navigate to that analysis page. The preference sets that you create for an analysis page are exclusive to that page. Depending on the analysis page, preference sets enable you to specify options such as the number of rows and columns for printing and the type of calendar for viewing information by period or week.
To create and edit preference sets
-
To create a preference set, click Click/Edit from an analysis page. To edit a preference set, select the preference set from the list in the Display using Preference Set field in the analysis page and click Click/Edit.
-
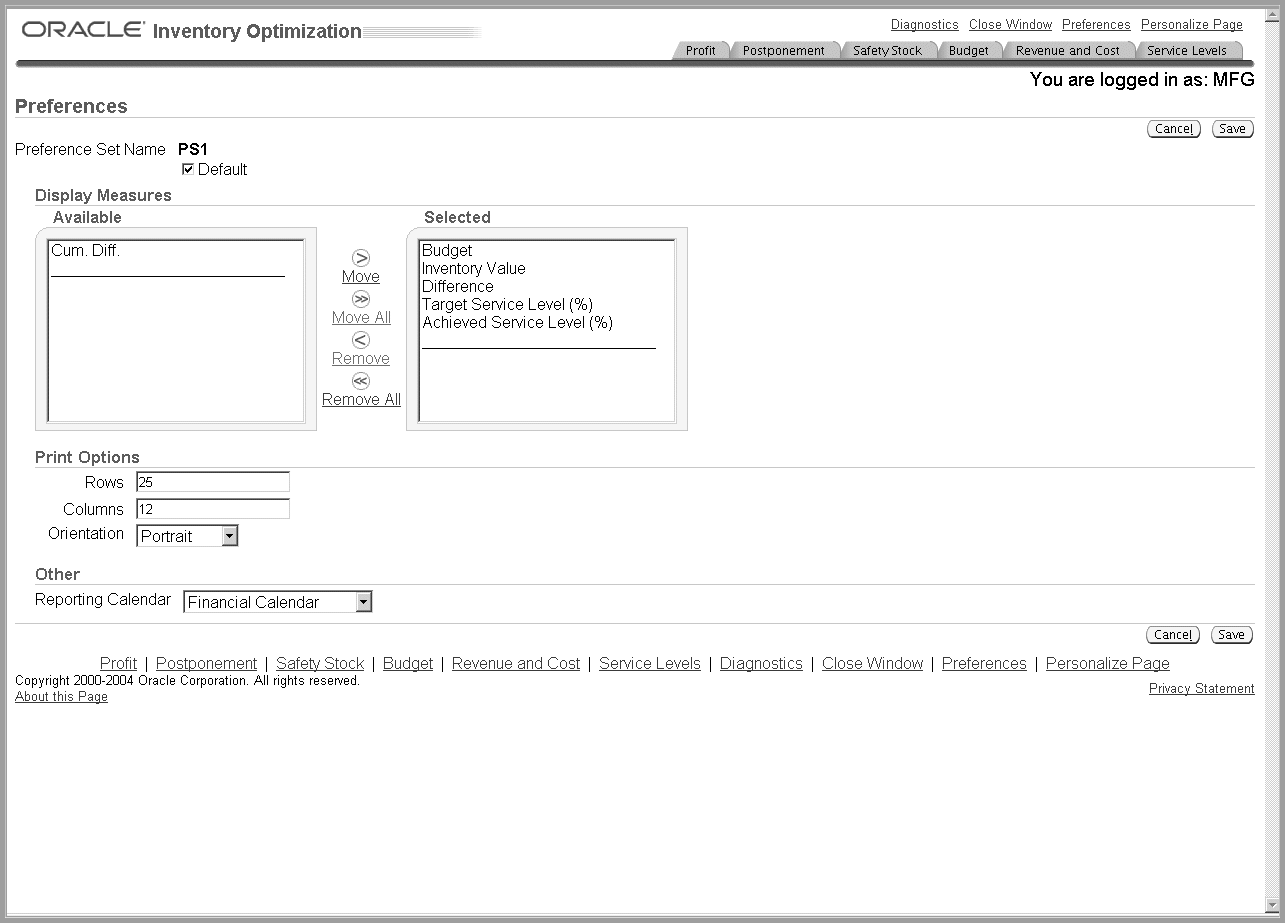
The corresponding Preferences page appears. The Preferences page of Inventory Budget Analysis is shown as an example.
Preferences page of Inventory Budget Analysis
-
-
Use the information in the following table to complete the fields in the Preferences pages.
Field Description Preference Set Name Enter a name for the preference set. Default Select this check box to make a preference set as the default for the analysis page. The settings are automatically applied when you navigate to this analysis page. Available This column displays the available row headings for the tabular display in the Safety Stock Analysis page or the Inventory Budget Analysis page. Select items in the list and move them to the Selected column to include them in the analysis page. Selected This column displays the selected row headings for the tabular display in the Safety Stock Analysis page or the Inventory Budget Analysis page. Select items in the list and move them to the Available column to remove them from the analysis page. Rows Specify the number of rows if you are printing the information in the analysis page. Columns Specify the number of columns if you are printing the information in the analysis page. Orientation Specify the page orientation if you are printing the information in the analysis page. Graphing Options You can choose to hide or display the graphical display in the analysis page. This is available for the following analysis pages:
Service Level versus Profit Analysis
Postponement Analysis
Safety Stock Analysis
Inventory Budget Analysis
Revenue and Cost Breakdown
Service Level BreakdownReporting Calendar You can select the type of calendar for viewing by period or week. To view by week, you need to select manufacturing calendar from the list. -
Click Save to save the preference set.
Analyzing Service Level Versus Profit
Service level is one of the factors that can affect your profit. Typically profits increase as you increase the service level, but increased service level beyond a certain point may not increase the profits because of the relative increase in inventory costs. To determine the most profitable service level, you can create and run multiple plans depicting different service levels. You can then analyze these plans using the Service Level versus Profit Analysis page of the Analysis Workbench to determine the most profitable service level.
You can also widen the scope of your analysis by navigating to other related analysis pages from the Service Level versus Profit Analysis page. You can navigate to other analysis pages the same search criteria specified in the Service Level versus Profit Analysis page. You can select the plans from the list and navigate to the following analysis pages from the Service Level versus Profit Analysis page:
-
Revenue and Cost Breakdown
-
Postponement Analysis
-
Inventory Budget Analysis
-
Service Level Breakdown
-
Safety Stock Analysis
Navigating to Other Related Analysis Pages

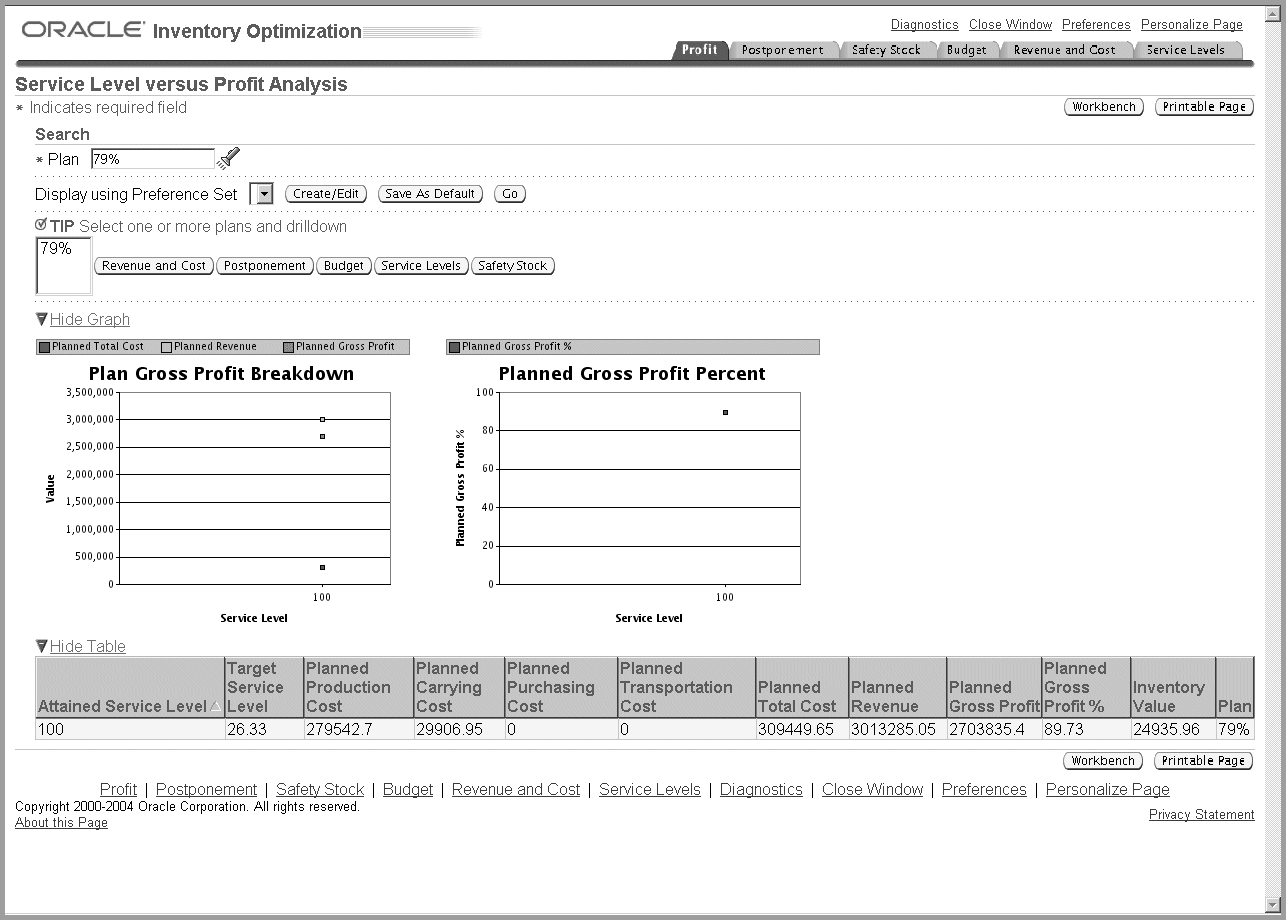
You can view service level versus profit details in both tabular and graphical formats. The Service Level versus Profit Analysis page provides two graphs, the Plan Gross Profit Breakdown graph and the Plan Gross Profit Percent graph. The Plan Gross Profit Breakdown graph shows the planned total cost, planned revenue, and planned gross profit against the service level for the selected inventory plans. The planned gross profit percent shows the planned gross profit percentage against the service level for the selected inventory plans.
To analyze service level versus profit
Steps
-
From the Navigator, choose Analysis Workbench.
The Service Level versus Profit Analysis page appears.
Service Level versus Profit Analysis page
-
Use the information in the following table to complete the fields in the Service Level versus Profit Analysis page.
Field Description Plan Select the inventory plans that you want to analyze.
To set the selected plans as the default plans to be analyzed in this page, click Save As Default. The selected plans appear automatically every time you navigate to this analysis page.Display using Preference Set Optionally, select a preference set from the list. For more information, see the section on creating and editing preference sets under Analyzing Inventory Plans. -
Click Go to analyze the selected inventory plans.
The inventory planning engine displays the service level versus profit details for the selected plans. The following table describes the column headings of the tabular display in the Service Level versus Profit Analysis page:
Column Heading Description Attained Service Level The achievable service level for a plan. The inventory planning engine calculates the attained service level based on the inputs for the plan. Target Service Level The target service level that you have set up. You can set the target service level for a plan in the Constraints tabbed region of the Plan Options window. For more information on setting target service levels, see Setting Target Service Levels. Planned Production Cost The estimated cost of producing the planned items. The inventory planning engine calculates the production cost for each item in the plan and aggregates the cost at the plan level.
The inventory planning engine calculates the planned production cost for an item by multiplying the resource unit cost and the required hours. The resource unit cost and required hours for items are specified in Oracle Bills of Material. For more information, see the Oracle Bills of Material User's Guide.Planned Carrying Cost The estimated cost of stocking the planned items. The inventory planning engine calculates the carrying cost for each item in the plan and aggregates the cost at the plan level.
The inventory planning engine calculates the carrying cost based on the carrying cost percentage. Carrying cost percentage can be set up at the item level using Oracle Inventory or at the profile option level. The carrying cost percentage set up at the item level takes precedence over the carrying cost percentage set up at the profile option level. For information on setting up carrying cost percentage at the item level, see Oracle Inventory User's Guide.Planned Purchasing Cost The estimated purchasing cost for the planned items. The inventory planning engine calculates the purchasing cost for each item in the plan and aggregates the cost at the plan level.
The inventory planning engine calculates the purchasing cost for an item based on its standard cost. The standard costs for items are specified in purchase orders of type blanket purchase agreement. These purchase orders are created in the Oracle Purchasing application. For more information, see Oracle Purchasing User's Guide.
The standard costs for items can also be specified in the Oracle Cost Management application. For more information, see Oracle Cost Management User's Guide. The standard costs specified in Oracle Purchasing takes precedence over the standard costs specified in Oracle Cost Management.Planned Transportation Cost The estimated cost for transporting the planned items from an organization to another. The inventory planning engine calculates the transportation cost for each item in the plan and aggregates the cost at the plan level. The inventory planning engine calculates the transportation cost for an item by multiplying the number of unit items supplied, unit weight or unit volume, and transportation cost per unit weight or unit volume.
The inventory planning engine calculates the number of units supplied based on the item's demand schedule. It takes the organization name from which the item is sourced and the organization name to which the item is supplied from the item's sourcing rule. It also takes the shipment method from the sourcing rule.
The inventory planning engine takes the unit weight or unit volume for the item and the cost of transporting an unit weight or unit volume of the item between the two organizations by the specified shipping method from Oracle Inventory.
Unit weight or unit volume for an item is specified in the Physical Attributes tabbed region of Master Items window or Organization Items window of Oracle Inventory. The cost of transporting a unit weight or unit volume between two organization using a specific shipping method is specified in the Transit window of Oracle Inventory.
For information on demand schedule, see the section on demand schedules in The Organizations Tabbed Region. For information on sourcing rules, see Oracle Advanced Planning Implementation and User's Guide. For information on transportation cost per unit weight or unit volume of an item, see Oracle Inventory User's Guide.Planned Total Cost The sum of planned production cost, planned carrying cost, planned purchasing cost, and planned transportation cost. Planned Revenue The estimated gross income for the plan from the sales of items that have an independent demand. The inventory planning engine calculates the revenue for each planned item that has an independent demand and aggregates the revenue at the plan level. The inventory planning engine calculates the revenue for an item by multiplying its selling price and the number of unit items supplied.
The selling price for an item is specified in the List Lines tabbed region in the Price Lists window of Oracle Order Management. For more information, see Oracle Order Management User's Guide.
The inventory planning engine calculates the number of units supplied based on the item's demand schedule. The demand schedule for an item is defined in the Organization tabbed region of the Plan Options window of Oracle Optimization. For information on demand schedule, see the section on demand schedules in The Organizations Tabbed Region.Planned Gross Profit The difference between the planned total cost and planned revenue for the plan. Planned Gross Profit% Planned gross profit divided by planned revenue and then multiplied by 100. Inventory Value The estimated value of inventory at the end of the planning horizon. The inventory planning engine calculates the inventory value for each item in the plan and aggregates the value at the plan level. The inventory planning engine calculates the inventory value for an item by multiplying its projected available balance and its standard cost.
You can view the projected available balance for items in the Horizontal Plan in Oracle Inventory Optimization. For more information see, Oracle Advanced Planning Implementation and User's Guide. The standard costs for items are specified in the Oracle Cost Management application. For more information, see Oracle Cost Management User's Guide.Plan The name of the plans that you have selected for analysis.
Analyzing Postponement
Postponement is the positioning of materials across the supply chain. When you implement postponement, the level of completion of products gets delayed until you have a firm order. This delays the value addition to the materials and thus reduces the cost of the inventory and the carrying cost.
The inventory planning engine determines postponement based on the costs and lead times. However, the maximum level of postponement in the supply chain BOM is based on the value you enter for Profile Options MSR: Postponement factor. For more information on this profile option, see MSR Profile Options. Set the value at 0 if you do not want to postpone.
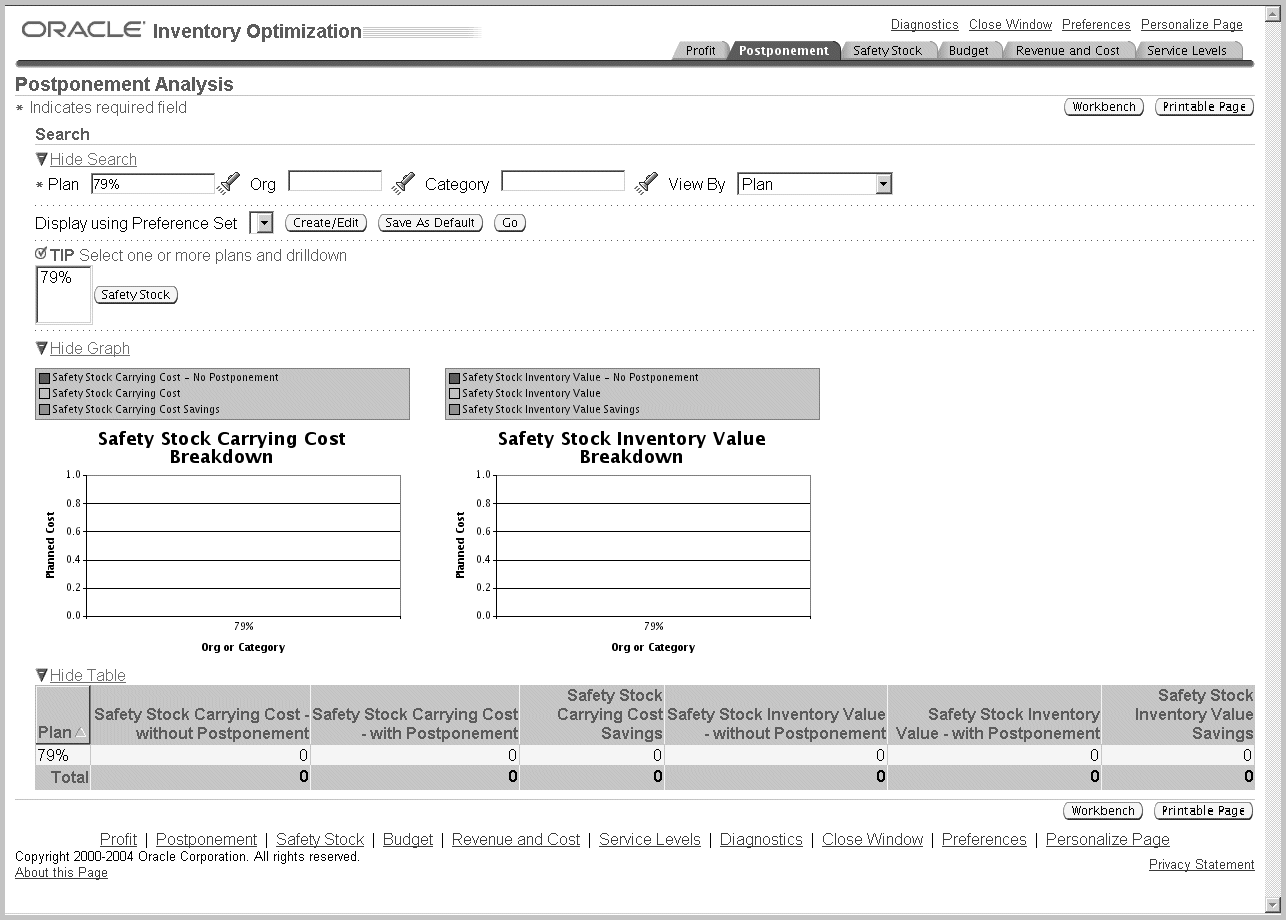
You can analyze the effects of postponement using the Postponement Analysis page. You can view the carrying cost and inventory value with and without postponement in both graphical and tabular formats. You can also view the savings made in carrying cost and inventory investment. The details displayed in the graphical and tabular formats are based on your search criteria. You can further drill down using the View By feature.
You can also select plans and navigate to the Safety Stock Analysis page to analyze the safety stock details. This provides an insight into how much of the planned items are stored in the finished goods stage. You can navigate to the Safety Stock Analysis page from the Postponement Analysis page to analyze the safety stock details for the same search criteria.
You can also navigate to the Planner Workbench from the Postponement Analysis page to review supply and demand records for specific items. You can also look up the BOM and sourcing to figure out such things as parent items and related items and further analyze safety stocks.
To analyze postponement implementation:
Navigating to the Postponement Analysis page
Steps
-
From the Analysis Workbench, click Postponement.
The Postponement Analysis page appears.
Postponement Analysis page
-
Use the information in the following table to complete the fields in the Postponement Analysis page:
Field Description Plan Search and select the inventory plans that you want to analyze.
Click Save As Default to make the details selected in the Search Criteria as default in this page. The selected search criteria appear automatically every time you navigate to this analysis page.Org Optionally, search and select an organization to analyze its postponement details. Category Optionally, search and select a category to analyze its postponement details. View By Select a view by to drill down. You can view by plan, organization, category, period, week, and plan-organization-category.
You can view month-wise postponement details for either the manufacturing calendar or financial calendar by selecting period from the list.
You can view week-wise postponement details only for the manufacturing calendar. You can select the type of calendar in the preference set created for the Postponement Analysis page.
For more information, see the section on creating and editing preference sets in Analyzing Inventory Plans.Display using Preference Set Optionally, select a preference set from the list. For more information, see the section on creating and editing preference sets in Analyzing Inventory Plans. -
Click Go to analyze the postponement implementation for the selected plans.
The inventory planning engine displays the postponement details for the selected plans. The following table describes the column headings of the tabular display in the Postponement Analysis page:
Column Heading Description Plan The name of the plans that you have selected for analysis. Org The organizations in the selected plans whose postponement details are displayed. This column appears if you are viewing by organization or plan-organization-category. Category The categories in the selected plans whose postponement details are displayed. This column appears if you are viewing by category or plan-organization-category. Time The bucket for which the postponement details are displayed. This column appears if you are viewing by period or week. Safety Stock Carrying Cost - without Postponement The carrying cost for the safety stock without considering postponement. The inventory planning engine calculates the carrying cost based on the carrying cost percentage. You can set the carrying cost percentage at the item level or using a profile option. The carrying cost percentage set at the item level takes precedence over the carrying cost set using profile option. For more information on setting carrying cost percentage at the item level, see Oracle Inventory User's Guide. Safety Stock Carrying Cost - with Postponement The carrying cost for the safety stock considering postponement. Safety Stock Carrying Cost Savings The amount of money saved in carrying cost by implementing postponement. The inventory planning engine calculates this by subtracting the safety stock carrying cost with postponement from safety stock carrying cost without postponement. Safety Stock Inventory Value-without Postponement The value of the safety stock without postponement. The inventory planning engine calculates the value of safety stock for an item by multiplying the item's projected available balance and standard cost.
You can view the projected available balance for items in the Horizontal Plan in Oracle Inventory Optimization. For more information see, Oracle Advanced Planning Implementation and User's Guide. The standard costs for items are specified in the Oracle Cost Management application. For more information, see Oracle Cost Management User's Guide.Safety Stock Inventory Value-with Postponement The value of the safety stock considering postponement. Safety Stock Inventory Value Savings The amount of money that can be saved by implementing postponement. The inventory planning engine calculates this by subtracting the safety stock inventory value with postponement from the safety stock inventory value without postponement.
Analyzing Safety Stocks
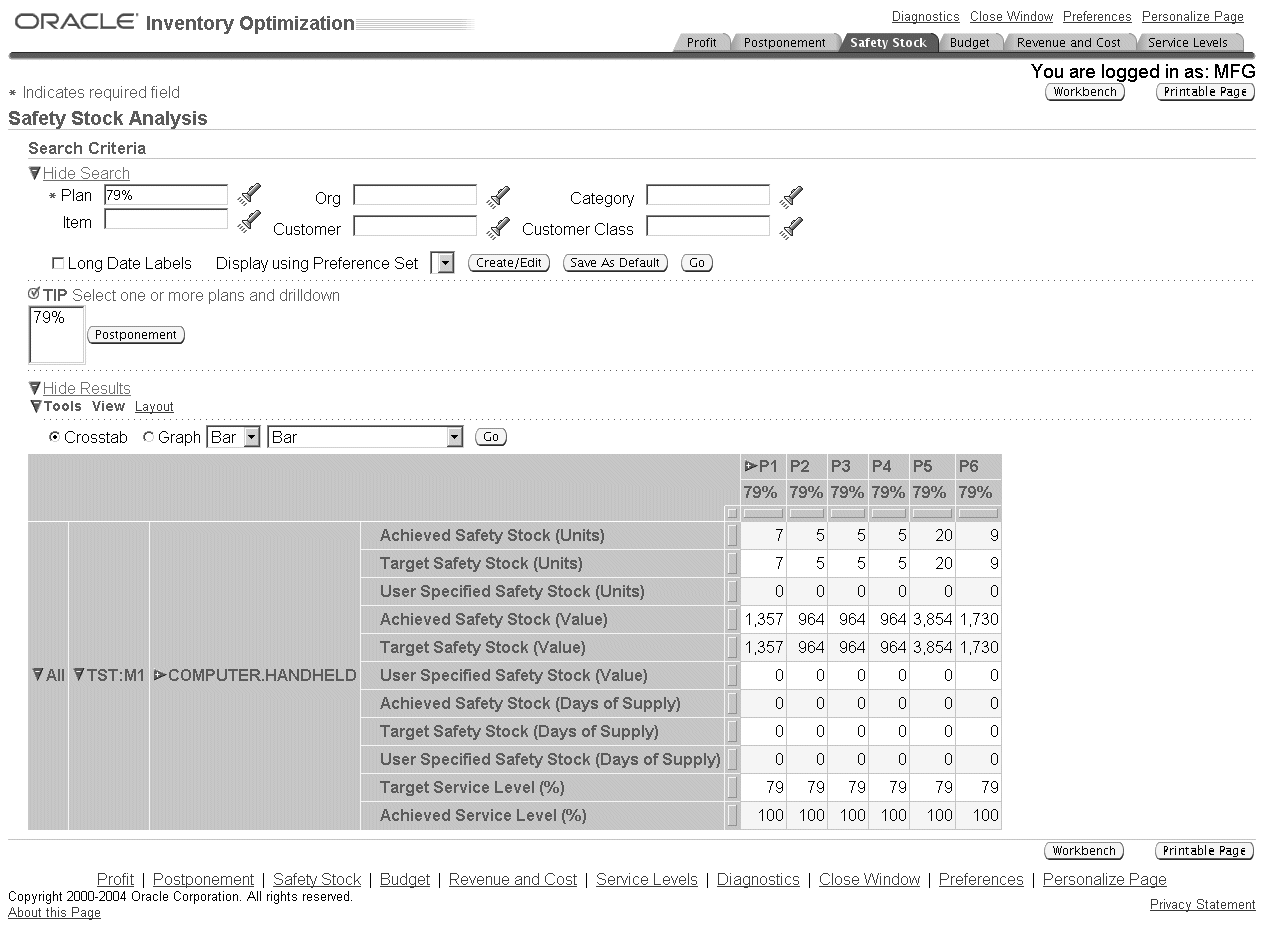
Safety stocks act as a buffer against unforeseen fluctuations in demand. The inventory planning engine calculates the achievable and target safety stocks for an inventory plan based on the plan inputs. You can use the Analysis Workbench to analyze and view the safety stocks at the aggregate and detail levels. Analysis of safety stocks helps you verify if specific items, item categories, and customers are adequately buffered against uncertainty in demand and supply.
You can analyze the safety stocks of multiple plans using the Safety Stock Analysis page. You can view the achievable, target, and user-specified safety stocks in units, value, and days of supply. The Safety Stock Analysis page also enables you to analyze the corresponding target and achievable service levels. This provides an insight into the effect of service levels on safety stock levels.
The Safety Stock folder in the analysis workbench displays the percent (%) contribution from each source of variability (demand, manufacturing lead time, in-transit lead time and supplier lead time variability) to the safety stock.
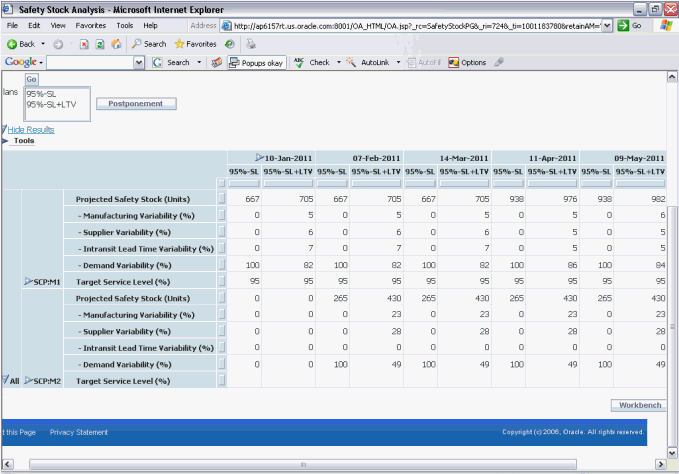
The inventory planning engine can suggest postponement for your plans so that the safety stocks are stored at lower levels of the supply chain BOM. You can navigate to the Postponement Analysis page from the Safety Stock Analysis page to analyze the postponement details for the same search criteria. To analyze the postponement details for the same search criteria specified in the Safety Stock Analysis page, select the inventory plans from the list and click Postponement.
Navigating to the Safety Stock Analysis page

You can view time-phased safety stock and service level details of your inventory plans in both tabular and graphical formats in the Safety Stock Analysis page. You can specify the details that you want to be displayed in this page using the preference sets that you have created for the Safety Stock Analysis page. You can specify these details under Display Measures in the Preferences page of the Analysis Workbench. For more information, see the section on creating and editing preference sets in Analyzing Inventory Plans. The details displayed in the tabular and graphical formats are also based on your search criteria. You can further drill down using the View By feature.
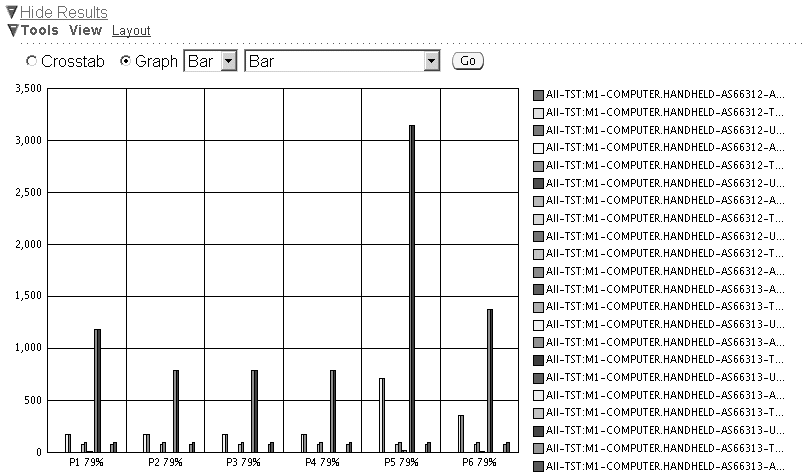
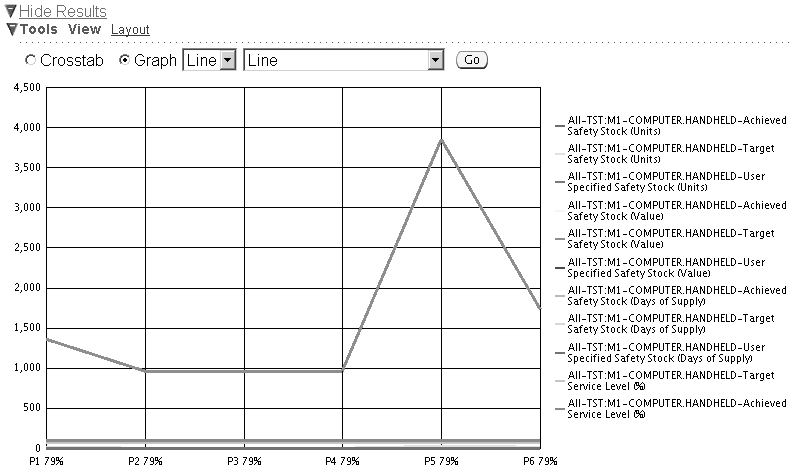
The inventory planning engine displays the safety stock and service level details in bar graph format and in the line graph format. You can also choose the type of bar or line graph such as dual-Y, split dual-Y, and stack.
Safety stock analysis in the bar graph format
Safety stock analysis in the line graph format
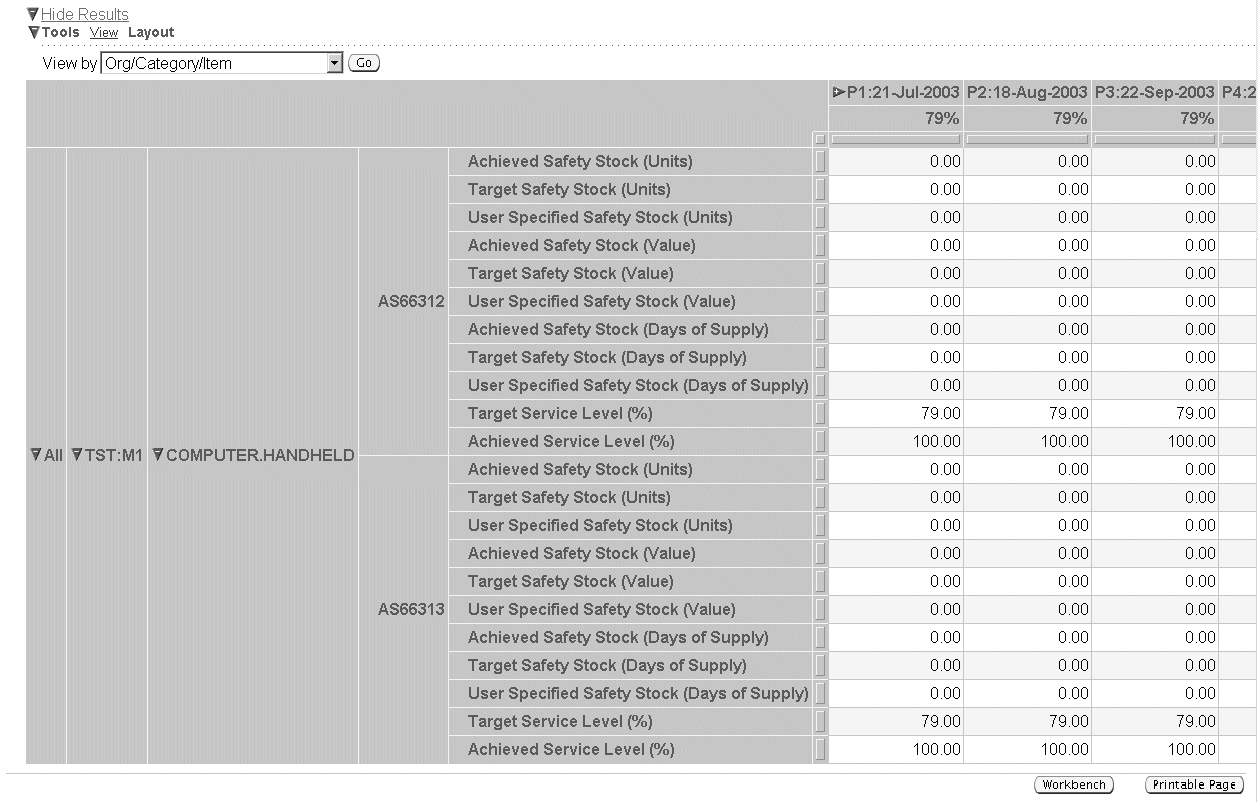
You can use the Layout link and the View By field for drilling down in the tabular display. For example if you choose Org/Category/Item in the View By field, then you can drill down from the organization level to the category level and then to the item level as shown in the following figure.
Drilling down in the tabular display
To analyze safety stocks:
Steps
-
From the Analysis Workbench, click Safety Stock.
The Safety Stock Analysis page appears.
Safety Stock Analysis page
-
Use the information in the following table to complete the fields in the Safety Stock Analysis page:
Field Description Plan Search and select the inventory plans that you want to analyze.
Click Save As Default to make the details selected in the Search Criteria as default in this page. The selected search criteria appear automatically every time you navigate to this analysis page.Org Optionally, search and select an organization to analyze its safety stocks. Category Optionally, search and select a category to analyze its safety stocks. Item Optionally, search and select an item to analyze its safety stocks. Customer Optionally, search and select a customer to analyze the customer's safety stocks. Customer Class Optionally, search and select a customer class to analyze its safety stocks. Long Date Labels Select this check box to the display the starting date of the periods in the tabular and graphical displays. Display using Preference Set Optionally, select a preference set from the list. For more information, see the section on creating and editing preference sets in Analyzing Inventory Plans. You can specify the safety stock and service level details that you want to view when you create the preference sets for Safety Stock Analysis page. Crosstab To view this option, click the View link. Select this option to view the safety stock details in the tabular format. Graph To view this option, click the View link. Select this option to view the safety stock details in the graphical format. You can also specify the type of graph. View By To view this field, click the Layout link. Select a view by from the list to drill down in the tabular format. -
Click Go to analyze the safety stocks for the selected plans.
The inventory planning engine displays the safety stock details for the selected plans in the tabular or graphical format based on your selection. The following table describes the row headings of the tabular display in the Safety Stock Analysis page:
Row Heading Description Achieved Safety Stocks (Units) The achievable safety stock level in number of units calculated by the inventory planning engine. The inventory planning engine calculates this value based on the plan inputs. Target Safety Stocks (Units) The safety stock level in number of units recommended by the inventory planning engine to meet a specific service level. For more information on target safety stocks, see Safety Stock and Target Safety Stock. User Specified Safety Stock (Units) The safety stock level in number of units specified by you. The user specified safety stock level overrides the target safety stock level. You can specify this value in Safety Stock window in the Planner Workbench. For more information, see User-Specified Safety Stock. Achieved Safety Stocks (Value) The currency value of the achievable safety stock level. The inventory planning engine calculates this value by multiplying the number of unit items in the achievable safety stock and the standard cost of an item.
The standard costs for items are specified in the Oracle Cost Management application. For more information, see Oracle Cost Management User's Guide.Target Safety Stocks (Value) The currency value of the target safety stock level. The inventory planning engine calculates this value by multiplying the number of unit items in the target safety stock and the standard cost of an item.
The standard costs for items are specified in the Oracle Cost Management application. For more information, see Oracle Cost Management User's Guide.User Specified Safety Stock (Value) The currency value of the user specified safety stock level. The inventory planning engine calculates this value by multiplying the number of unit items in the user specified safety stock and the standard cost of an item.
The standard costs for items are specified in the Oracle Cost Management application. For more information, see Oracle Cost Management User's Guide.Achieved Safety Stocks (Days of Supply) The number of days for which the achievable safety stock level can meet the demand. For information how the inventory planning engine calculates the days of supply, see Safety Stock Level Days of Supply. Target Safety Stocks (Days of Supply) The number of days for which the target safety stock level can meet the demand. For information on how the inventory planning engine calculates the days of supply, see Safety Stock Level Days of Supply. User Specified Safety Stock (Days of Supply) The number of days for which the user specified safety stock level can meet the demand. For information how the inventory planning engine calculates the days of supply, see Safety Stock Level Days of Supply. Achieved Service Level (%) The achievable service level for a plan. The inventory planning engine calculates the attained service level based on the inputs for the plan. Target Service Level (%) The target service level that you have set. You can set the target service level at various levels such as plan, organization, and item. For more information on setting target service levels, see Setting Target Service Levels.
Analyzing Inventory Budgets
Inventory budget is the maximum amount to be spent on inventory during a planning period. You can analyze your inventory plans to ensure that the budget has been allocated in the best way possible to achieve the desired service levels and profits. You can also verify if adequate budgets have been allocated to specific organizations and item categories. Analysis of your inventory budgets also enables you to know the corresponding inventory value for a budget amount.
Note: You can use the Planner Workbench to analyze budgets at the item level.
You can analyze the budgets and the corresponding inventory value and service level details of multiple plans using the Inventory Budget Analysis page. You can view these details in a time-phased format both on a monthly and weekly basis.
You can also widen the scope of your budget analysis by navigating to other related pages from the Inventory Budget Analysis page. This enables you to analyze the selected plans with the same search criteria specified in the Inventory Budget Analysis page. You can select the plans from the list and navigate to the following analysis pages from the Inventory Budget Analysis page:
-
Revenue and Cost Breakdown
-
Service Level Breakdown
-
Service Level versus Profit Analysis
-
Safety Stock Analysis
Navigating to other related analysis pages

You can view time-phased inventory budget details of your inventory plans in both tabular and graphical formats. You can specify the details that you want to be displayed using the preference sets that you have created for the Inventory Budget Analysis page. You can specify these details under Display Measures in the Preferences page of the Inventory Budget Analysis page. You can also choose the type of calendar, manufacturing or financial, in the preferences set. For more information, see the section on creating and editing preference sets in Analyzing Inventory Plans. The details displayed in the tabular and graphical formats are also based on your search criteria. You can further drill down using the View By feature.
The inventory planning engine displays the budget details in the bar graph format and in the line graph format. You can also choose the type of bar or line graph such as dual-Y, split dual-Y, and stack.
You can use the View By field for drilling down in the tabular display. For example if you choose Category/Org/Plan in the View By field, then you can drill down from the category level to the organization level and then to the plan level.
To analyze inventory budgets:
Steps
-
From the Analysis Workbench, click Budget.
The Inventory Budget Analysis page appears.
-
Use the information in the following table to complete the fields in the Inventory Budget Analysis page:
Field Description Plan Search and select the inventory plans that you want to analyze.
Click Save As Default to make the details selected in the Search Criteria as default in this page. The selected search criteria appear automatically every time you navigate to this analysis page.Org Optionally, search and select an organization to analyze its inventory budget. Category Optionally, search and select a category to analyze its inventory budget. Item Optionally, search and select an item to analyze its inventory budget. ABC Class Optionally, search and select an ABC Class to analyze its inventory budget. Long Date Labels Select this check box to the display the starting date of the periods in the tabular and graphical displays. Display using Preference Set Optionally, select a preference set from the list. For more information, see the section on creating and editing preference sets in Analyzing Inventory Plans. You can specify the budget details that you want to be displayed using the preference sets. You can also choose the type of calendar for the tabular and graphical displays using the preference sets. Crosstab To view this option, click the View link. Select this option to view the safety stock details in the tabular format. Graph To view this option, click the View link. Select this option to view the safety stock details in the graphical format. You can also specify the type of graph. View By To view this field, click the Layout link. Select a view by to drill down in the tabular format. -
Click Go to analyze the inventory budgets for the selected plans.
The inventory planning engine displays the budget details for the selected plans in the tabular or graphical format based on your selection.
The following table describes the row headings of the tabular display:
Row Heading Description Budget The allocated budget for a plan. The budget value can be specified in the Constraints tabbed region of Plan Options window or in the Specify Budget window. For more information on budgets, see Defining Budgets. Inventory Value The estimated value of inventory at the end of each planned bucket. The inventory planning engine calculates the inventory value for each item in the plan and aggregates the value at the category, organization, and plan level. The inventory planning engine calculates the inventory value for an item by multiplying its projected available balance and its standard cost.
You can view the projected available balance for items in the Horizontal Plan in Oracle Inventory Optimization. For more information see, Oracle Advanced Planning Implementation and User's Guide. The standard costs for items are specified in the Oracle Cost Management application. For more information, see Oracle Cost Management User's Guide.Difference The difference between the budget amount and the inventory value amount. The inventory planning engine calculates this difference by subtracting the inventory value from the budget. Cum. Diff. The collective difference between the budget amount and the inventory value. The inventory planning engine calculates the cumulative difference by adding the difference amount from the previous columns in the tabular display. Target Service Level (%) The target service level that you have set for a plan. You can set the target service level for a plan in the Constraints tabbed region of the Plan Options window. For more information on setting target service levels, see Setting Target Service Levels. Achieved Service Level (%) The achievable service level for a plan. The inventory planning engine calculates the achieved service level based on the inputs for the plan.
Analyzing Revenue and Cost Breakdown
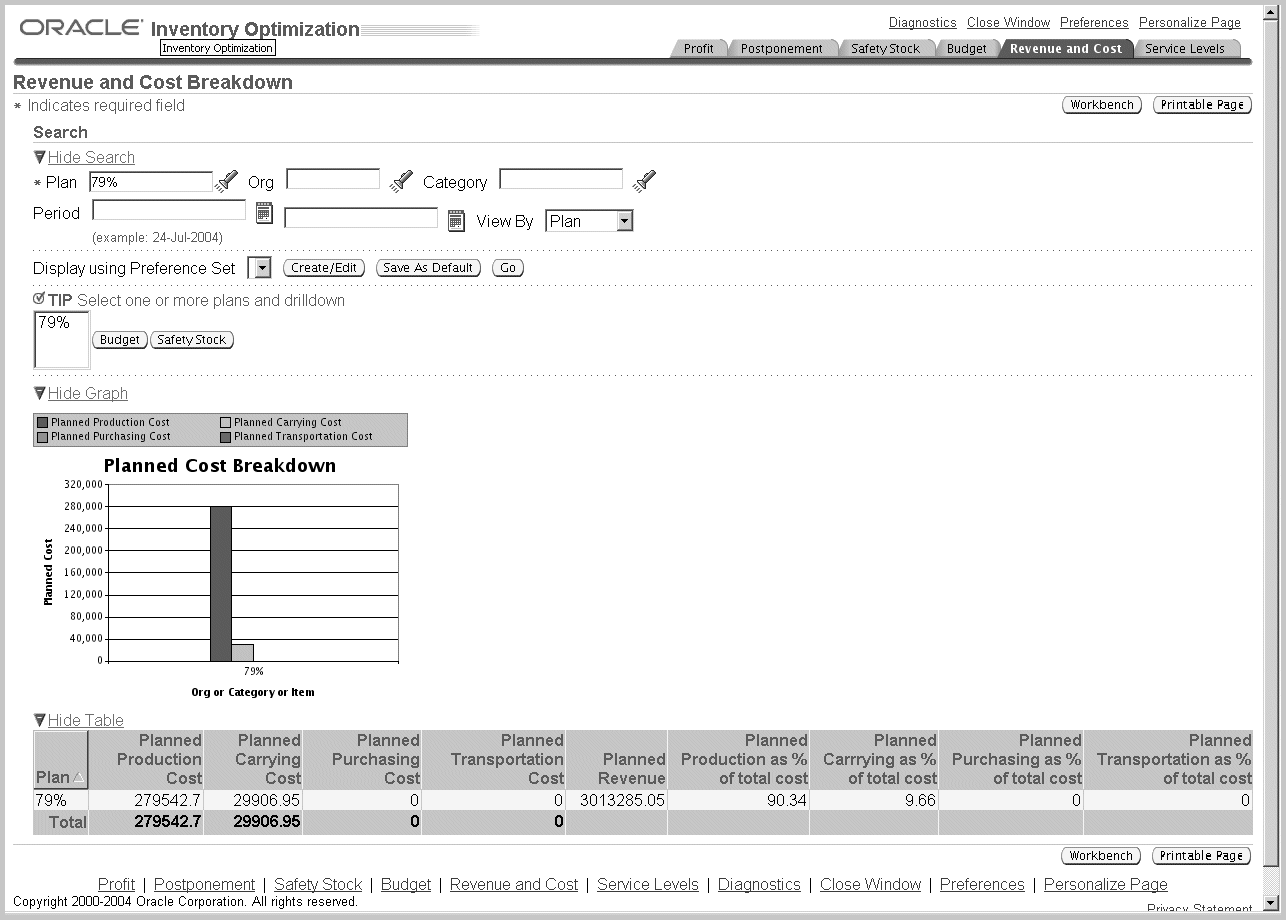
There is a cost involved in achieving the service levels and safety stocks that you specify in your inventory plans. To determine the most profitable inventory plan, you need to know the cost that can be incurred and the revenue that can be generated by implementing a plan. You can analyze the cost and revenue details of your inventory plans using the Revenue and Cost Breakdown page. This analysis helps you identify how the allocated budget will be spent and how much revenue can be generated by implementing an inventory plan. This analysis helps you identify the most profitable organizations, item categories, and items in your inventory plan. This analysis also enables root cause analysis. For example, if achieving a specific service level costs an excessive amount of money, you can drill down to the categories or items contributing to the high costs using the Revenue and Cost Breakdown page.
The Revenue and Cost Breakdown page enables you to view the revenue and cost breakdown in both the tabular and graphical formats. The details displayed in these formats are based on your search criteria. You can further drill down using the View By feature. The graphical format shows the planned cost against an organization, category, or item in the plan.
You can also widen the scope of your analysis by navigating to other related pages from the Revenue and Cost Breakdown page. This enables you to analyze the selected plans with the same search criteria specified in the Inventory Budget Analysis page. You can select the plans from the list and navigate to the following analysis pages from the Revenue and Cost Breakdown page:
-
Inventory Budget Analysis
-
Safety Stock Analysis
Navigating to other related analysis pages

You can also navigate to the Planner Workbench from the Revenue and Cost Breakdown page by clicking Workbench to view supply and demand information along with sourcing and BOM information.
To analyze revenue and cost breakdown
Steps
-
From the Analysis Workbench, click Revenue and Cost.
The Revenue and Cost Breakdown page appears.
Revenue and Cost Breakdown page
-
Use the information in the following table to complete the fields in the Revenue and Cost Breakdown page.
Field Description Plan Search and select the inventory plans that you want to analyze.
Click Save As Default to make the details selected in the Search Criteria as default in this page. The selected search criteria appear automatically every time you navigate to this analysis page.Org Optionally, search and select an organization to analyze its revenue and cost breakdown. Category Optionally, search and select a category to analyze its revenue and cost breakdown. Period Optionally, specify the period for which you want to analyze the revenue and cost breakdown. You can select the start and end dates from the date editor. View By Select a view by to drill down. You can view by plan, category, item, period, or week.
You can view month-wise revenue and cost breakdown detail for either the manufacturing or financial calendar by selecting period from the list.
You can view week-wise details only for the manufacturing calendar. You can select the type of calendar in the preference set created for Revenue and Cost Breakdown page. For more information, see the section on creating and editing preference sets in Analyzing Inventory Plans.Display using Preference Set Optionally, select a preference set from the list. For more information, see the section on creating and editing preference sets in Analyzing Inventory Plans. -
Click Go to analyze the selected inventory plans.
The inventory planning engine displays the revenue and cost breakdown details for the selected plans.
The following table describes the column headings of the tabular display in Revenue and Cost Breakdown page:
Column Heading Description Plan The name of the plan that you have selected for analysis. Category The categories in the selected plans whose revenue and cost breakdown details are displayed. This column appears if you are viewing by category. Item The items in the selected plans whose revenue and cost breakdown details are displayed. This column appears if you are viewing by item. Time The bucket for which the revenue and cost breakdown details are displayed. This column appears if you are viewing by period or week. Planned Production Cost The estimated cost of producing the planned items. The inventory planning engine calculates the production cost for each item in the plan and aggregates the cost at the plan level.
The inventory planning engine calculates the planned production cost for an item by multiplying the resource unit cost and the required hour. The resource unit cost and required hour for items are specified in Oracle Bills of Material. For more information, see the Oracle Bills of Material User's Guide.Planned Carrying Cost The estimated cost of stocking the planned items. The inventory planning engine calculates the carrying cost for each item in the plan and aggregates the cost at the plan level.
The inventory planning engine calculates the carrying cost based on the carrying cost percentage. Carrying cost percentage can be set up at the item level using Oracle Inventory or at the profile option level. The carrying cost percentage set up at the item level takes precedence over the carrying cost percentage set up at the profile option level. For information on setting up carrying cost percentage at the item level, see Oracle Inventory User's Guide.Planned Purchasing Cost The estimated purchasing cost for the planned items. The inventory planning engine calculates the purchasing cost for each item in the plan and aggregates the cost at the plan level.
The inventory planning engine calculates the purchasing cost for an item based on its standard cost. The standard costs for items are specified in blanket purchase order agreement. These purchase orders are created in the Oracle Purchasing application. For more information, see Oracle Purchasing User's Guide.
The standard costs for items can also be specified in the Oracle Cost Management application. For more information, see Oracle Cost Management User's Guide. The standard costs specified in Oracle Purchasing takes precedence over the standard costs specified in Oracle Cost Management.Planned Transportation Cost The estimated cost for transporting the planned items from an organization to another. The inventory planning engine calculates the transportation cost for each item in the plan and aggregates the cost at the plan level. The inventory planning engine calculates the transportation cost for an item by multiplying the number of unit items supplied, unit weight or unit volume, and transportation cost per unit weight or unit volume.
The inventory planning engine calculates the number of units supplied based on the item's demand schedule. It takes the organization name from which the item is sourced and the organization name to which the item is supplied from the item's sourcing rule. It also takes the shipment method from the sourcing rule.
The inventory planning engine takes the unit weight or unit volume for the item and the cost of transporting an unit weight or unit volume of the item between the two organizations by the specified shipping method from Oracle Inventory.
Unit weight or unit volume for an item is specified in the Physical Attributes tabbed region of Master Items window or Organization Items window of Oracle Inventory. The cost of transporting a unit weight or unit volume between two organization using a specific shipping method is specified in the Transit window of Oracle Inventory.
For information on demand schedule, see the section on demand schedules in The Organizations Tabbed Region. For information on sourcing rules, see Oracle Advanced Planning Implementation and User's Guide. For information on transportation cost per unit weight or unit volume of an item, see Oracle Inventory User's Guide.Planned Revenue The estimated gross income for the plan from the sales of items that have an independent demand. The inventory planning engine calculates the revenue for each planned item that has an independent demand and aggregates the revenue at the plan level. The inventory planning engine calculates the revenue for an item by multiplying its selling price and the number of unit items supplied.
The selling price for an item is specified in the List Lines tabbed region in the Price Lists window of Oracle Order Management. For more information, see Oracle Order Management User's Guide.
The inventory planning engine calculates the number of units supplied based on the item's demand schedule. The demand schedule for an item is defined in the Organization tabbed region of the Plan Options window of Oracle Optimization. For information on demand schedules, see the section on demand schedules in The Organizations Tabbed Region.Planned Production as % of total cost The percentage of the production cost in the total cost.
The inventory planning engine calculates this value by dividing the planned production cost by the total cost and then multiplying the result by 100. The total cost is the sum of the planned production cost, planned carrying cost, planned purchasing cost, and planned transportation cost.Planned Carrying as % of total cost The percentage of the carrying cost in the total cost.
The inventory planning engine calculates this value by dividing the planned carrying cost by the total cost and then multiplying the result by 100. The total cost is the sum of the planned production cost, planned carrying cost, planned purchasing cost, and planned transportation cost.Planned Purchasing as % of total cost The percentage of the purchasing cost in the total cost.
The inventory planning engine calculates this value by dividing the planned purchasing cost by the total cost and then multiplying the result by 100. The total cost is the sum of the planned production cost, planned carrying cost, planned purchasing cost, and planned transportation cost.Planned Transportation as % of total cost The percentage of the transportation cost in the total cost.
The inventory planning engine calculates this value by dividing the planned transportation cost by the total cost and then multiplying the result by 100. The total cost is the sum of the planned production cost, planned carrying cost, planned purchasing cost, and planned transportation cost.
Analyzing Service Level Breakdown
Service level is the percentage of meeting your customers' requirements through your finished-goods inventory. Inventory Optimization enables you to specify service levels at various levels such as plan, demand class, organization, and item. The inventory planning engine calculates the achievable service levels based on the plan inputs.
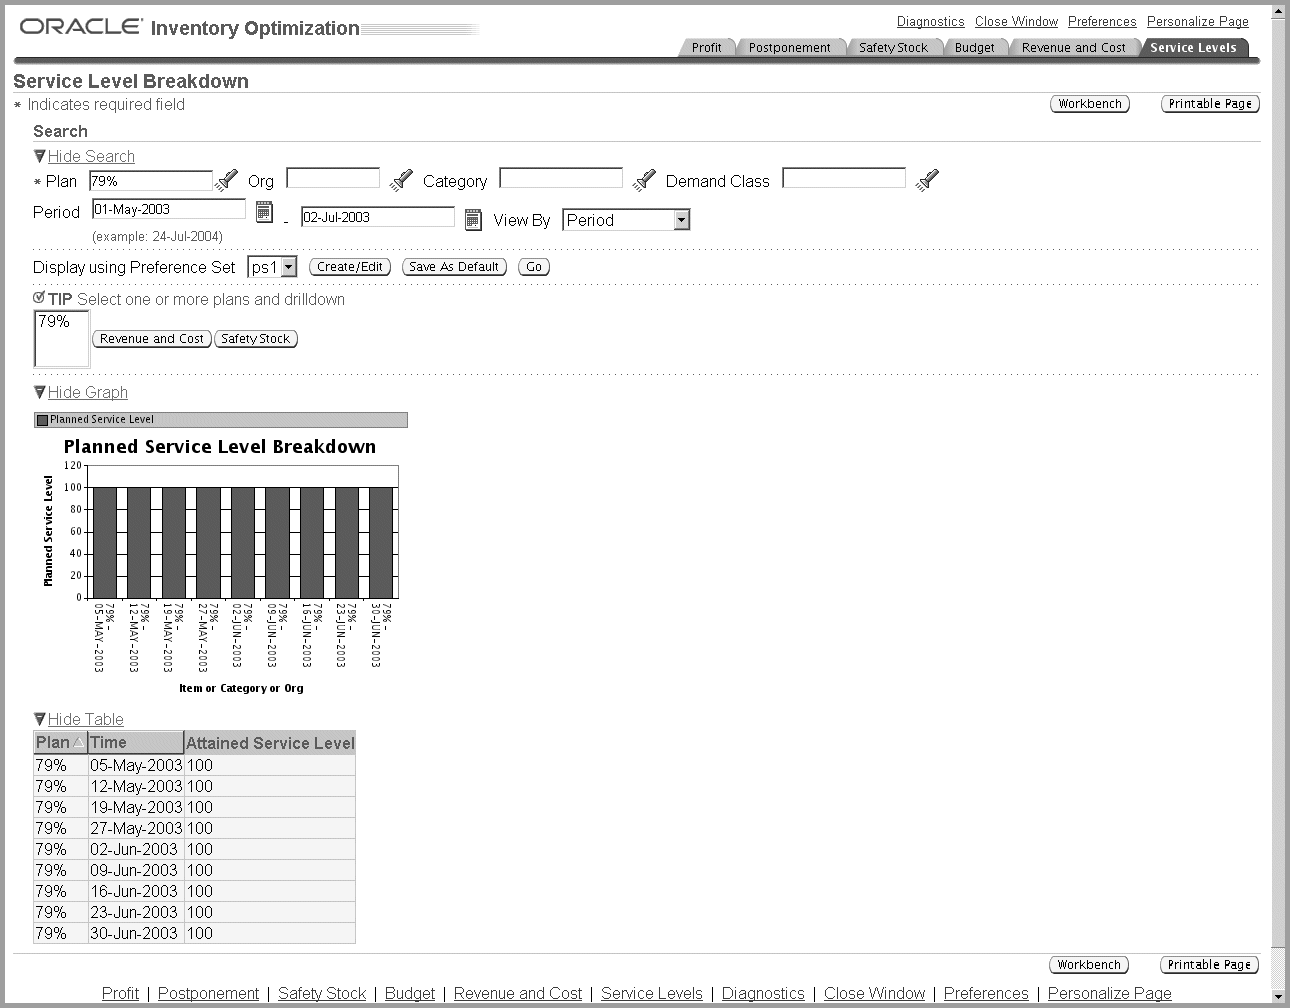
You can analyze the service level breakdown of your inventory plans using the Service Level Breakdown page. This analysis helps you view the achievable service levels at the various levels for an inventory plan. This enables you to view the achievable service levels for your most profitable organization, demand class, item, and item categories. This analysis also enables root cause analysis. For example, if there is a service level violation, you can drill down to the items for which the achievable service level is lower than the targeted service level. Further you can navigate to the Safety Stock Analysis page to find out if the user-specified safety stocks or the calculated safety stock values are causing service level violation.
The Service Level Breakdown page enables you to view the service level breakdown details in both the tabular and graphical formats. The details displayed in these formats are based on your search criteria. You can further drill down using the View By feature. The graphical format shows the planned service level against an item, category, or organization.
You can also widen the scope of your analysis by navigating to other related pages from the Service Level Breakdown page. This enables you to analyze the selected plans with the same search criteria specified in the Service Level Breakdown page. You can select the plans from the list and navigate to the following analysis pages from the Service Level Breakdown page:
-
Revenue and Cost Breakdown
-
Safety Stock Analysis
Navigating to other related analysis pages
To analyze service level breakdown
Steps
-
From the Analysis Workbench, click Service Levels.
The Service Level Breakdown page appears.
Service Level Breakdown page
-
Use the information in the following table to complete the fields in the Service Level Breakdown page.
Field Description Plan Search and select the inventory plans that you want to analyze.
Click Save As Default to make the details selected in the Search Criteria as default in this page. The selected search criteria appear automatically every time you navigate to this analysis page.Org Optionally, search and select an organization to analyze its service level breakdown. Category Optionally, search and select a category to analyze its service level breakdown. Demand Class Optionally, search and select a demand class to analyze its service level breakdown. Period Optionally, specify the period for which you want to analyze the service level breakdown. You can select the start and end dates from the date editor. View By Select a view by to drill down. You can view by plan, category, item, period, week, or demand class. Display using Preference Set Optionally, select a preference set from the list. For more information, see the section on creating and editing preference sets in Analyzing Inventory Plans. -
Click Go to analyze the selected inventory plans.
The inventory planning engine displays the service level breakdown details for the selected plans.
The following table describes the column headings of the tabular display in Service Level Breakdown page:
Column Heading Description Plan The name of the plan that you have selected for analysis. Category The categories in the selected plans whose service level details are displayed. This column appears if you are viewing by category. Item The items in the selected plans whose service level details are displayed. This column appears if you are viewing by item. Time The bucket for which the service level details are displayed. This column appears if you are viewing by period or week. Demand Class The demand class in the selected plans whose service level details are displayed. This column appears if you are viewing by demand class. Attained Service Level The achievable service level for a plan. The inventory planning engine calculates the attained service level based on the inputs for the plan.