Oracle Procurement Command Center
This chapter covers the following topics:
- Procurement Command Center Overview
- Procurement Operations Overview
- Summary Dashboard
- Requisitions Dashboard
- Orders Dashboard
- Order Details Dashboard
- Agreements Dashboard
- Managing Bulk Update of Procurement Data Using Oracle Web ADI
- Strategic Sourcing Dashboard
- Indirect Procurement Dashboard
- Supplier Analysis Dashboard
- Item Analysis Dashboard
- Employee Shopping Tracker Dashboard
Procurement Command Center
Procurement Command Center Overview
Oracle Procurement Command Center enables procurement professionals to develop purchasing strategies while empowering cross-document actions. As a procurement team member, manager, or buyer you can use the charts, graphs, and metrics to coordinate procurement processes. Use the command center to optimize procurement operations, catalog management, and supplier relationships.
The Procurement Command Center includes the following dashboards:
Use the command center dashboards to:
-
Analyze key procurement metrics and trends to get insight into the overall procure to pay process.
-
Implement a focused approach towards procurement management and prioritization.
-
Take timely decisions to track procurement activities and follow up on deliverables.
-
Prioritize requisitions based on your business requirements and create orders.
-
Review agreements and resolve problems before they affect business.
-
Monitor orders and track the average time it takes to process orders through the procurement cycle.
-
-
Track strategic sourcing objectives using the aggregate information from sourcing negotiations.
-
Identify strategic suppliers and track negotiated savings.
-
Investigate negotiations that are not awarded and act proactively to create awards.
-
-
Respond to requester feedback with catalog updates to maintain high service levels and contract use.
-
Gain insights from requester feedback to improve catalog content.
-
Identify opportunities for increased contract spend by gaining insights from off-contract spend (including iExpense).
-
-
Manage supply risk by viewing purchasing activities in aggregate.
-
Gain insight into the performance of suppliers including on-time delivery, quality, and price-compliance trends of the supplier.
-
Use performance criteria and comprehensive supplier data to identify the best set of suppliers to meet business objectives.
-
Use performance criteria and purchasing history to select items that meet business objectives.
-
-
Improve the catalog content in the iProcurement Shop page to make shopping more effective.
-
Analyze and review searches for items or services.
-
Track searches to know whether they are successful.
-
Note: You can use the Procurement Command Center only after the installation and common configurations are completed as described in My Oracle Support Knowledge Document 2495053.1, Installing Oracle Enterprise Command Center Framework, Release 12.2. For additional ECC overview information, see Overview of Enterprise Command Centers, Oracle E-Business Suite User's Guide.
Searching Enterprise Command Center Dashboards
Use the dashboard sidebar to refine (filter) the data on each dashboard. You can select a value or record from the Available Refinements component, or use Search to find a keyword, a value, or a specific record. The type-ahead feature suggests matches for your entry that correspond to the available refinements. When you submit a search, the search term is added to the Selected Refinements list, and the dashboard data is refined to include only records that match the search. You can add multiple refinements and remove any of them at any time. Use Saved Search to create and save your search. You can edit, delete, or refer to this saved search. You can also use data sets to further refine your search.
Use an asterisk (*) or percent (%) to perform a partial keyword or record search that matches any string of zero or more characters. You can also use a question mark (?) to perform a partial search that matches any single character.
Additional Information: about searching for and refining data in enterprise command centers, see Search in Highlights of an Enterprise Command Center, Oracle E-Business Suite User's Guide.
Procurement Operations Overview
See Procurement Command Center Overview.
From the Procurement Operations tab, the following dashboards are available:
Use these dashboards to:
-
Examine data for procurement documents and processes.
-
Review procurement operations.
-
Manage procurement activities.
-
Search across related procurement documents and assess individual document flows end-to-end.
-
Prioritize work by reviewing all procurement activities.
-
-
Discover and resolve problems, and take corrective action on exceptions, before they affect your business.
-
Drive timely and well-informed decisions.
Summary Dashboard
See Procurement Command Center Overview.
The Summary dashboard presents key metrics related to the procure to pay process.
Use the dashboard to:
-
Review data of average approvers for purchase requisitions and purchase orders to improve the purchase order management workflows.
-
View the average number of revisions to address huge revisions and improve overall process.
-
Review the time taken from requisition approval to purchase order approval.
-
Use the data to improve the procurement cycle.
-
-
Review time spent on approval of payables invoices from different invoice sources.
-
Identify and implement procedures to expedite invoice payments.
-
-
Gain insight into the preferred purchase order communication methods.
-
Monitor catalog usage for purchase requisitions and requisition lines.
-
Work toward efficient catalog management.
-
-
Assess spend behavior on spend types such as iExpense, Contract, and Off-Contract.
-
Evolve best practices to mitigate procurement risks.
Access the Summary dashboard using the following navigation:
(N) Purchasing > Procurement Command Center > Procurement Operations
Summary Dashboard
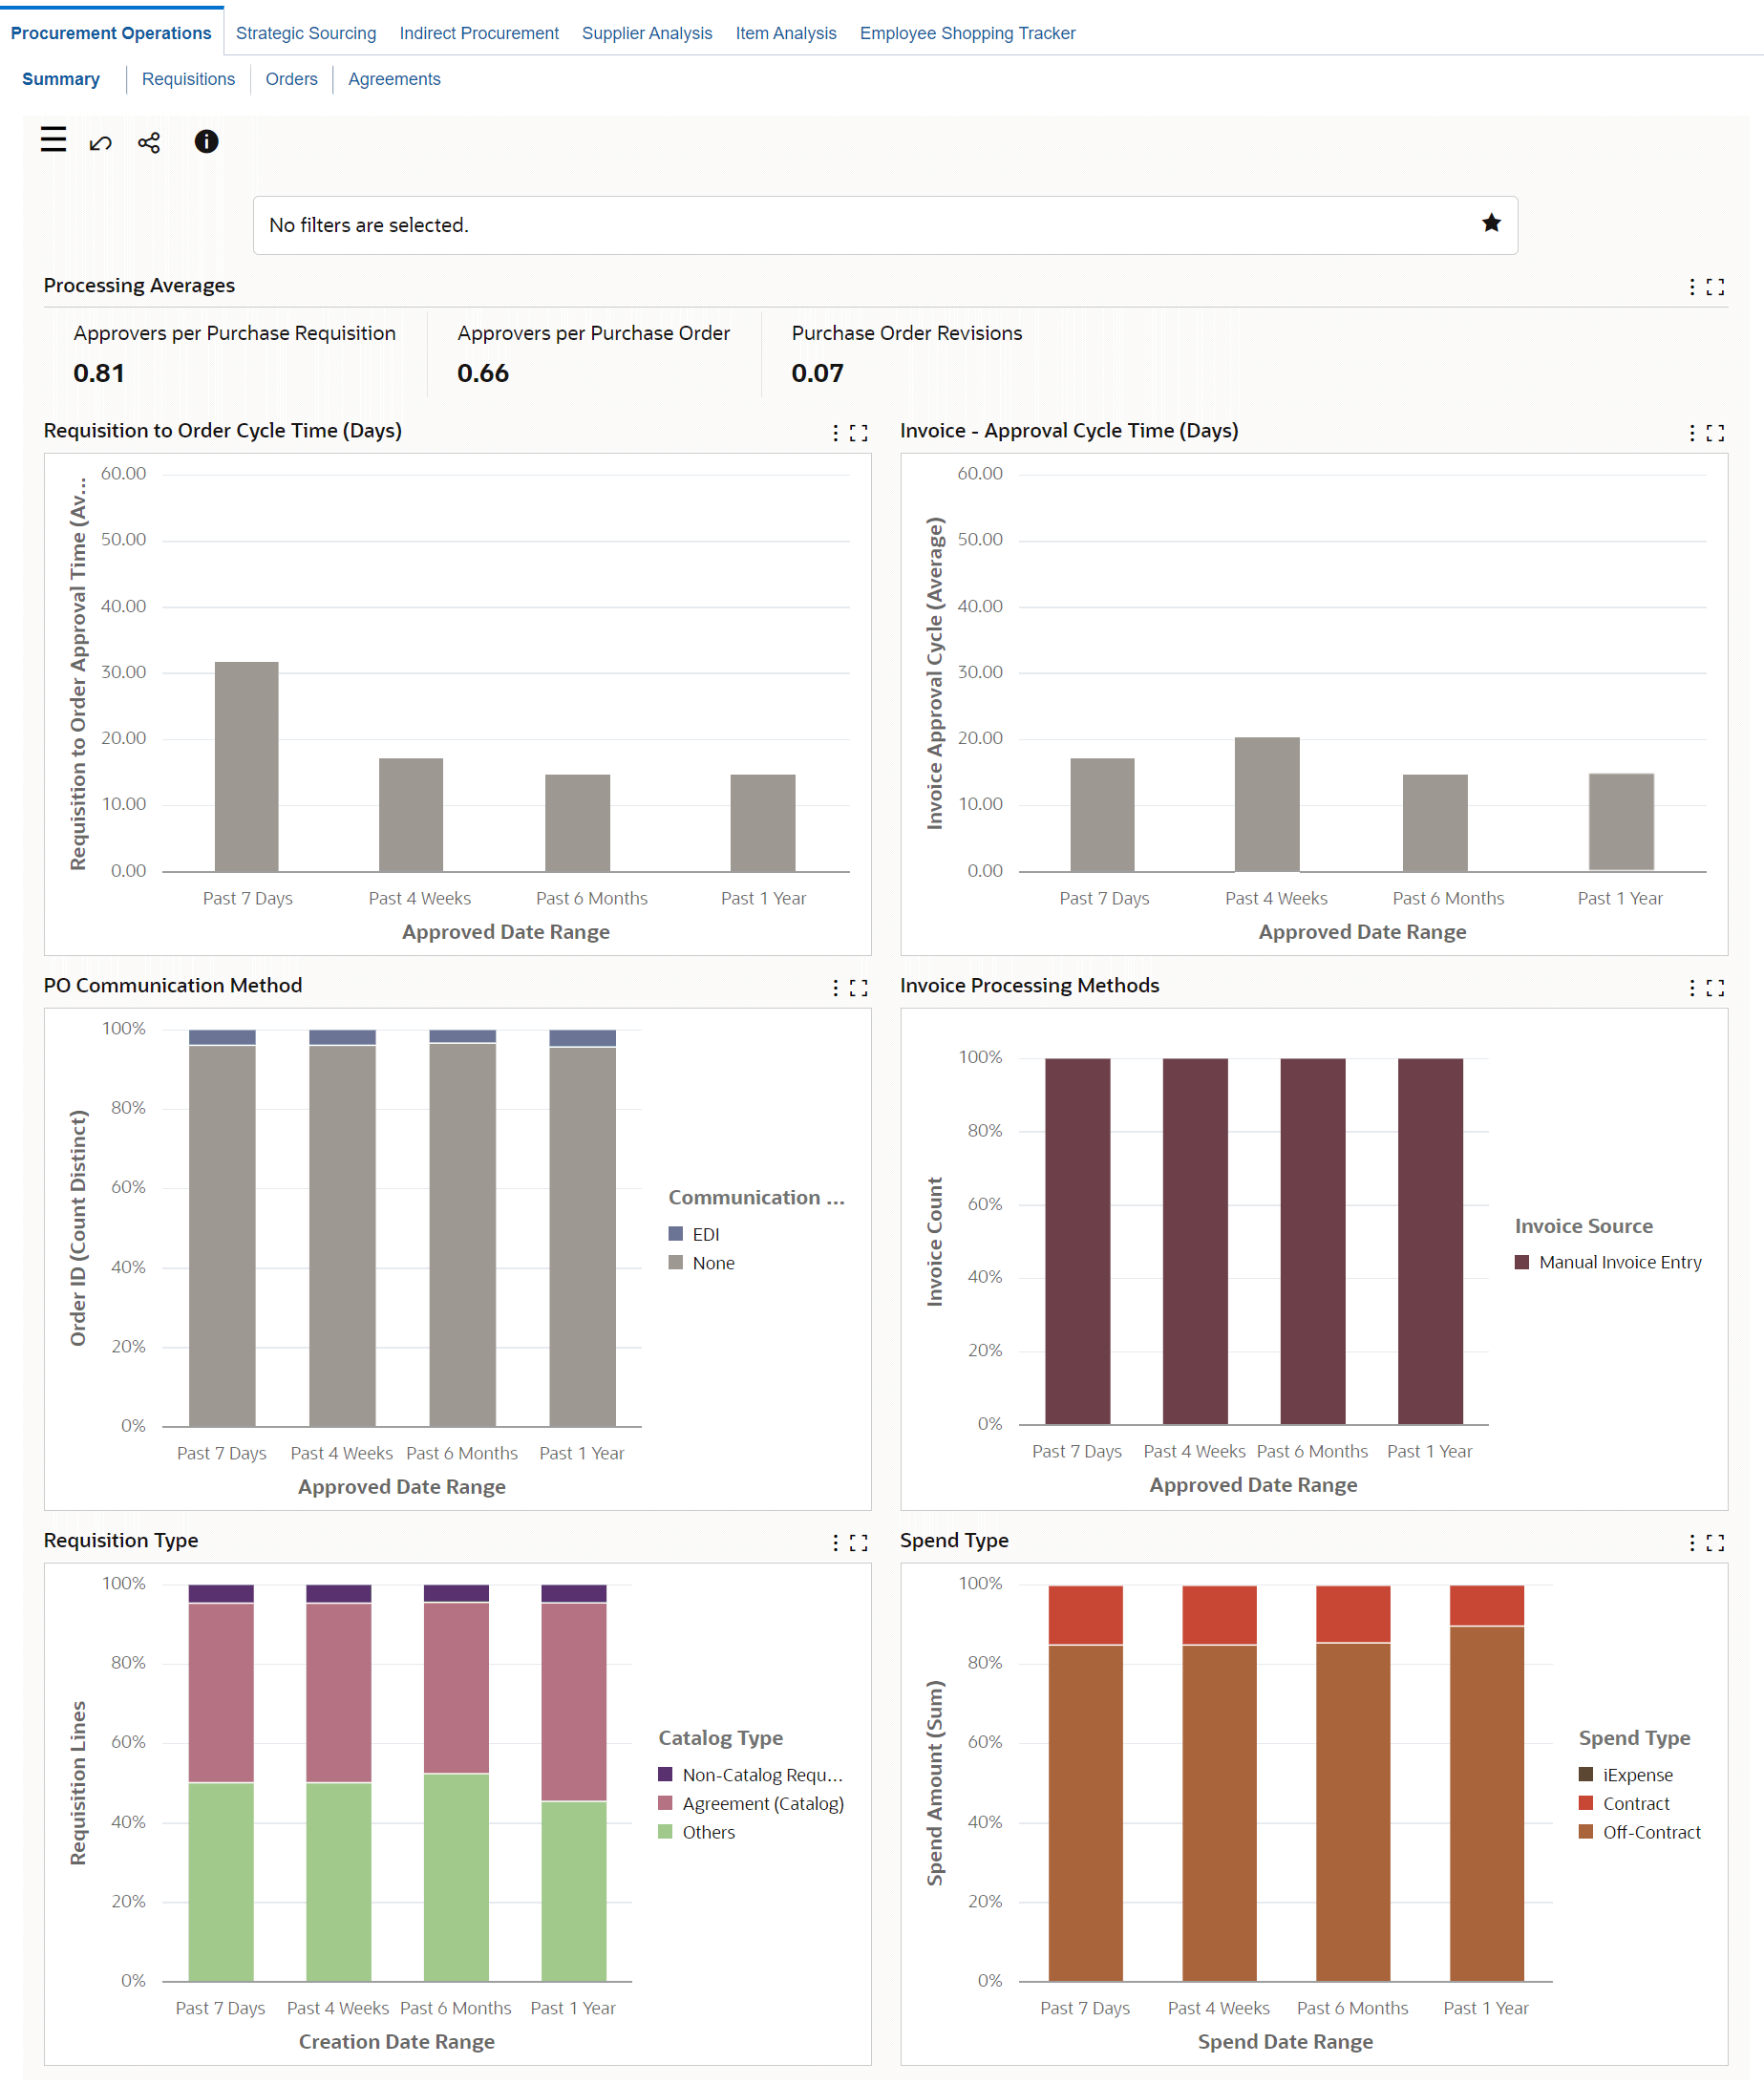
The following table describes the dashboard:
| Component | Description |
|---|---|
| Processing Averages (summary bar) | This summary bar displays the following metrics.
|
| Requisition to Order Cycle Time (Days) (chart) | This chart is to track the time taken from requisition approval to purchase order approval in an approved date range. Select a different group dimension to view data by creation date range, creation date (year), or approved date year. |
| Invoice - Approval Cycle Time (Days) (chart) | This chart shows the time taken for approval of accounts payable (AP) invoices in an approved date range. Select a different group dimension to view data by invoice date range or invoice date (year). |
| PO Communication Method (chart) | This chart shows the number of purchase orders that are processed electronically through communication methods in an approved date range. Select a different group dimension to view data by creation date range, approved date (year) or create date (year). |
| Invoice Processing Methods (chart) | This chart shows the number of invoices that are processed electronically by invoice source or invoice type in an approved date range. Select a different group dimension to view data by invoice date range or invoice date (year). |
| Requisition Type (chart) | This chart shows the number of approved requisitions by catalog type in a creation date range. Select a different group dimension to view data by approved date range, creation date (year), or approved date year. |
| Spend Type (chart) | This is a chart to analyze the sum of spend amounts for a spend type in a spend date range or spend date (year). |
Requisitions Dashboard
See Procurement Command Center Overview.
The Requisitions dashboard provides end-to-end visibility into requisitions management. From this dashboard you can review, monitor, and analyze requisitions.
Use the dashboard to:
-
Manage requisitions proactively.
-
Search for requisitions, including contractor requisitions and view details.
-
Prioritize requisitions based on your business needs.
-
Monitor the status of requisitions, review pending tasks, and identify requisitions that need follow-up.
-
-
Identify and resolve issues before they affect your business.
-
Manage work queue by acting on requisitions based on priority.
-
Check if the requisition line can be fulfilled using an existing catalog.
-
-
Increase productivity.
-
Analyze how requisition tasks are executed to identify areas for improvement.
-
Manage workload by assigning or reassigning requisitions to specific team members.
-
Manage workload by assigning or reassigning requisitions within the team.
-
Find the best suppliers for requisitions.
-
Create RFQs or purchase orders for requisitions.
-
Access the Requisitions dashboard using the following navigation:
(N) Purchasing > Procurement Command Center > Procurement Operations
Note: The dashboard data is always refined to the organizations to which the user has access, and to transactions that match the selected currency.
Requisitions Dashboard
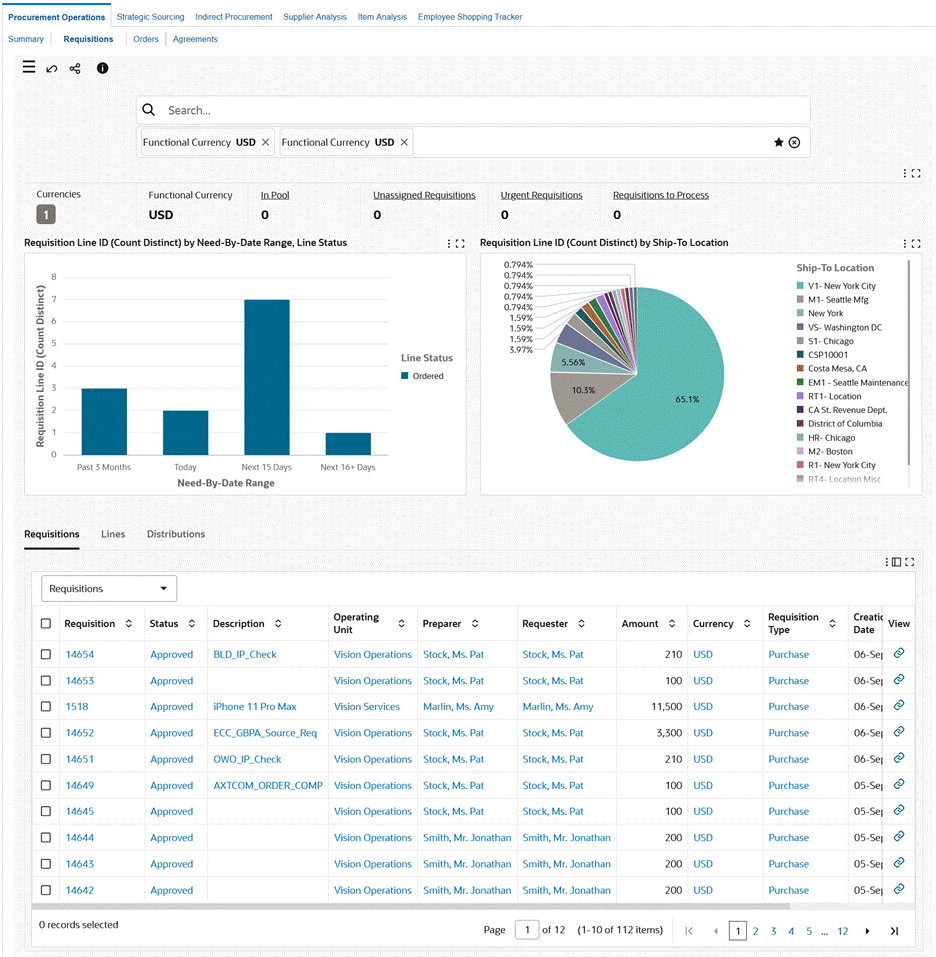
The following table describes the dashboard:
| Component | Description |
|---|---|
| Metrics | You can view currency information and several metrics. To refine dashboard data, including the metrics, by currency, click Currencies and then select a value.
|
| Requisition Line (Count Distinct) by Need-By-Date Range, Category (chart) | By default, this chart shows the count of requisition lines by need-by date and category. This count includes all lines that have future need-by dates and all approved requisition lines that have need-by dates up to three months in the past. The available metrics are requisition line count and line amount. Select a different group dimension to view the requisition line count or amount by buyer name, approved date, project, category, ship-to location, or line status. Select a different dimension to view the requisition line count or amount by ship-to location, line status, reservation status, or project. You can sort the data by need-by date, range, line amount, or sum. |
| Requisition Line (Count Distinct) by Ship-To Location (chart) | By default, this pie chart shows the percentage of requisition lines by ship-to location. The hover text for each pie chart segment displays the number of requisition lines to that ship-to location. Select a different dimension to view the percentage of requisition lines by project, category, or buyer name. This chart does not include requisitions that are canceled and finally closed. |
| Requisitions, Lines, and Distributions (results tables) | These tables display requisition summaries and details for requisition lines and distributions. Use attribute groups to see more information about requisitions. You can perform the following row-level actions:
|
| Options (table-level actions) | See Performing Actions for information about these actions. |
Performing Actions
The following sections describe the actions that you can perform from the Options icon in the results tables.
Common Actions
The following are the common actions that are available from the Options icon in the results tables.
-
Compare: Select multiple rows to compare information.
-
Export: Use this action to export the search results in a comma-separated values (CSV) file.
The following table describes the actions available when you select the Options icon in the Lines results table. Select one or more rows and click the Options icon to act on your selection.
Actions for Lines
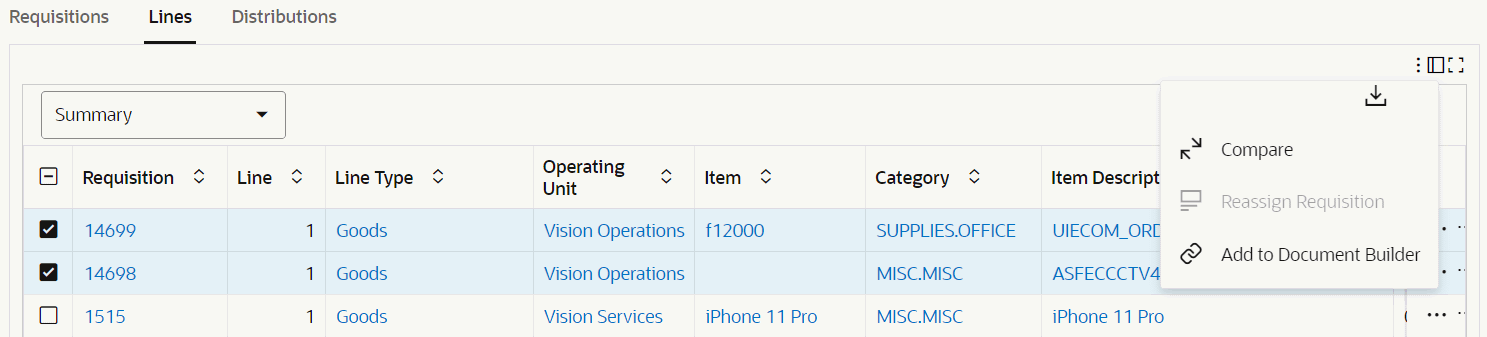
| Action | Description |
|---|---|
| Reassign Requisition | Use this action to reassign a set of requisition lines from one buyer to another. When you select this action, the Reassign Requisition Lines dialog box appears. In the dialog box, reassign the requisition lines to a new buyer and click Apply. The application displays a confirmation message and automatically updates the records to display real-time data on the dashboard. |
| Add to Document Builder | Select one or more requisition lines and add them to the Document Builder to create a RFQ or a purchase order. Only requisitions with a status of In Pool can be added to the Document Builder. If the requisition is sourced to a suggested supplier or multiple suggested suppliers, then suppliers are also added to the Document Builder along with the requisitions. After adding requisition lines and suppliers, you can create the following documents using the Document Builder:
|
Orders Dashboard
See Procurement Command Center Overview.
Use the dashboard to:
-
Speed up the procurement process by monitoring the progress of orders.
-
Track orders with open action items.
-
Access and review all lines of an order on the Order Details dashboard.
-
Follow up on deliverables that are due or overdue.
-
Work with suppliers to get shipments and deliverables on time.
-
-
Review the time taken by each order in a procurement cycle phase.
-
Manage work queue by prioritizing orders based on the status and pending change requests.
-
Assess orders and their statuses to follow up and complete them.
-
Review time spent on different lifecycle of orders and take action to reduce it.
-
Review pay items that are overdue and work confirmations that are pending approval.
-
Gain insight into the performance of suppliers including on-time delivery, quality, and price-compliance trends of the supplier.
Access the Orders dashboard using the following navigation:
(N) Purchasing > Procurement Command Center > Procurement Operations
Note: The dashboard data is always refined to the organizations to which the user has access, and to transactions that match the selected currency.
The Orders dashboard summarizes information using the following header-level group status and corresponding substatuses.
| Group Status | Substatus |
|---|---|
| Draft | Incomplete, Requires Reapproval, On Hold, Rejected |
| In-Process | In Process, Pre-Approved, Signature Required, Pending Supplier Acknowledgment |
| Open | Approved, On Hold, Frozen, Has Pending Change Requests, Has Overdue Shipments, Delay Anticipated, Has Quality Rejections |
| Closed | Closed, Finally Closed, Canceled |
Orders Dashboard
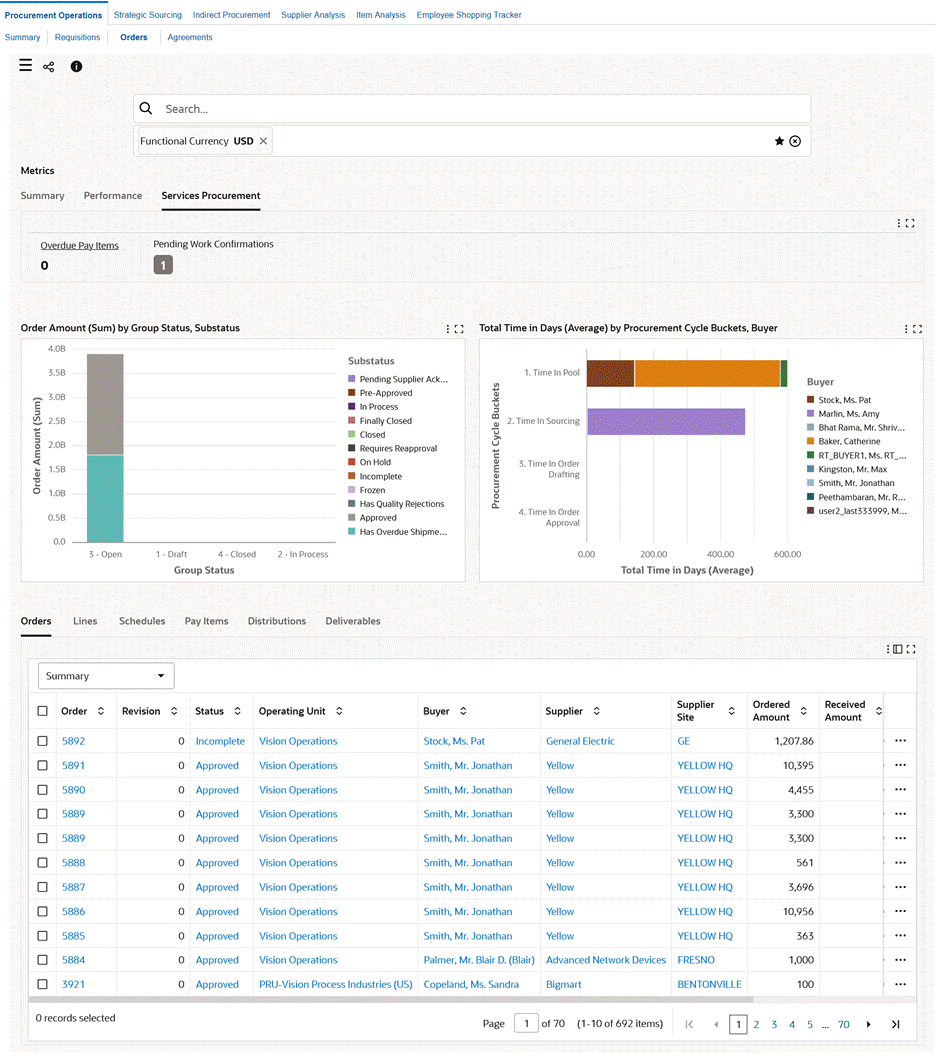
The following table describes the dashboard:
| Component | Description |
|---|---|
| Metrics (tab) Summary |
This summary bar displays currency information and several metrics. To refine dashboard data, including the metrics, by currency, click Currencies and then select a value.
|
| Metrics (tab) Performance |
This summary bar shows the following metrics:
|
| Metrics (tab) Services Procurement |
This summary bar shows the following metrics that are related to complex purchase orders:
|
| Order Amount (Sum) by Group Status, Substatus (chart) | This stacked bar chart shows the sum of order amounts or the order count for orders by group status and substatus. Select a group dimension to view the order amounts or count by buyer or project name. Select a dimension to view the order amounts or count by reservation status. |
| Total Time in Days (Average) by Procurement Cycle Buckets, Buyer (chart) | This chart shows the average time it takes to process orders through the procurement cycle buckets for each buyer or an order. |
| Orders, Lines, Schedules, Deliverables, and Distributions (results tables) | These tables display order summaries and details for order lines, schedules, deliverables, and distributions. Use attribute groups to see more information about orders.
|
| Options (table-level actions) | See Performing Actions for information about these actions. |
Performing Actions
The following sections describe the actions that you can perform from the Options icon in the results tables.
Common Actions
The following are the common actions that are available from the Options icon in the results tables.
-
Compare: Select multiple rows to compare information.
-
Export: Use this action to export the search results in a comma-separated values (CSV) file.
Actions for Orders
Orders Tab Actions
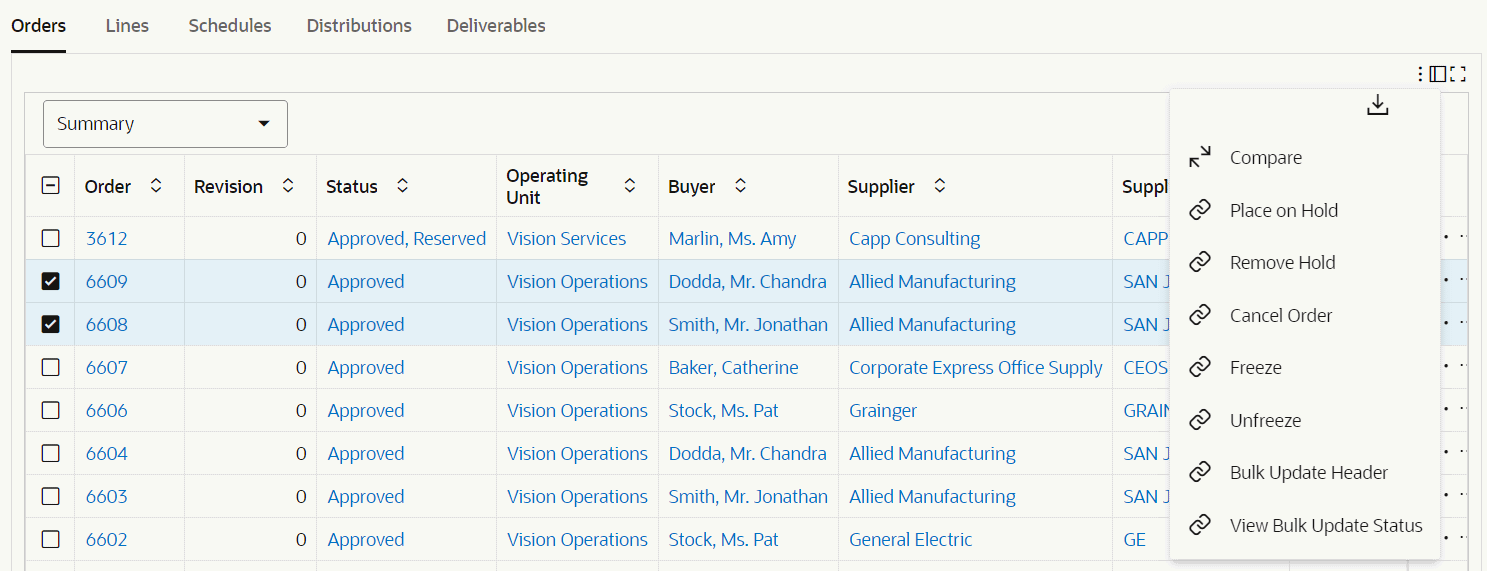
In the Orders results table, select one or more rows and click the Options icon to perform the following actions on your selection.
| Action | Description |
|---|---|
| Place on Hold | Use this action to place the selected orders on hold. |
| Remove Hold | Use this action to remove hold on the selected orders. |
| Cancel Order | Use this action to cancel the selected orders. |
| Freeze | Use this action to place a freeze on the selected orders. |
| Unfreeze | Use this action to remove freeze on the selected orders. |
| Bulk Update Header | Use this action to add or modify multiple purchase orders at a time using the Oracle Web Applications Desktop Integrator (Web ADI) integration with Microsoft Excel. See Managing Bulk Update of Procurement Data Using Oracle Web ADI. |
| View Bulk Update Status | Use this action to review the status of multiple updated purchase orders using the View Bulk Update Requests page. See Managing Bulk Update of Procurement Data Using Oracle Web ADI. |
Actions for Lines
In the Lines results table, select one or more rows and click the Options icon to perform the following actions on your selection.
Lines Tab Actions
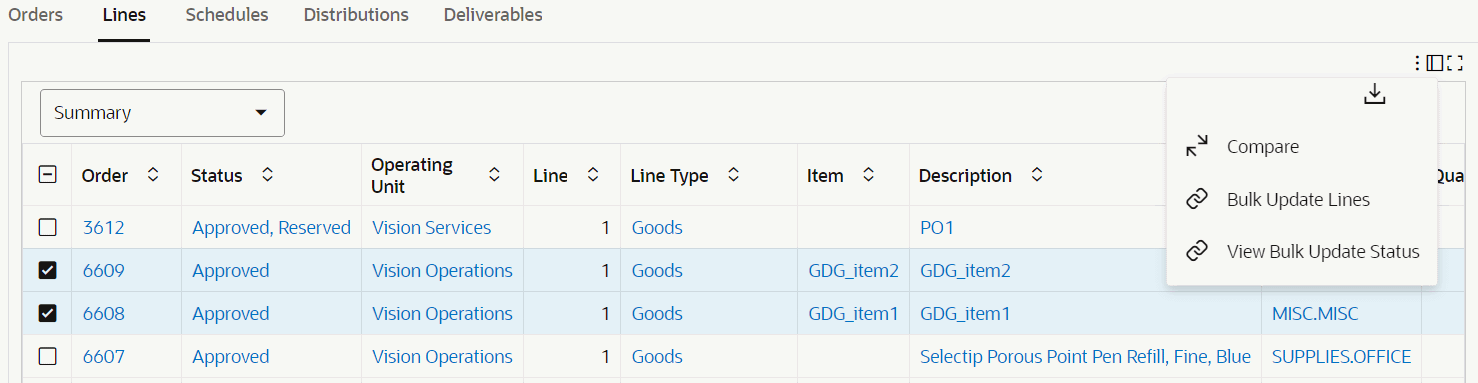
| Action | Description |
|---|---|
| Bulk Update Header | Use this action to add or modify multiple purchase order lines at a time using the Oracle Web Applications Desktop Integrator (Web ADI) integration with Microsoft Excel. See Managing Bulk Update of Procurement Data Using Oracle Web ADI. |
| View Bulk Update Status | Use this action to review the status of multiple updated purchase order lines using the View Bulk Update Requests page. See Managing Bulk Update of Procurement Data Using Oracle Web ADI. |
Actions for Schedules
Schedules Tab Actions
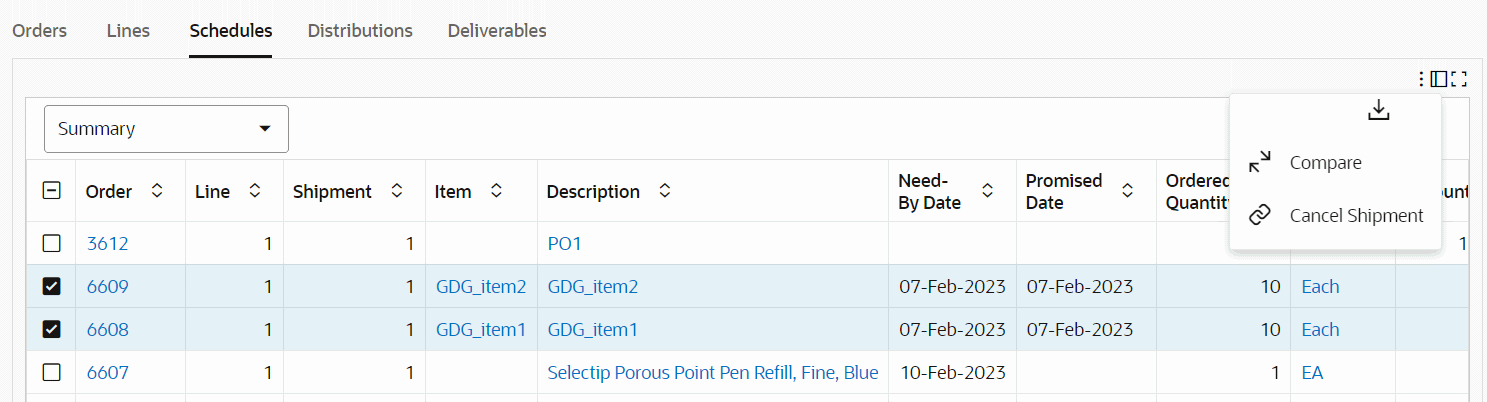
In the Schedules results table, select one or more rows and click the Options icon to perform the following actions on your selection.
| Action | Description |
|---|---|
| Cancel Shipment | Use this action to cancel the selected shipments. When you select this action, the Cancel page for order or orders appears to complete the task. |
Order Details Dashboard
See Orders Dashboard and Procurement Command Center Overview.
The Order Details dashboard provides comprehensive insight into the lines of an order to expedite the procurement process.
Important: When you navigate to the Order Details dashboard from the Orders results table, the dashboard filters data based on the selected order.
Use the dashboard to:
-
Review the amounts, number of shipments, and distributions for order lines.
-
Find the number of lines by item and item categories.
-
Track order lines by line and quantity status.
-
Monitor requisitions, receipts, and invoices for order lines.
-
Track the progress of work confirmations and review pay items for the work confirmations.
Access the Order Details dashboard using the following navigation:
(N) Purchasing > Procurement Command Center > Procurement Operations Orders dashboard > Orders results table > row-level Actions icon > Order Details
Order Details Dashboard
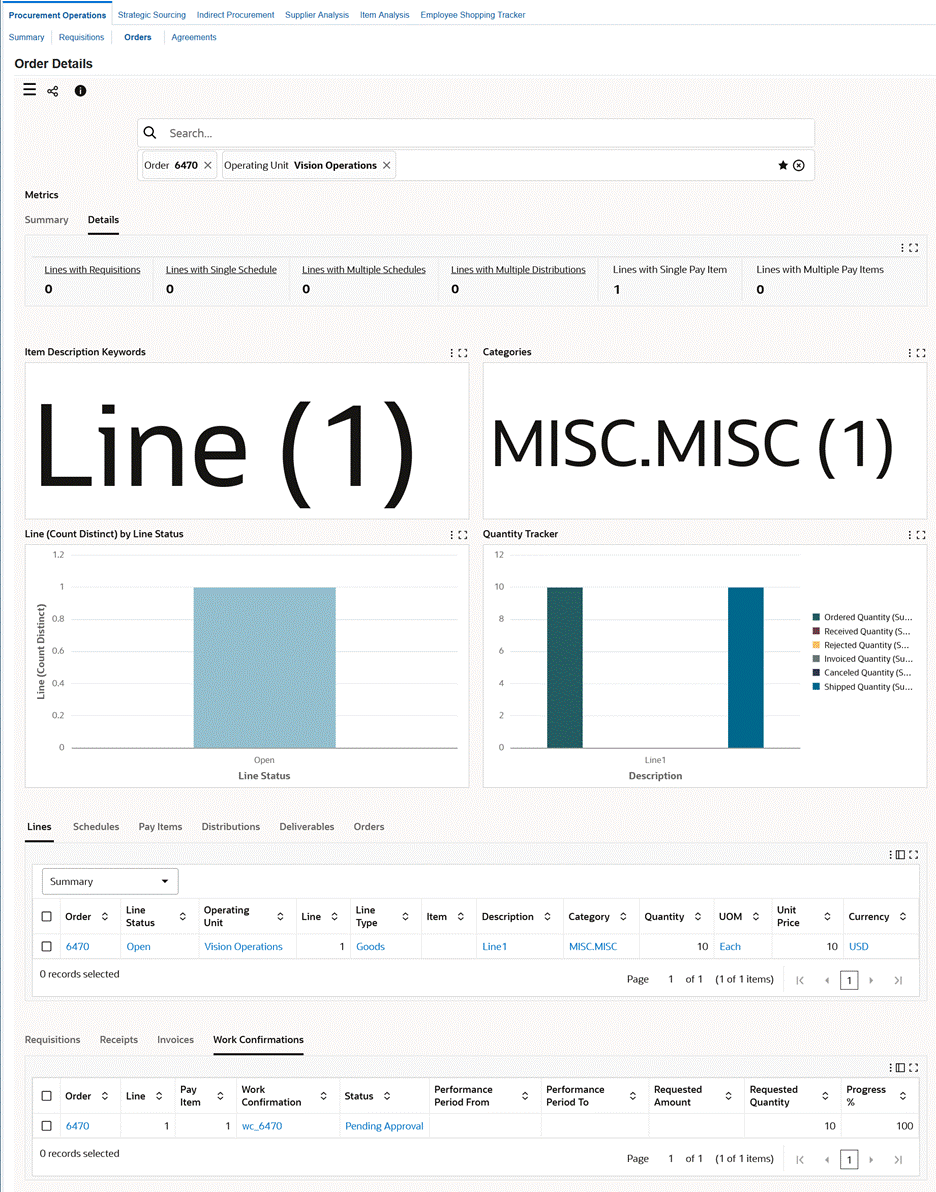
The following table describes the dashboard:
| Component | Description |
|---|---|
| Metrics (tab) Summary |
This summary bar displays the following metrics for order lines.
|
| Metrics (tab) Details |
This summary bar displays the following metrics to review details for lines. Click a metric to refine and filter data.
|
| Item Description Keywords (tag cloud) | Each cloud displays the keyword in the item description with the frequency of occurrence in purchase order lines. Click a tag cloud to filter the data based on the relevant tag cloud. |
| Categories (tag cloud) | Each cloud displays an item category with the frequency of occurrence in purchase order lines. Click a tag cloud to filter the data based on the relevant tag cloud. |
| Line (Count Distinct) by Line Status (chart) | By default, this chart shows the number of order lines by line status. Select a different dimension to view the number of order lines by task, project, or need-by date. |
| Quantity Tracker (chart) | This chart shows the value and quantity status for an order line. |
| Lines, Schedules, Pay Items, Distributions, Deliverables, Orders (results tables) | These tables display order summaries and details for order lines, schedules, pay items, deliverables, and distributions. Use attribute groups to see more information about order lines. |
| Requisitions, Receipts, Invoices (results tables) | Use these results tables to track requisition, receipt, and invoice details for order lines. |
| Work Confirmations (results table) | This table shows work confirmation details such as status, requested amount, requested quantity, and progress percentage. |
Agreements Dashboard
See Procurement Command Center Overview.
Use the dashboard to:
-
Track agreements and their statuses.
-
Identify agreements that must be completed.
-
Take action to extend expiring agreements.
-
Compare the amount agreed to for an agreement with the amount released.
-
Review agreements with low utilization in an effort to reduce off-contract spend.
-
Negotiate agreements which are over utilized.
-
Act on extending expiring agreements with potential negotiation of prices.
Access the Agreements dashboard using the following navigation:
(N) Purchasing > Procurement Command Center > Procurement Operations
Note: The dashboard data is always refined to the organizations to which the user has access, and to transactions that match the selected currency.
The Agreements dashboard summarizes information using the following header-level group status and corresponding substatuses.
| Group Status | Substatus |
|---|---|
| Draft | Incomplete, Requires Reapproval, On Hold, Rejected |
| In-Process | In Process, Pre-Approved, Signature Required, Pending Supplier Acknowledgment |
| Open | Approved, On Hold, Frozen, Has Change Requests, Approaching End Date, Approaching Amount Limit, Agreement Amount Reached, End Date Reached |
| Closed | Closed, Finally Closed, Canceled |
Agreements Dashboard
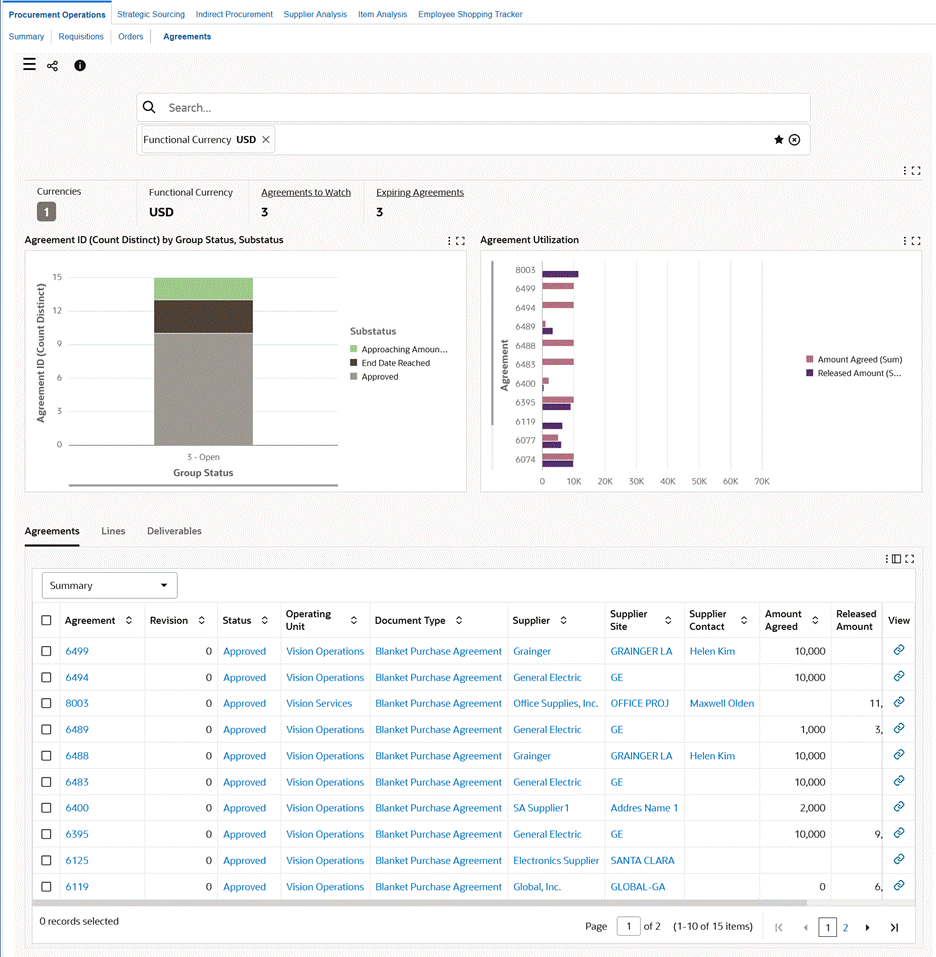
The following table describes the dashboard:
| Component | Description |
|---|---|
| Metrics | You can view currency information and metrics. To refine dashboard data, including the metrics, by currency, click Currencies and then select a value.
|
| Agreement (Count Distinct) by Group Status, Substatus (chart) | By default, this stacked bar chart shows the number of agreements by group status and substatus. Select a different group dimension to view the agreement count by buyer, creation year, or creation month. |
| Agreement Utilization (chart) | This dual metric bar chart shows the sum of the amount agreed to and the sum of the amount released, that is, the amount utilized for an agreement. |
| Agreements, Lines, and Deliverables (results tables) | These tables display agreement summaries and details for agreement lines and deliverables. Use attribute groups to see more information about agreements. You can perform the following actions from the results tables:
|
| Options (table-level actions) | See Performing Actions for information about these actions. |
Performing Actions
The following sections describe the actions that you can perform from the Options icon in the results tables.
Common Actions
The following are the common actions that are available from the Options icon in the results tables.
-
Compare: Select multiple rows to compare information.
-
Export: Use this action to export the search results in a comma-separated values (CSV) file.
Actions for Agreements
Agreements Tab Actions
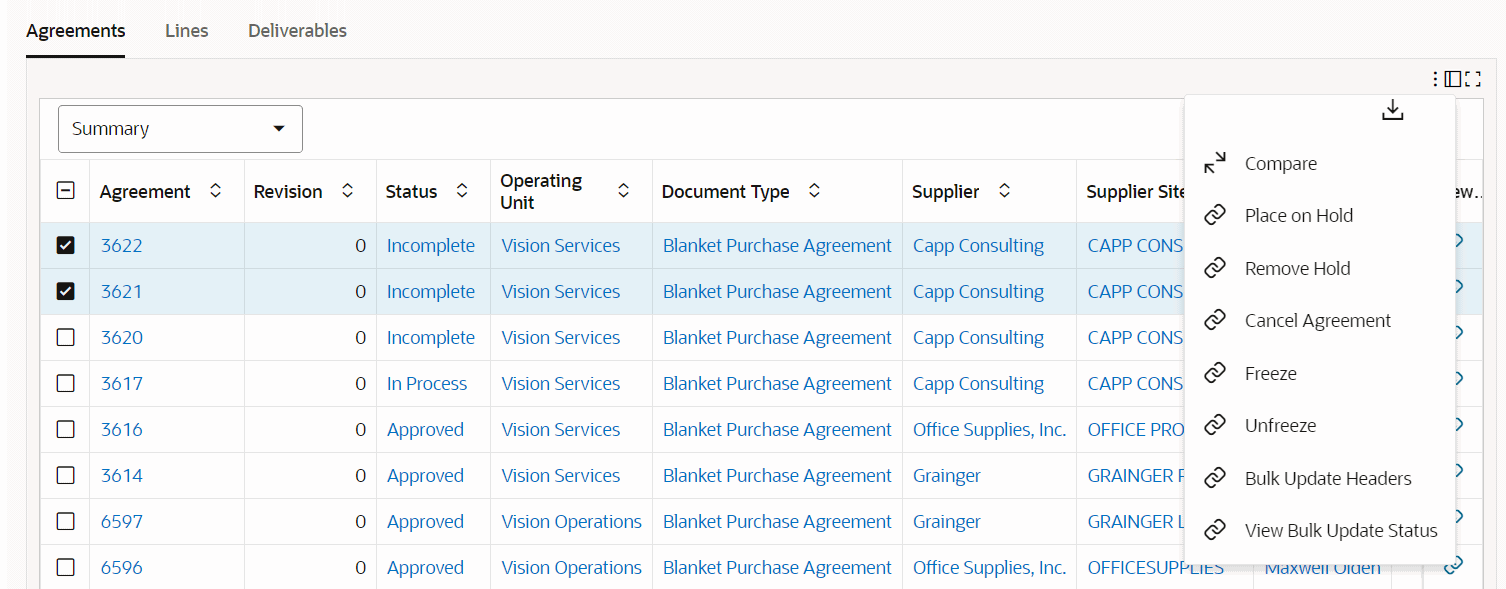
In the Agreements results table, select one or more rows and click the Options icon to perform the following actions on your selection.
| Action | Description |
|---|---|
| Place on Hold | Use this action to place the selected agreements on hold. |
| Remove Hold | Use this action to remove hold on the selected agreements. |
| Cancel Agreement | Use this action to cancel the selected agreements. When you select this action, the Cancel page for agreement or agreements appears. |
| Freeze | Use this action to place a freeze on the selected agreements. |
| Unfreeze | Use this action to remove the freeze on the selected agreements. |
| Bulk Update Headers | Use this action to add or modify multiple agreements using the Oracle Web Applications Desktop Integrator (Web ADI) integration with Microsoft Excel. See Managing Bulk Update of Procurement Data Using Oracle Web ADI. |
| View Bulk Update Status | Use this action to review the status of multiple updated agreements using the View Bulk Update Requests page. See Managing Bulk Update of Procurement Data Using Oracle Web ADI. |
Managing Bulk Update of Procurement Data Using Oracle Web ADI
See Procurement Command Center Overview.
The Oracle Web Applications Desktop Integrator (Web ADI) integration with Microsoft Excel in Procurement Command Center enables you to update data for multiple purchasing documents at a time. You can select multiple headers or lines for orders and agreements, make changes in bulk using a spreadsheet interface, and upload the modified data to the command center. Oracle Purchasing automatically submits approval workflows and notifies suppliers of approved changes simultaneously for all modified purchasing documents.
For information about how Oracle Web ADI works, refer to Oracle Web Applications Desktop Integrator Implementation and Administration Guide.
To make changes in bulk and view the bulk update status, the following actions are available from the Options icon in the results tables.
| Dashboard | Results Table | Action |
|---|---|---|
| Procurement Operations, Orders | Orders | Bulk Update Headers |
| Procurement Operations, Orders | Orders | View Bulk Update Status |
| Procurement Operations, Orders | Lines | Bulk Update Headers |
| Procurement Operations, Orders | Lines | View Bulk Update Status |
| Procurement Operations, Agreements | Agreements | Bulk Update Headers |
| Procurement Operations, Agreements | Agreements | View Bulk Update Status |
Performing Bulk Update of Procurement Data
Prerequisite: Before you modify orders or agreements using Oracle Web Applications Desktop Integrator (Web ADI), you must complete the setup steps based on the versions of Microsoft Excel and Microsoft Internet Explorer that you use. about how to complete the prerequisite step, refer to Oracle Web Applications Desktop Integrator Implementation and Administration Guide.
To perform bulk update of procurement data:
-
Select multiple rows in any of the following dashboards' results tables:
-
Orders dashboard
-
Orders
-
Lines
-
-
Agreements dashboard
Agreements
-
-
Select the Bulk Update Headers action from the Options icon. The application invokes the Web ADI function.
-
Select the integrator viewer.
-
Ensure that the Reporting check box is not selected.
-
Download the Microsoft Excel spreadsheet.
-
Enter or modify records in the spreadsheet.
Order Header Fields Column Description Document Style Read-only Operating Unit Read-only Order Number Read-only Supplier Read-only Supplier Site Read-only Buyer Editable list Total Read-only Description Editable, free text Bill to Location Editable list Payment Terms Editable list Default Ship To Editable list Ship Vid Editable list Freight Terms Editable list Note to Supplier Editable, free text Note to Receiver Editable, free text Descriptive Flexfields (DFFs) If your system administrator has configured DFFs, then the DFFs are available. Agreement Header Fields Column Description Document Style Read-only Operating Unit Read-only Order Number Read-only Supplier Read-only Supplier Site Read-only Buyer Editable list Amount Agreed Editable number field. The application validates this information. Effective From Editable date. The application validates this information. Effective To Editable date. The application validates this information. Description Editable, free text Bill to Location Editable list Payment Terms Editable list Amount Limit Editable number. The application validates this information. Default Ship To Editable list Ship Vid Editable list Freight Terms Editable list Note to Supplier Editable, free text Note to Receiver Editable, free text Descriptive Flexfields (DFFs) If your system administrator has configured DFFs, then the DFFs are available. -
Select Upload in the Oracle menu to upload records to the database.
-
If there are errors during the upload, then the error details can be seen in the Microsoft Excel spreadsheet. Oracle Web Applications Desktop Integrator returns messages to the spreadsheet identifying all rows that contain invalid values. By default, if the data in any row is invalid, then Oracle Web Applications Desktop Integrator does not upload any of the data in the spreadsheet. You must correct all errors to successfully upload the spreadsheet. However, if the integrator provides the Commit Rows upload parameter and you chose the Each Row option, then Oracle Web Applications Desktop Integrator does upload the valid rows. You can correct the errors in any invalid rows and retry the upload for those rows. During the upload process, the Purchase Orders Spreadsheet Import program automatically runs in the background to validate the orders or agreements data that is being imported. The import validation errors can be viewed using the View Bulk Update Status action.
-
Use the View Bulk Update Status action to track the status of the upload and to view any import errors.
Viewing Bulk Update Status
After performing bulk update actions for orders and agreements, you can view the status of your updates using the View Bulk Update Status action. When you click this action, the View Bulk Update Requests page appears. Use this page to review the status of the bulk update.
Strategic Sourcing Dashboard
See Procurement Command Center Overview.
As buyers and procurement managers, use the Strategic Sourcing dashboard to view aggregate information from sourcing negotiations to track and mitigate risks in achieving strategic objectives.
Use the dashboard to:
-
Search across negotiations and drill down to the associated document, or navigate to other dashboards of the Procurement Command Center in the context of a purchasing document.
-
Track negotiation cycle-times and savings achieved on each negotiation.
-
Identify work load of buyers and sourcing team.
Access the Strategic Sourcing dashboard using the following navigation:
(N) Purchasing > Procurement Command Center > Strategic Sourcing
Note: The dashboard data is always refined to transactions that match the selected currency.
Strategic Sourcing Dashboard
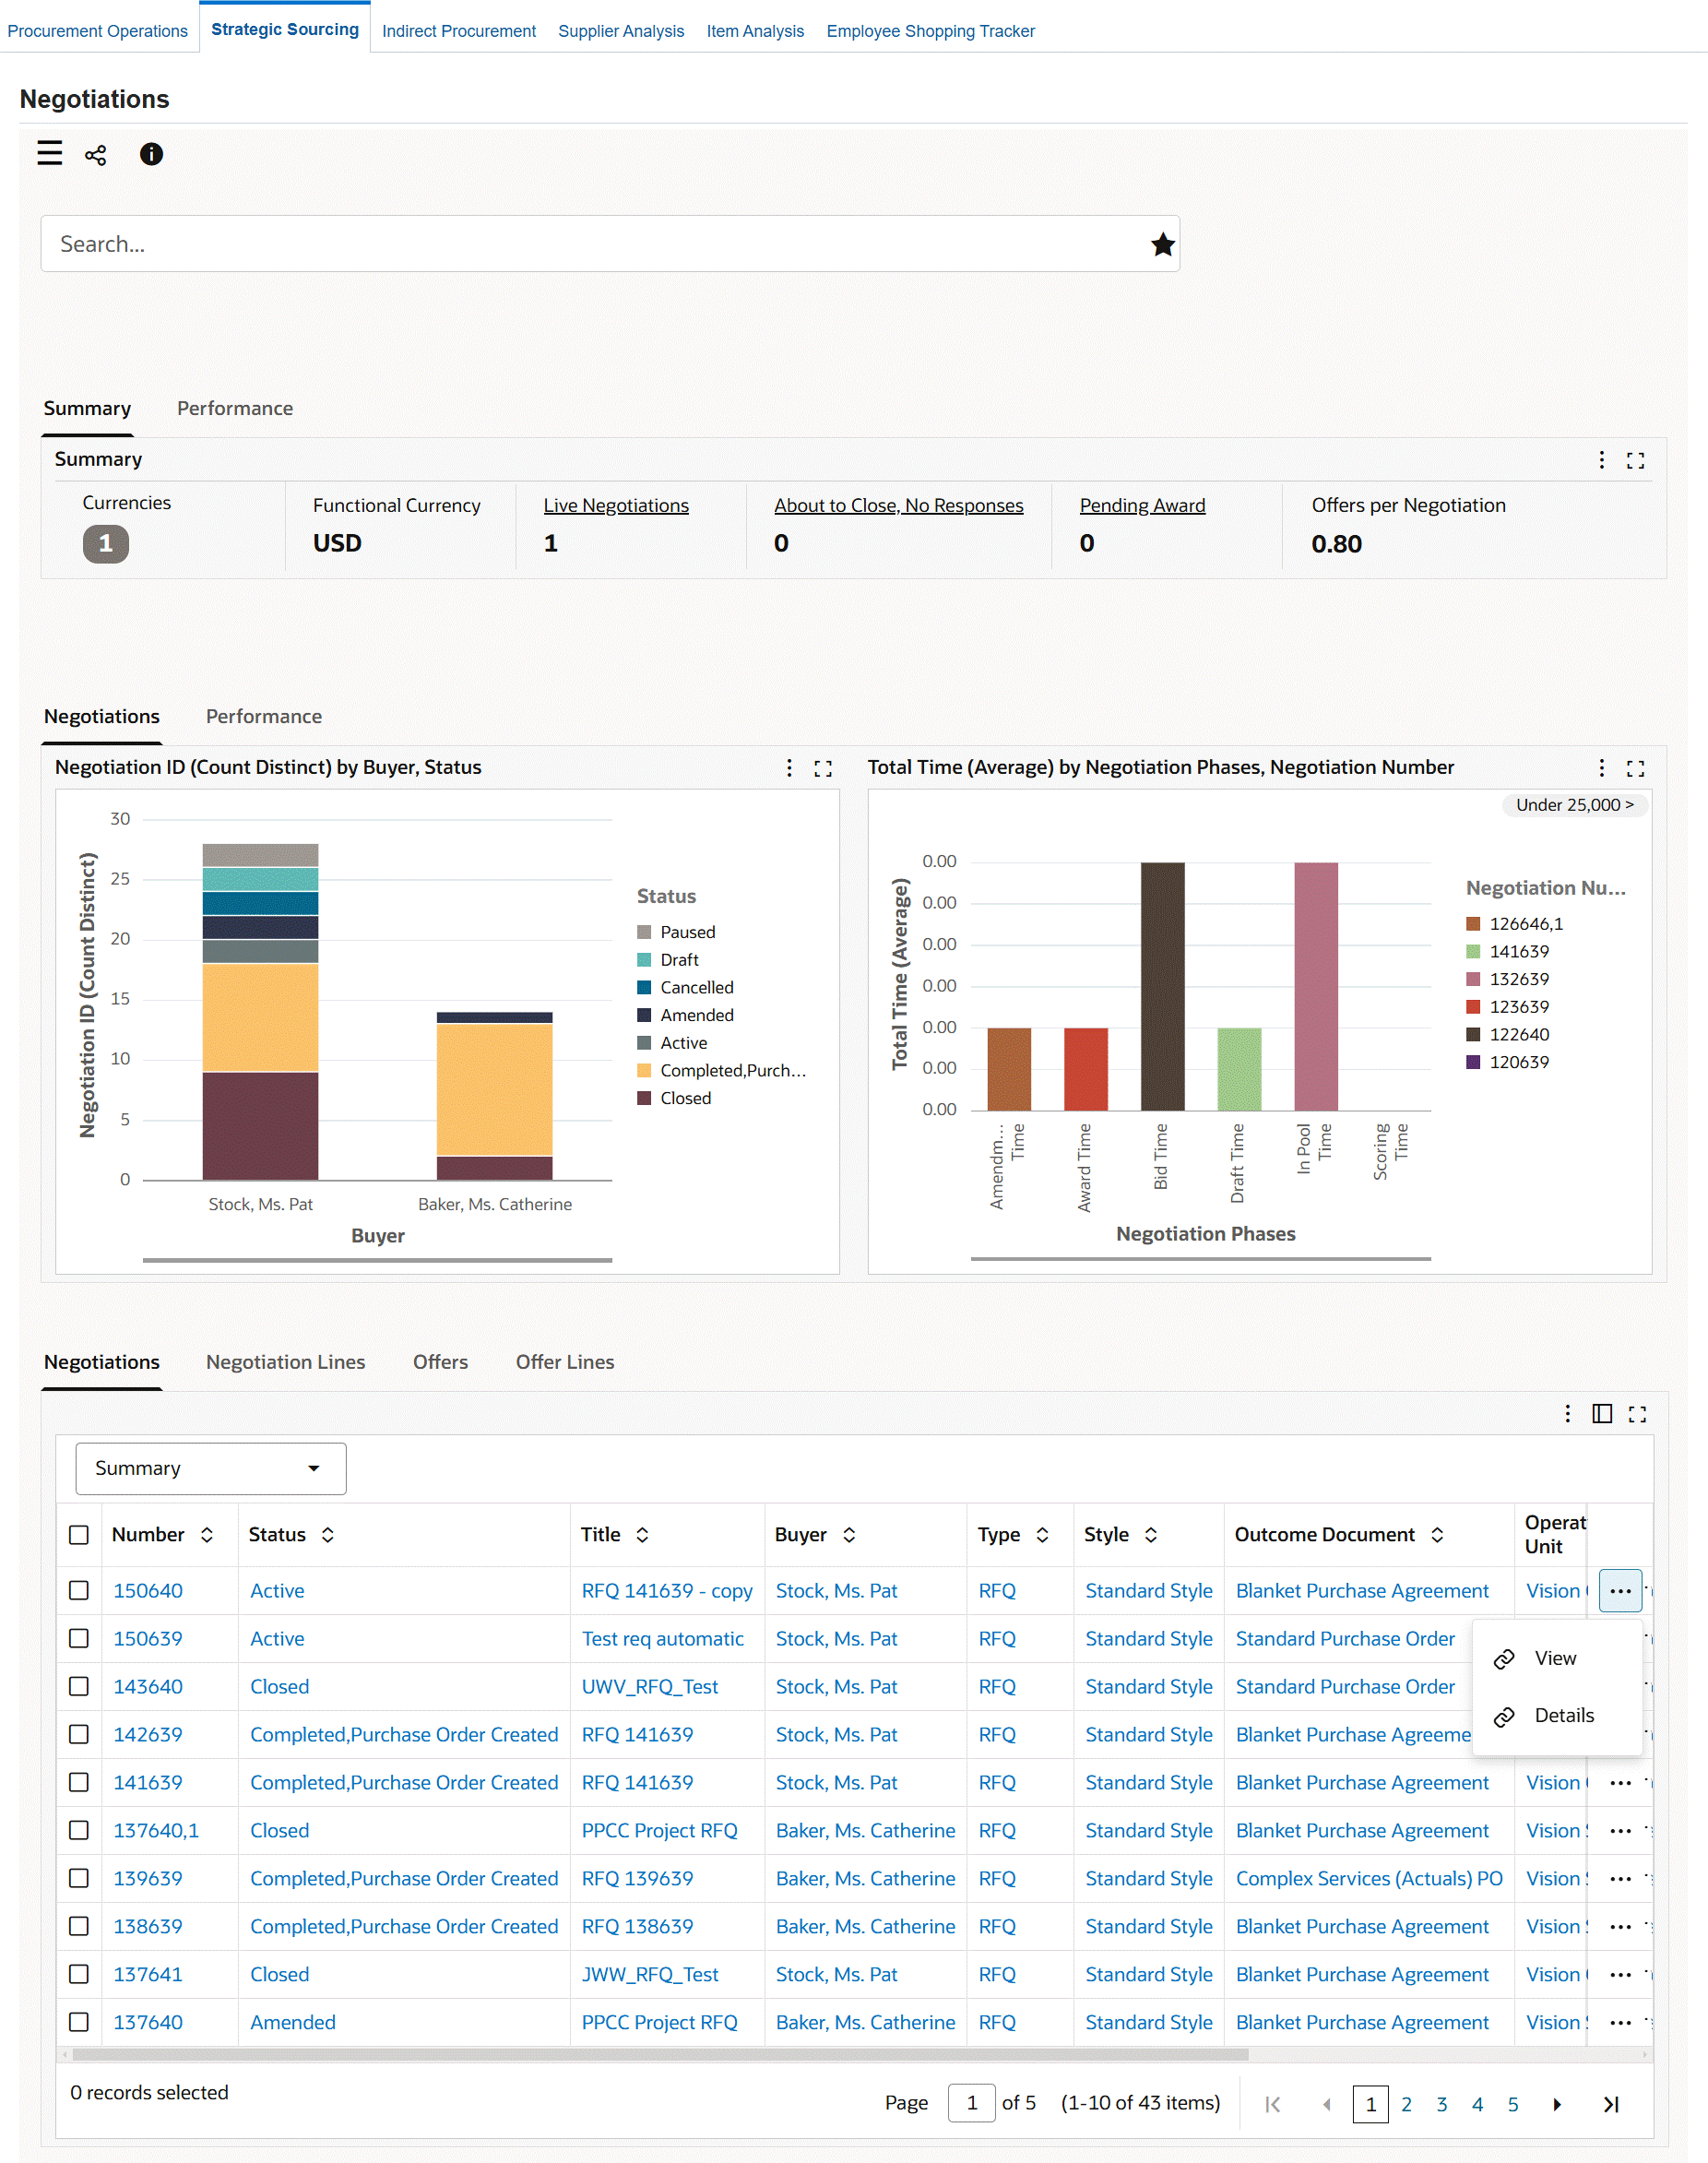
The following table describes the dashboard:
| Component | Description |
|---|---|
| Summary (summary bar) | This summary bar displays currency information and several metrics. To refine dashboard data, including the metrics, by currency, click Currencies and then select a value.
|
| Performance (summary bar) | This bar displays the following metrics:
|
| Negotiations (tab) | This tab contains the following charts. These charts display data only if the data set has one functional currency.
|
| Performance (tab) | This tab contains the following charts. These charts display data only if the data set has one functional currency.
|
| Negotiations, Negotiation Lines, Offers, and Offer Lines (results tables) | These tables display negotiation, offer summaries and details for negotiation lines, and offer lines. To perform the following actions the Negotiations table, click the row-level Actions icon and select an action.
|
| Options (table-level actions) | The following are the common actions that are available from the Options icon in the results tables.
|
Using the Negotiation Details Page
The Negotiation Details page provides comprehensive insight into a specific negotiation.
Important: When you navigate to the Negotiation Details page from the Negotiation results table, the dashboard filters data based on the selected negotiation.
Use the Negotiation Details page to:
-
Review negotiation details such as total lines, suppliers, quotes received, and number of amendments.
-
Review the average time it takes to process a negotiation through different phases.
-
Compare the start price, target price, current price, quote price, and award price for a negotiation.
-
Track details of a negotiation's cycle times.
-
Review negotiation timeline.
Access the Negotiation Details page using the following navigation:
(N) Purchasing > Procurement Command Center > Strategic Sourcing dashboard > Negotiations results table > row-level Actions icon > Details
Negotiation Details Page
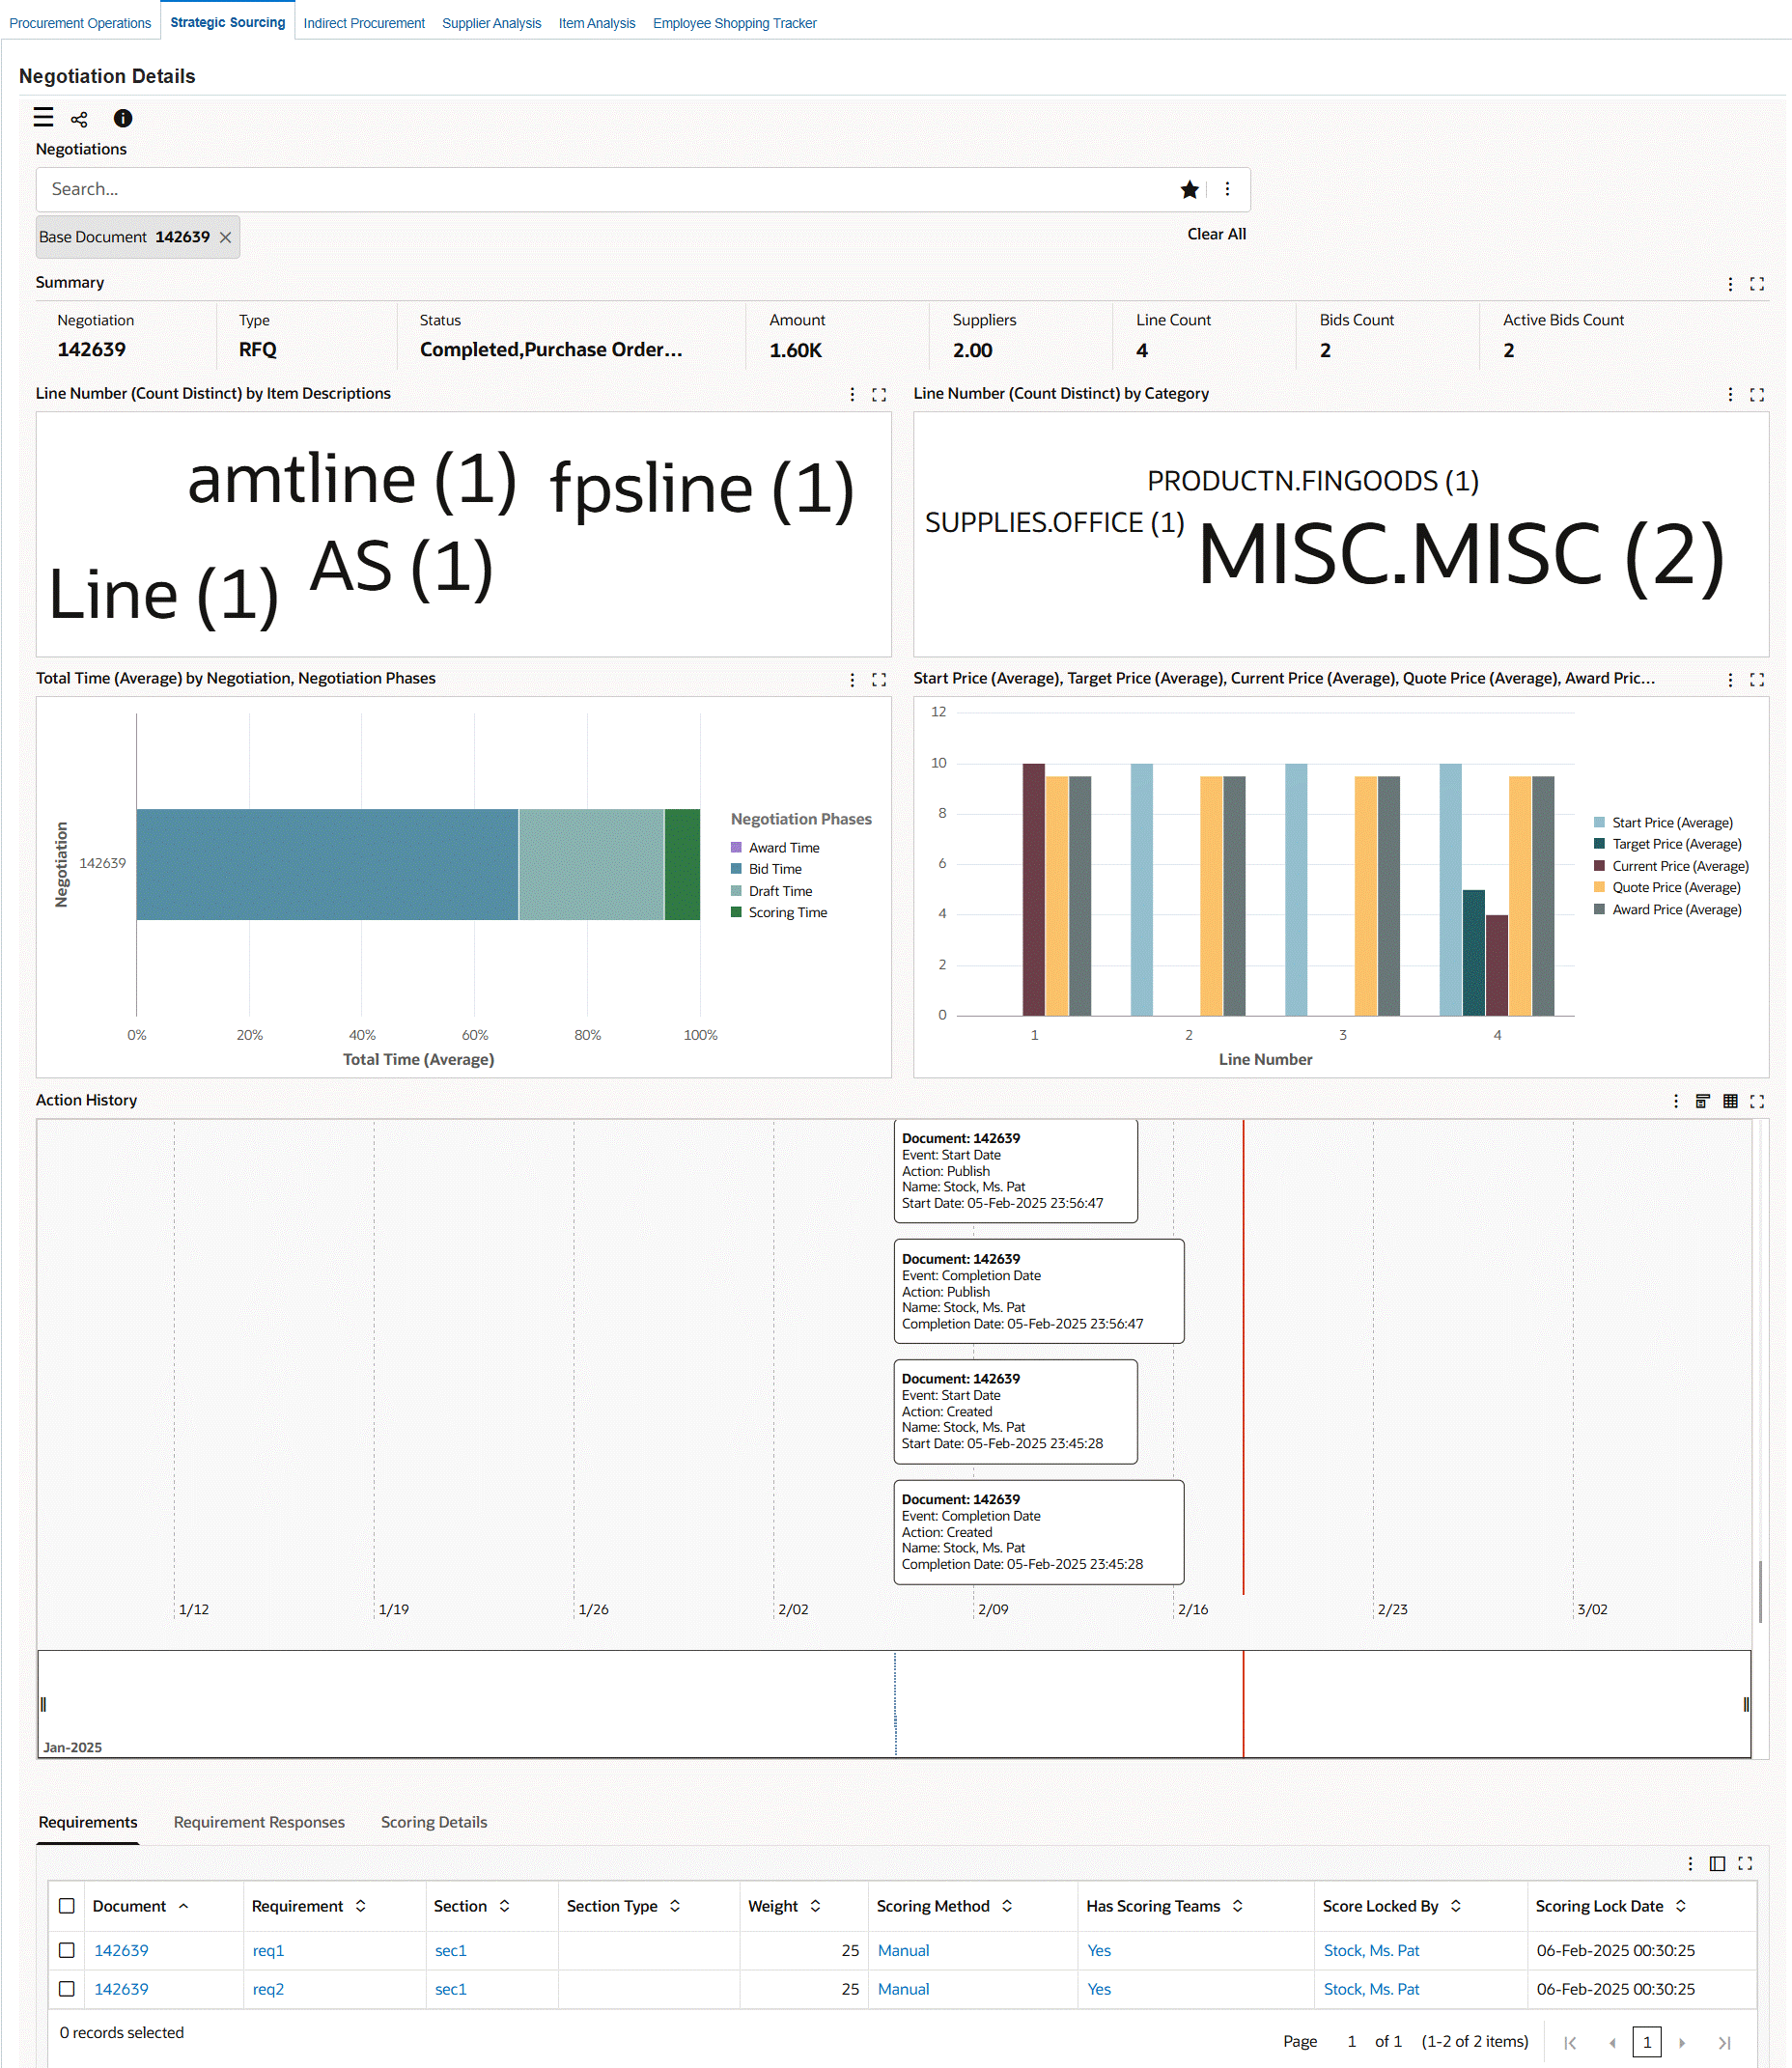
The following table describes the page components:
| Component | Description |
|---|---|
| Summary (metrics) | This summary bar displays the following key metrics for the selected negotiation.
|
| Line Number (Count Distinct) by Item Descriptions (tag cloud) | Each cloud displays the keyword in the item description with the frequency of occurrence in negotiation lines. Click a tag cloud to filter the data based on the relevant tag cloud. |
| Line Number (Count Distinct) by Category (tag cloud) | Each cloud displays an item category with the frequency of occurrence in negotiation lines. Select a different metric to view the negotiation sum tag cloud for each category. The negotiation amount is the negotiation current price. Click a tag cloud to filter the data based on the relevant tag cloud. |
| Total Time (Average) by Negotiation, Negotiation Phases (chart) | This chart shows the average time it takes to process a negotiation through each negotiation phase. |
| Start Price (Average), Target Price (Average), Current Price (Average), Quote Price (Average), Award Price (Average) by Line Number (chart) | This chart compares the start price, target price, current price, quote price, and award price for each line number in the negotiation. You can select a different dimension to view different prices by item description. |
| Action History | You can view the negotiation history details using the following view options:
You can switch between the views using icons. |
| Requirements, Requirement Responses, Scoring Details (results tables) | These tables show the relevant requirements, requirement responses, and scoring details for the negotiation. |
Indirect Procurement Dashboard
See Procurement Command Center Overview.
The Indirect Procurement dashboard enables buyers to analyze the buying behavior of requesters within the organization from orders, agreements, and expense reports.
Use the dashboard to:
-
Review catalogs, item categories, and unused items.
-
Get insight into catalog usage and refine catalog content.
-
Review item ratings and supplier ratings given by requesters for a particular category, operating unit, or cost center and analyze the requester item and supplier ratings with the actual purchase order by quality, on-time delivery, or price compliance.
-
Act on specific feedback coming in from requesters.
-
Review off-contract spend behavior including spend from Oracle iExpenses and identify cost-saving opportunities.
-
Review consumption details for agreements.
-
Perform review and feedback related tasks.
-
Renegotiate terms of agreements and create request for quotation.
Access the Indirect Procurement dashboard using the following navigation:
(N) Purchasing > Procurement Command Center > Indirect Procurement
Note: The dashboard data is always refined to the organizations to which the user has access, and to transactions that match the selected currency.
Indirect Procurement Dashboard
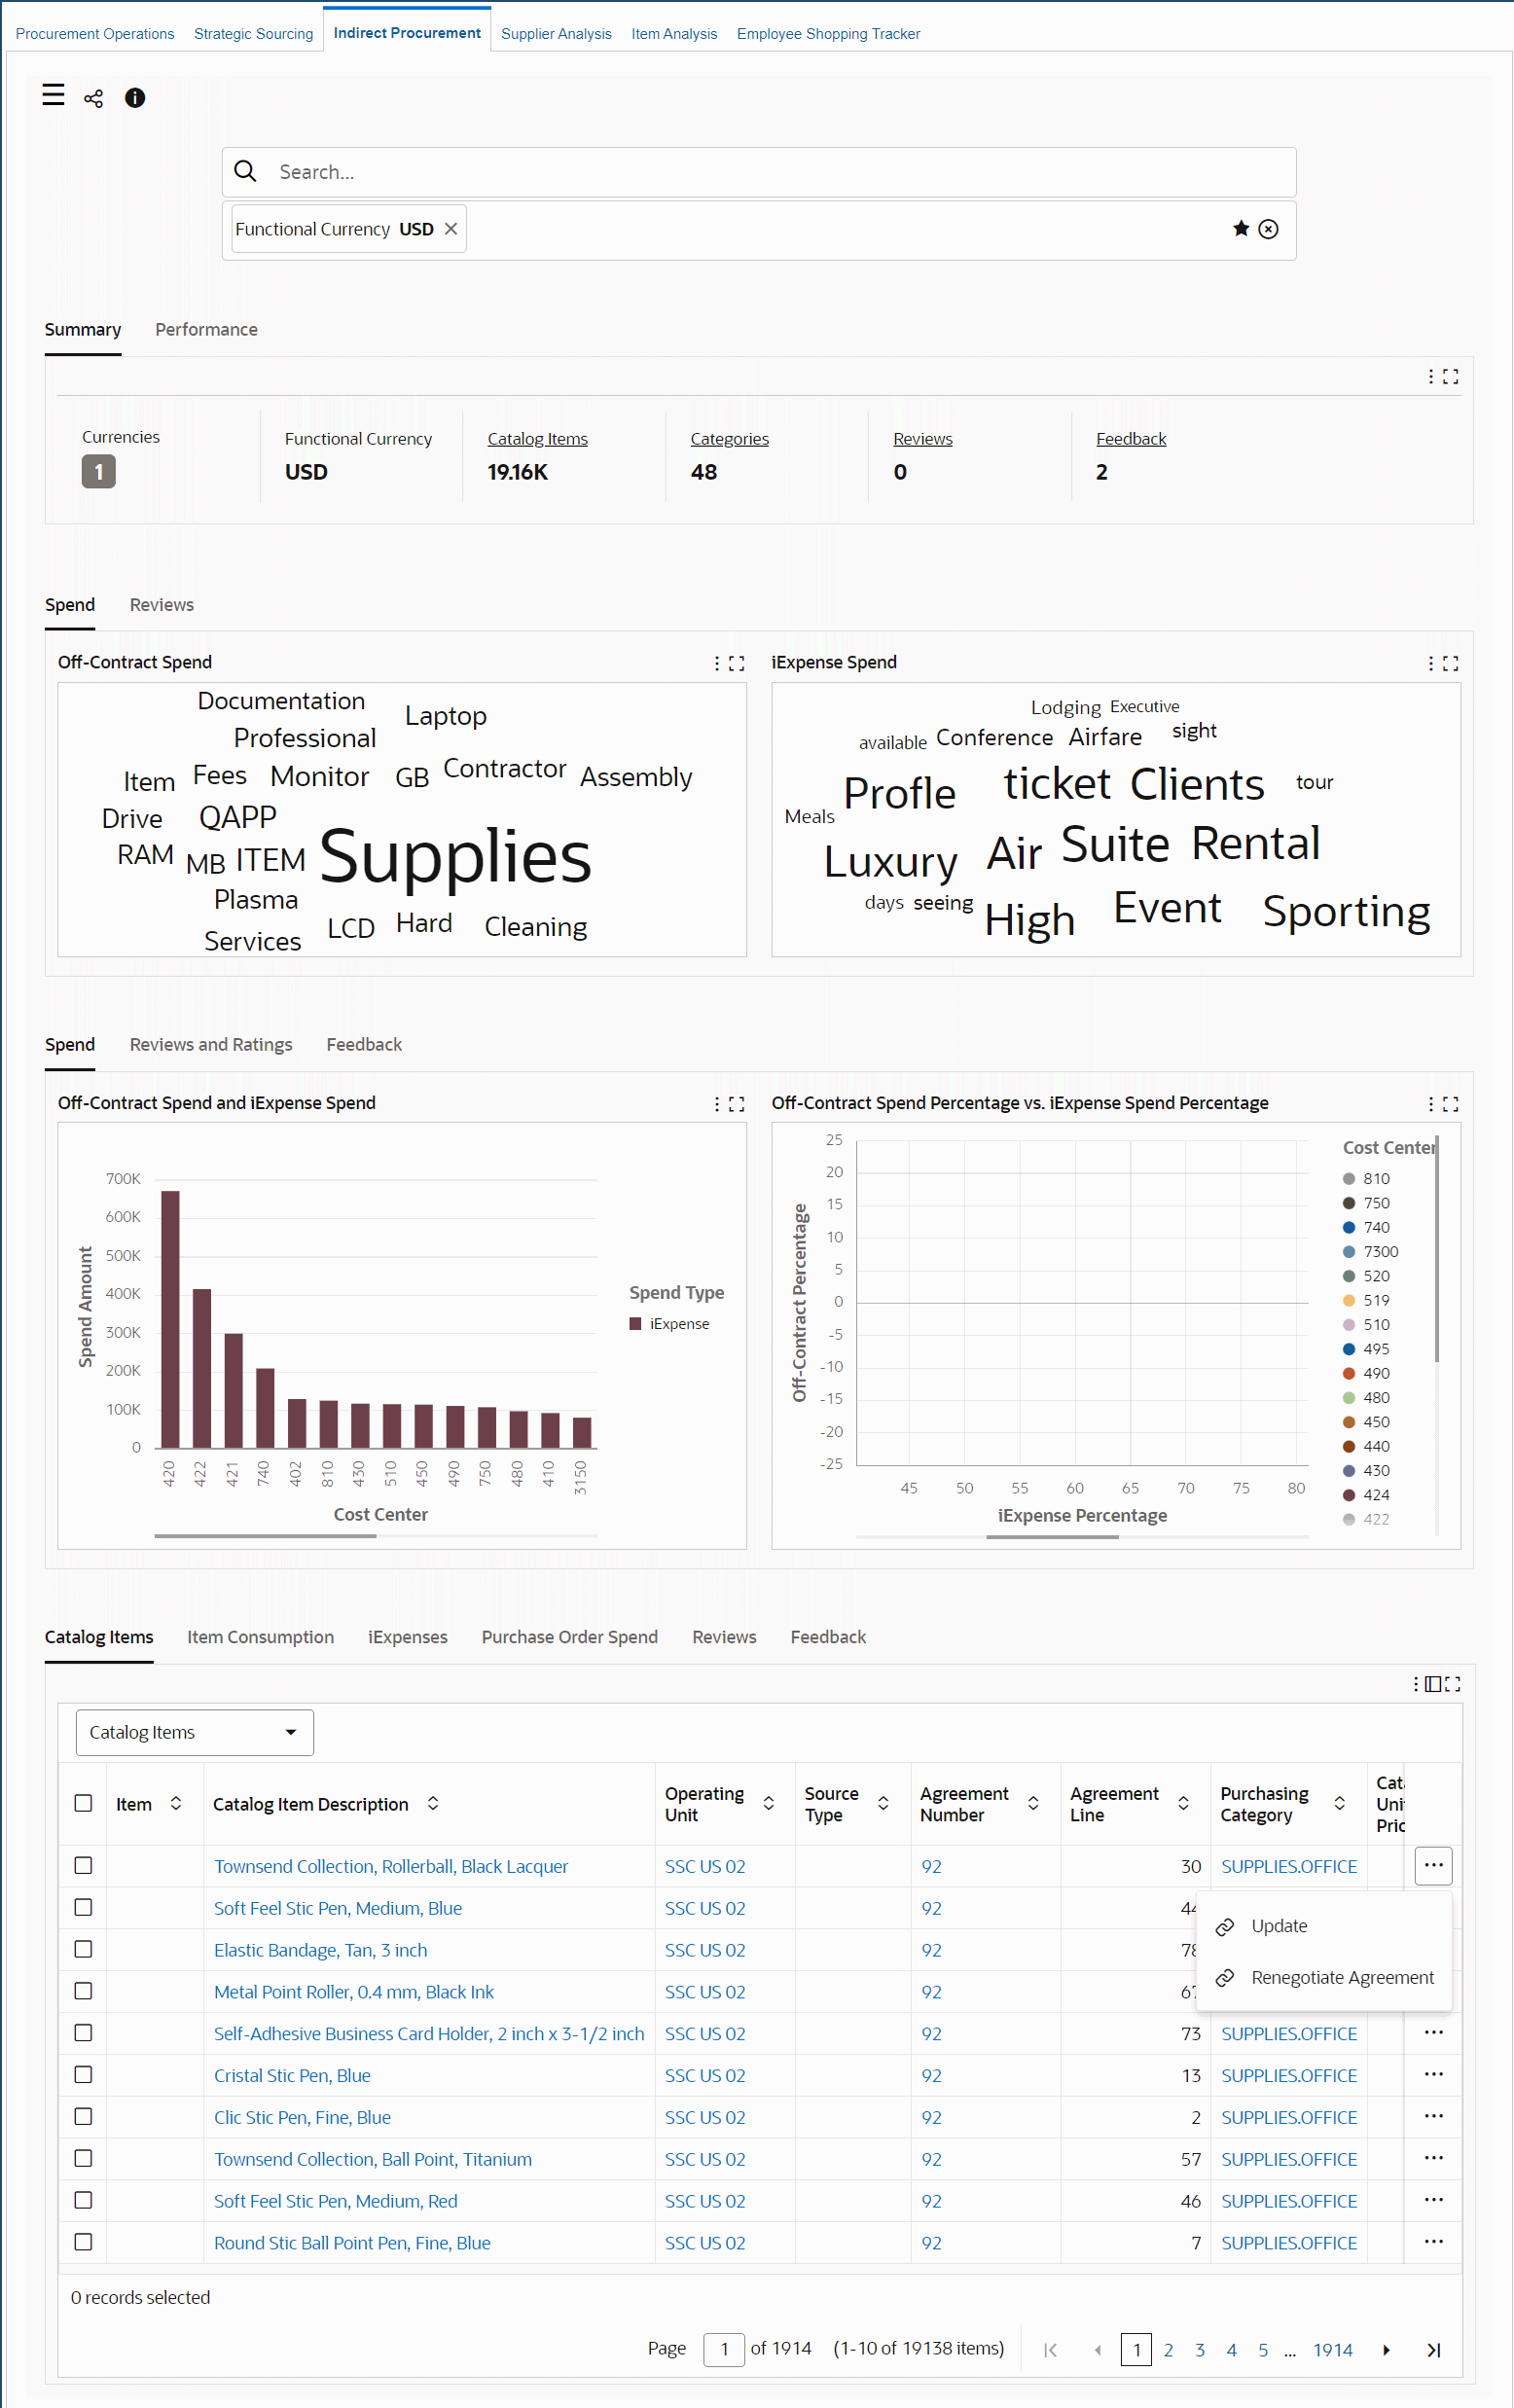
The following table describes the dashboard:
| Component | Description |
|---|---|
| Summary (summary bar) | This summary bar displays currency information and several metrics. To refine dashboard data, including the metrics, by currency, click Currencies and then select a value.
|
| Performance (summary bar) | This bar displays the following metrics:
|
| Spend (tab) | This tab displays the following tag clouds:
|
| Reviews (tab) | This tab displays the following tag clouds. These clouds are not dependent on the functional currency.
|
| Spend (tab) | This tab displays the following charts. These charts display data only if the data set has one functional currency.
|
| Reviews and Ratings (tab) | By default, the Rating Analysis bubble chart shows the average item rating and the average supplier rating for a purchasing category. The bubble size shows the purchase order line amount for the items that have reviews. The group dimensions are purchasing category, supplier, and item. Select an X-axis or a Y-axis metric to view the rating by price compliance percentage, quality percentage, or on-time delivery percentage. The size metrics are rating by review count and purchase order line count.
Note: This chart displays data only when a single functional currency has been selected, and the chart reflects data only for items that have at least one purchase order. |
| Feedback (tab) | The Open Feedback stacked bar chart shows open feedback items by type. The status of the item's feedback must be Open. You can review whether a requester's feedback has open actions or responses. |
| Catalog Items (results table) | This results table provides information about catalog items. Use attribute groups such as catalog source, shopping category, catalog buyer, and line type to view more information about catalog items. To perform the following actions, click the row-level Actions icon and select an action.
|
| Item Consumption (results table) | This table displays an item consumption summary. |
| iExpenses (results table) | This table displays details for iExpense lines that are extracted from invoice information. Use the expense type and invoice date attribute groups to view more information. |
| Purchase Order Spend (results table) | This results table displays item and spend details for purchase orders. Use attribute groups such as line type, off contract, buyer, and ship-to location to view more information. |
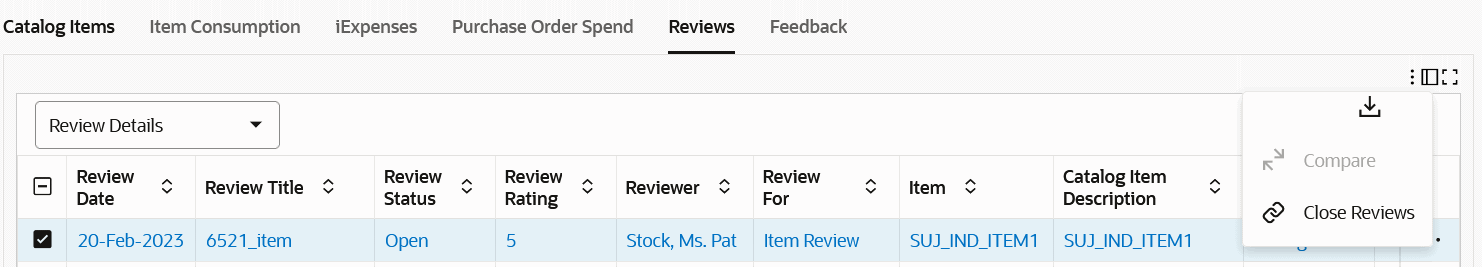
| Reviews (results table) | This table displays additional information for reviews. To perform the following actions, click the row-level Actions icon and select an action.
|
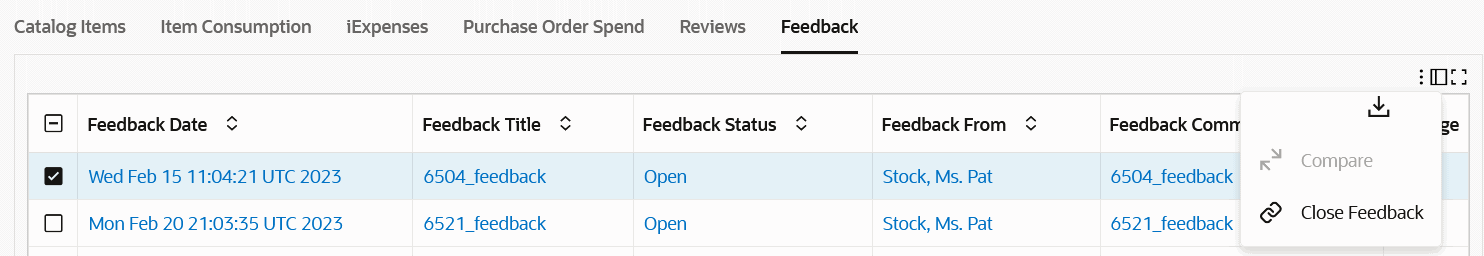
| Feedback (results table) | Feedback is similar to reviews. The primary difference is that the correspondence on a feedback is visible only to the requester who submitted the feedback and all buyers linked to the operating unit in which the feedback is made. To edit or delete a feedback record, click the link icon in the Manage column to navigate to the Oracle iProcurement Feedback page. |
| Options (table-level actions) | See Performing Actions. |
Performing Actions
The following sections describe the actions that you can perform from the Options icon in the results tables.
Common Actions
The following are the common actions that are available from the Options icon in the results tables.
-
Compare: Select multiple rows to compare information.
-
Export: Use this action to export the search results in a comma-separated values (CSV) file.
The following table describes the actions available when you select the Options icon in the results tables. Select one or more rows and click the Options icon to act on your selection.
Reviews Tab Actions
Feedback Tab Actions
| Results Table | Action | Description |
|---|---|---|
| Reviews | Close Reviews | Use this action to close review comments. You view a confirmation message when you close a review. If you try to close a review that is already in the Close status, then the application displays an error message. |
| Feedback | Close Feedback | Use this action to close feedback records. You can view a confirmation message when you close a feedback. If you try to close a feedback that is already in the Close status, then the application displays an error message. |
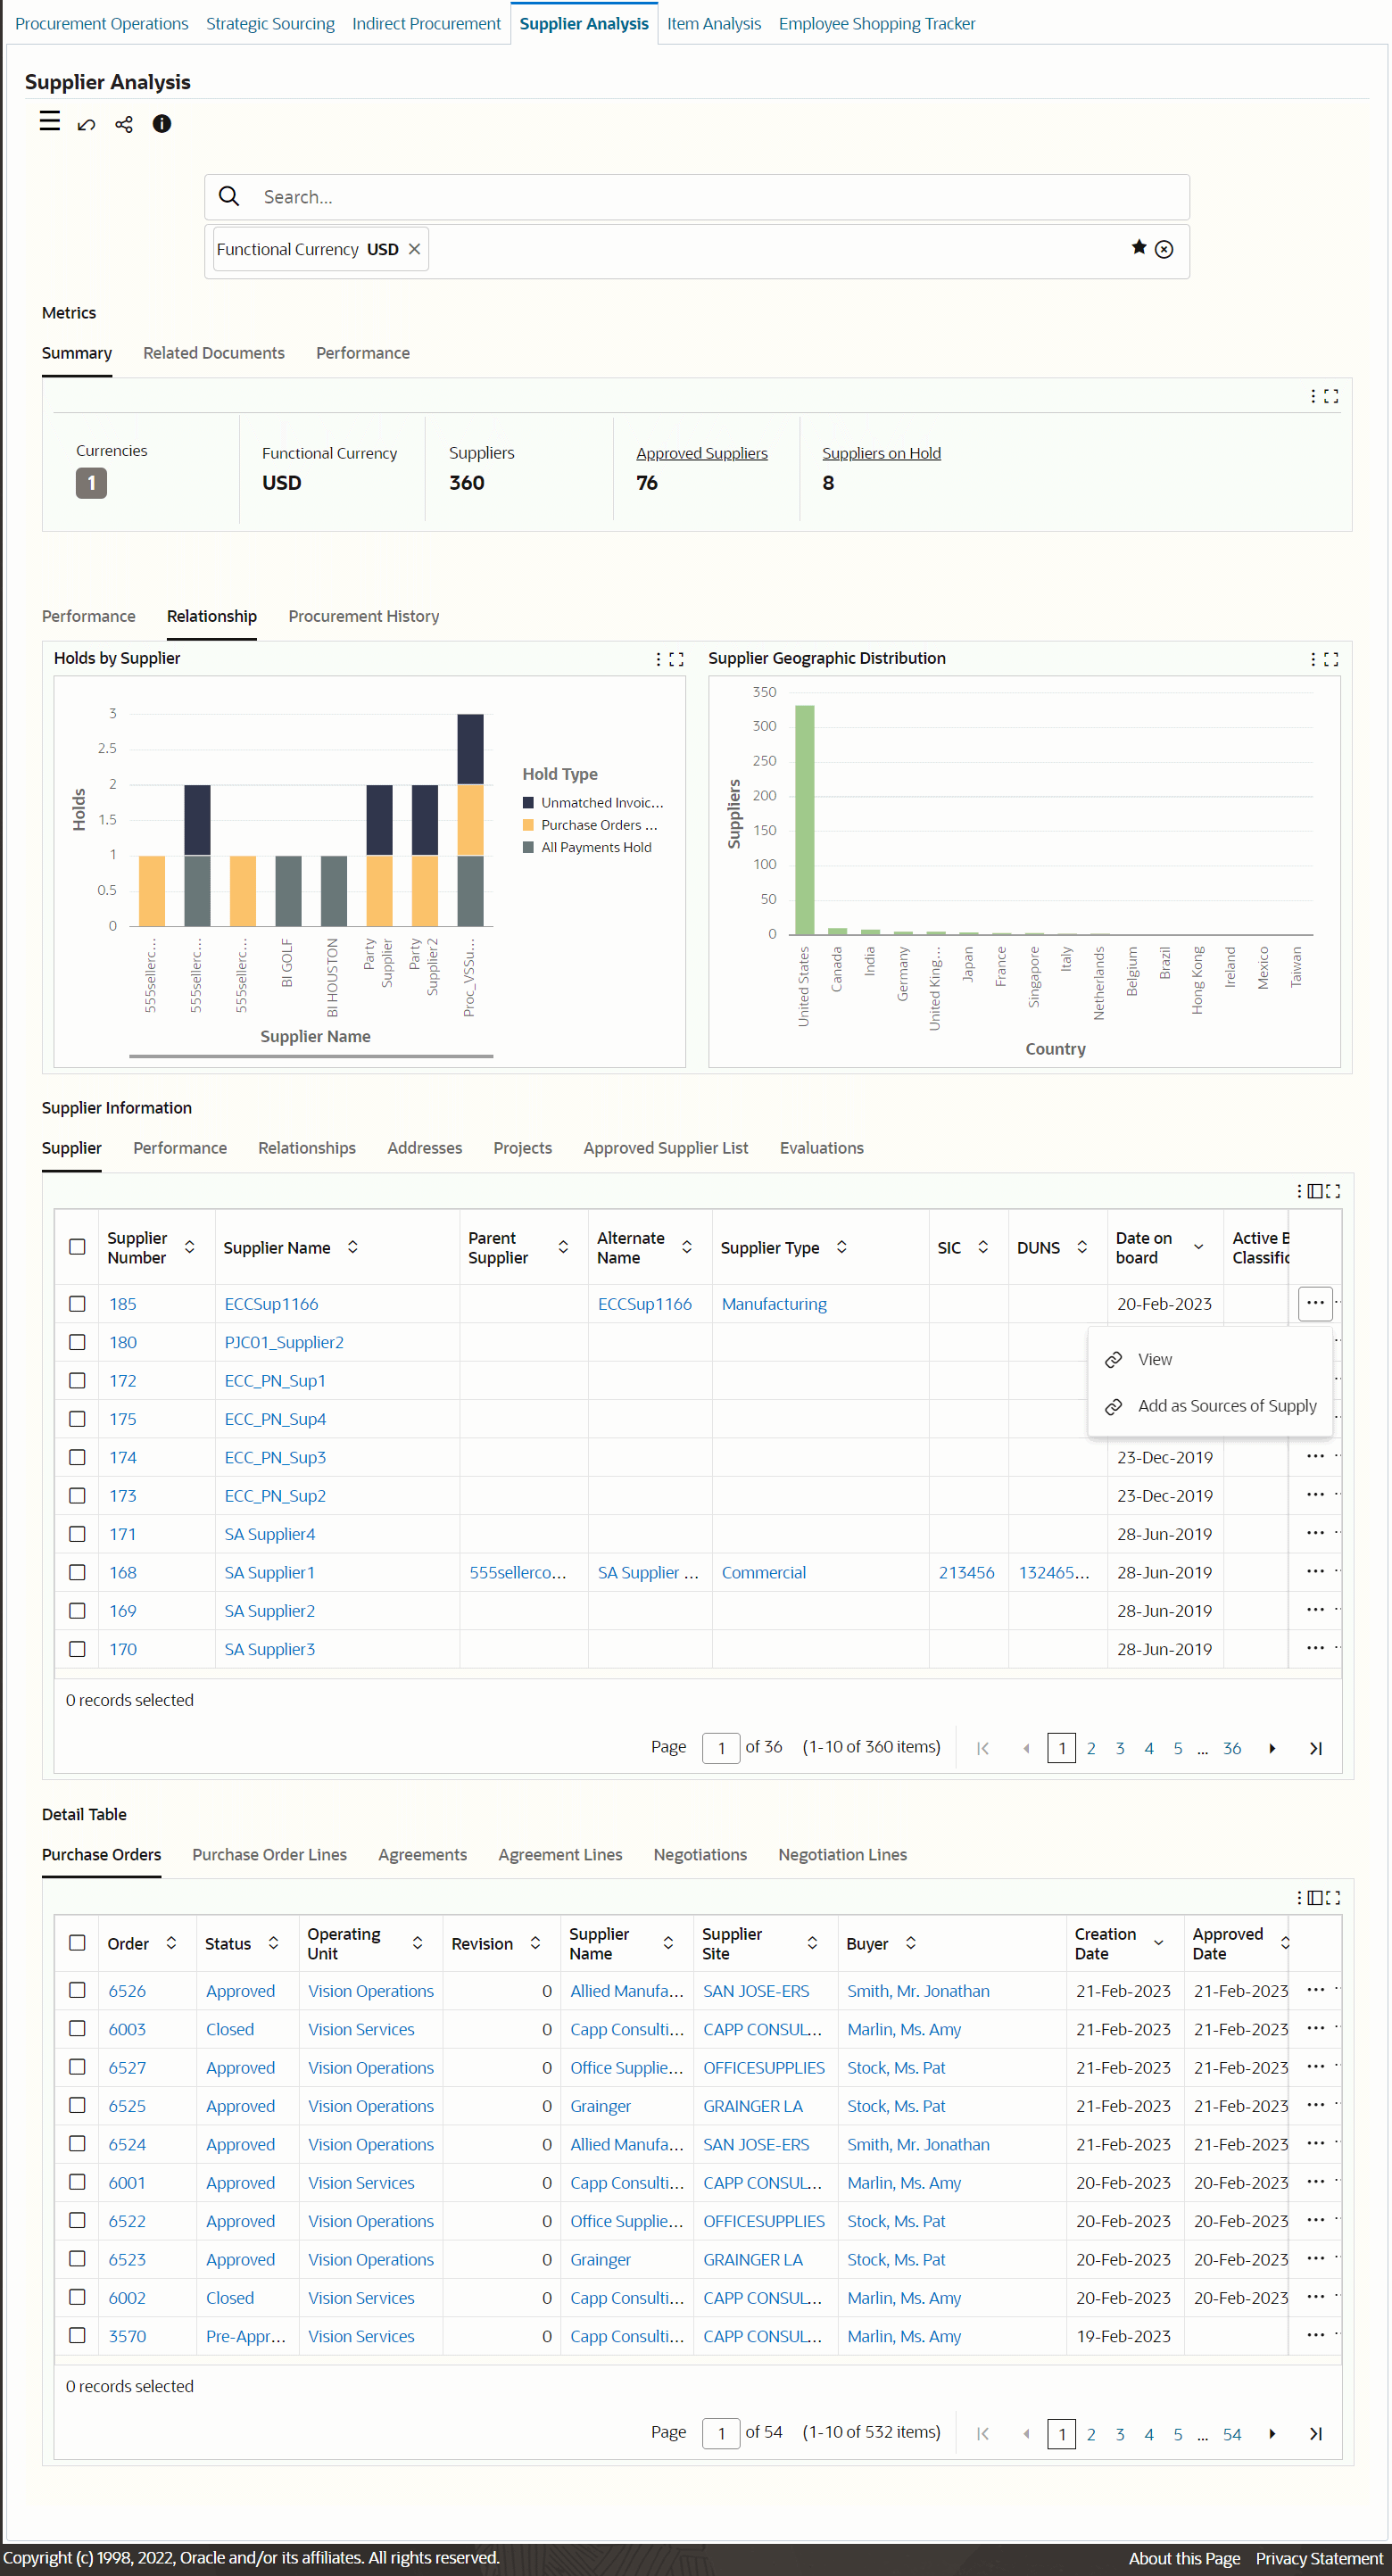
Supplier Analysis Dashboard
To perform supplier analysis, procurement teams, and buyers require supplier history for goods or services. supplier analysis involves looking into a supplier's product and service offerings, performance including on-time delivery, quality, and supplier capabilities.
The Supplier Analysis dashboard is available from the following command centers:
-
Project Procurement Command Center
-
Procurement Command Center
The following table lists the command centers, responsibilities, and the roles to which the dashboard is available.
| Command Center | Role | Responsibility | Additional Information |
|---|---|---|---|
| Project Procurement Command Center | Project buyer, project manager | Project Procurement ECC (Buyer), Command Center
Note: This dashboard is available to project managers from the Analyze Supplier link in the Plan Lines tab of the Procurement Plan dashboard. The dashboard shows the item information in the context of a procurement plan line. |
Analyze suppliers who can supply items or services for a project and fulfill orders for project procurement plan lines |
| Procurement Command Center | Procurement team member, buyer | Purchasing, Procurement Command Center
Note: This dashboard is also available from the Analyze Supplier link in the Requisitions tab of the Procurement Operations dashboard. The dashboard shows the item information in the context of a requisition line. |
Analyze suppliers who can supply items or services for requisition lines |
Use the dashboard to:
-
Investigate each supplier's history.
-
Review the current status of a supplier, including orders or any existing agreements with a supplier.
-
Review how much has been spent or is committed to be spent with the supplier and how well the supplier has performed with regards to supplying the ordered items or services.
-
-
Gain insight into the performance of suppliers including on-time delivery, quality, and price-compliance trends of the supplier.
-
Compare suppliers by current relationship and historical performance.
-
Use performance criteria and extended supplier profile to zero in on the best set of suppliers.
-
Find the right suppliers to meet organizational objectives and business needs.
Note: The dashboard data is always refined to the organizations to which the user has access, and to transactions that match the selected currency.
Procurement Command Center: Supplier Analysis Dashboard
Project Procurement Command Center: Supplier Analysis Dashboard
The following table describes the dashboard:
| Component | Description |
|---|---|
| Summary (summary bar) | This summary bar displays currency information and several metrics. To refine dashboard data, including the metrics, by currency, click Currencies and then select a value.
|
| Related Documents (summary bar) | This bar displays the following metrics:
|
| Performance (summary bar) | This bar displays the following metrics:
|
| Performance (tab) | This tab displays the following charts:
|
| Relationship (tab) | This tab displays the following charts:
|
| Procurement History (tab) | This tab displays the following charts:
|
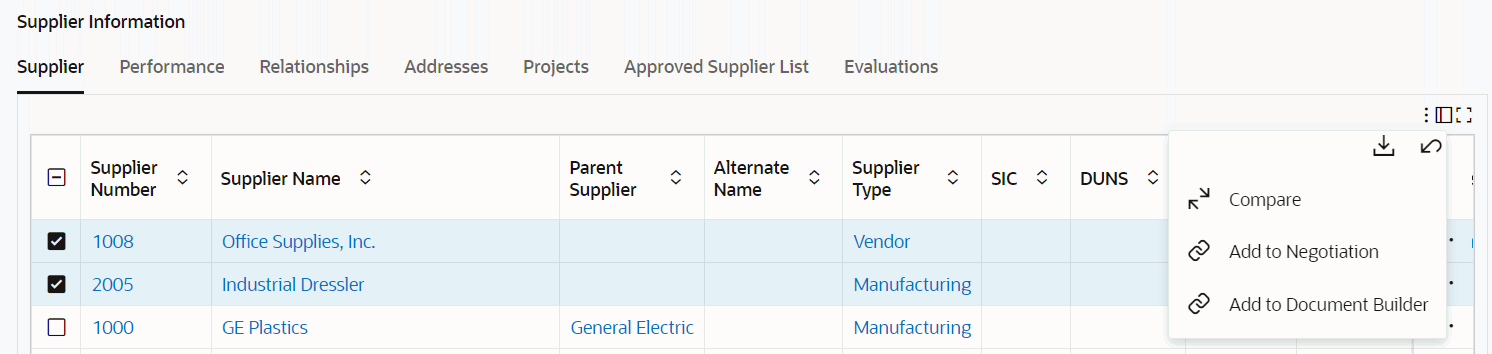
| Supplier Information (tabbed component) Supplier (results table) |
This table shows details for suppliers. To perform the following actions, click the row-level Actions icon and select an action.
|
| Supplier Information (tabbed component) Performance (results table) |
This table shows the performance of suppliers including information such as the on-time delivery rating and quality rating. |
| Supplier Information (tabbed component) Relationships (results table) |
This table shows the active purchase orders, blanket purchase agreements, and negotiations. Additionally, it displays holds applied on active documents, total count of orders, total spend, number of negotiations in which a selected supplier participated, negotiations in which the selected supplier was awarded, average spend per year, receipt and use details. |
| Supplier Information (tabbed component) Addresses (results table) |
This table shows the details of suppliers. |
| Supplier Information (tabbed component) Projects (results table) |
This table shows the projects for which the supplier is associated to a purchasing document. |
| Supplier Information (tabbed component) Approved Supplier List (results table) |
This table shows the ASL approval status, the item, supplier category, and manufacturer details of approved suppliers. |
| Supplier Information (tabbed component) Evaluations (results table) |
To review a supplier's performance, click the link icon in the View column to open the Assessment page for that supplier. |
| Detail Table (tabbed component) Purchase Orders (results table) |
To perform the following actions, click the row-level Actions icon and select an action.
If you try this action without having a requisition line in context, then the dashboard displays an error. If the requisition line is valid, then you can add the requisition line to the purchase order. |
| Detail Table (tabbed component) Purchase Order Lines (results table) |
This table summarizes purchase order lines information and enables you to track the quantity details for orders. |
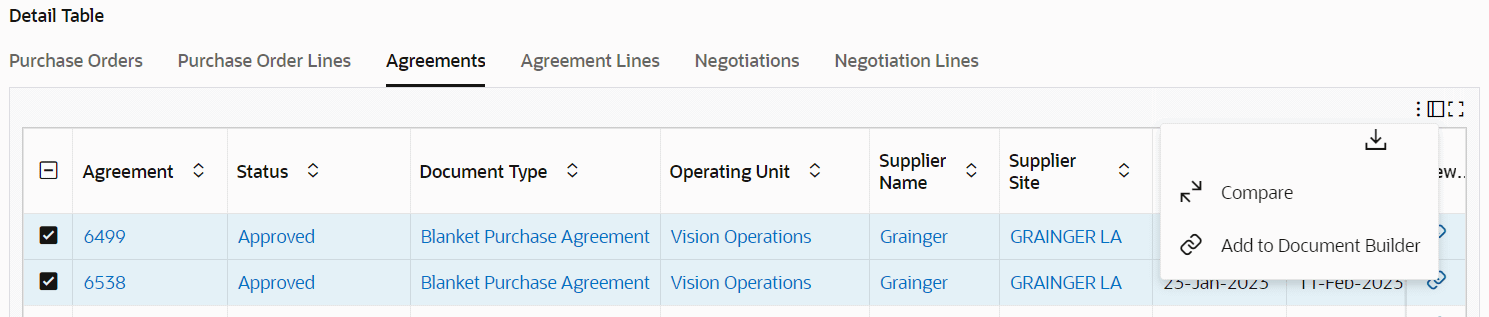
| Detail Table (tabbed component) Agreements (results table) |
To view details for an agreement, click the link icon in the View column to open the agreement document in Oracle Purchasing. |
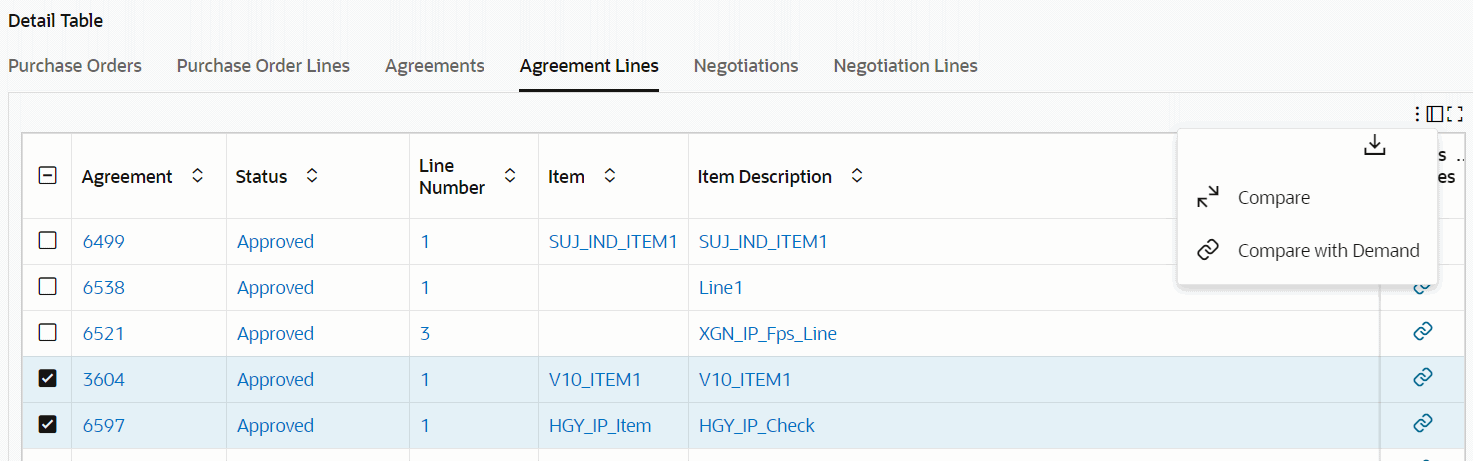
| Detail Table (tabbed component) Agreement Lines (results table) |
The Add as Sources of Supply action is applicable to project buyers using the Project Procurement Command Center. When you click the link icon in the Add as Sources of Supply column for an agreement line, the Create Sources of Supply page appears. See Creating Sources of Supply. |
| Detail Table (tabbed component) Negotiations (results table) |
To perform the following actions, click the row-level Actions icon and select an action.
If you try this action without having a requisition line in context, then the dashboard displays an error. If the requisition line is valid, then you can add the requisition line to the negotiation along with the supplier. |
| Detail Table (tabbed component) Negotiation Lines (results table) |
This table summarizes details for negotiation lines and the price information. |
| Options (table-level actions) | See Performing Actions. |
Performing Actions
The following sections describe the actions that you can perform from the Options icon in the results tables.
Common Actions
The following are the common actions that are available from the Options icon in the results tables.
-
Compare: Select multiple rows to compare information.
-
Export: Use this action to export the search results in a comma-separated values (CSV) file.
The following table describes the actions available when you select the Options icon in the results tables. Select one or more rows and click the Options icon to act on your selection.
Supplier Tab Actions
Agreements Tab Actions
Agreement Lines Tab Actions
| Results Table | Action | Description |
|---|---|---|
| Suppliers | Add to Negotiation | The starting point for this action is the creation of a request for quote (RFQ) in Oracle Sourcing. Create an RFQ to be able to add suppliers. For a negotiation that is at the Draft status, you can add suppliers to the negotiation from the Sourcing pages using the Add Suppliers button. This brings you to the Supplier Analysis page. Analyze the suppliers, select them, and then add them using the Add to Negotiation action. If you delete the negotiation line after creating it through the Document Builder, then the application removes the linkage of the negotiation line as a source of supply. During the award completion stage, the application updates the sources of supply when a particular negotiation line is awarded to a supplier or multiple suppliers. |
| Suppliers | Add to Document Builder | Use this action to add suppliers to requisition lines using the Document Builder. |
| Agreements | Add to Document Builder | Use this action to add multiple agreements (contract purchase agreements and blanket purchase agreements) to the Document Builder. When you add an agreement, the action automatically brings in suppliers too. |
| Agreement Lines | Compare with Demand | This action is applicable to project buyers who are analyzing suppliers using Project Procurement Command Center. See Project Procurement Dashboard. Use this action to compare agreement lines with procurement plan lines. If plan lines are not available, then the dashboard displays an error. The basic requirements for comparison are as follows:
If you do not want to retain the context of the plan line, then you can click Remove to remove the plan line context. |
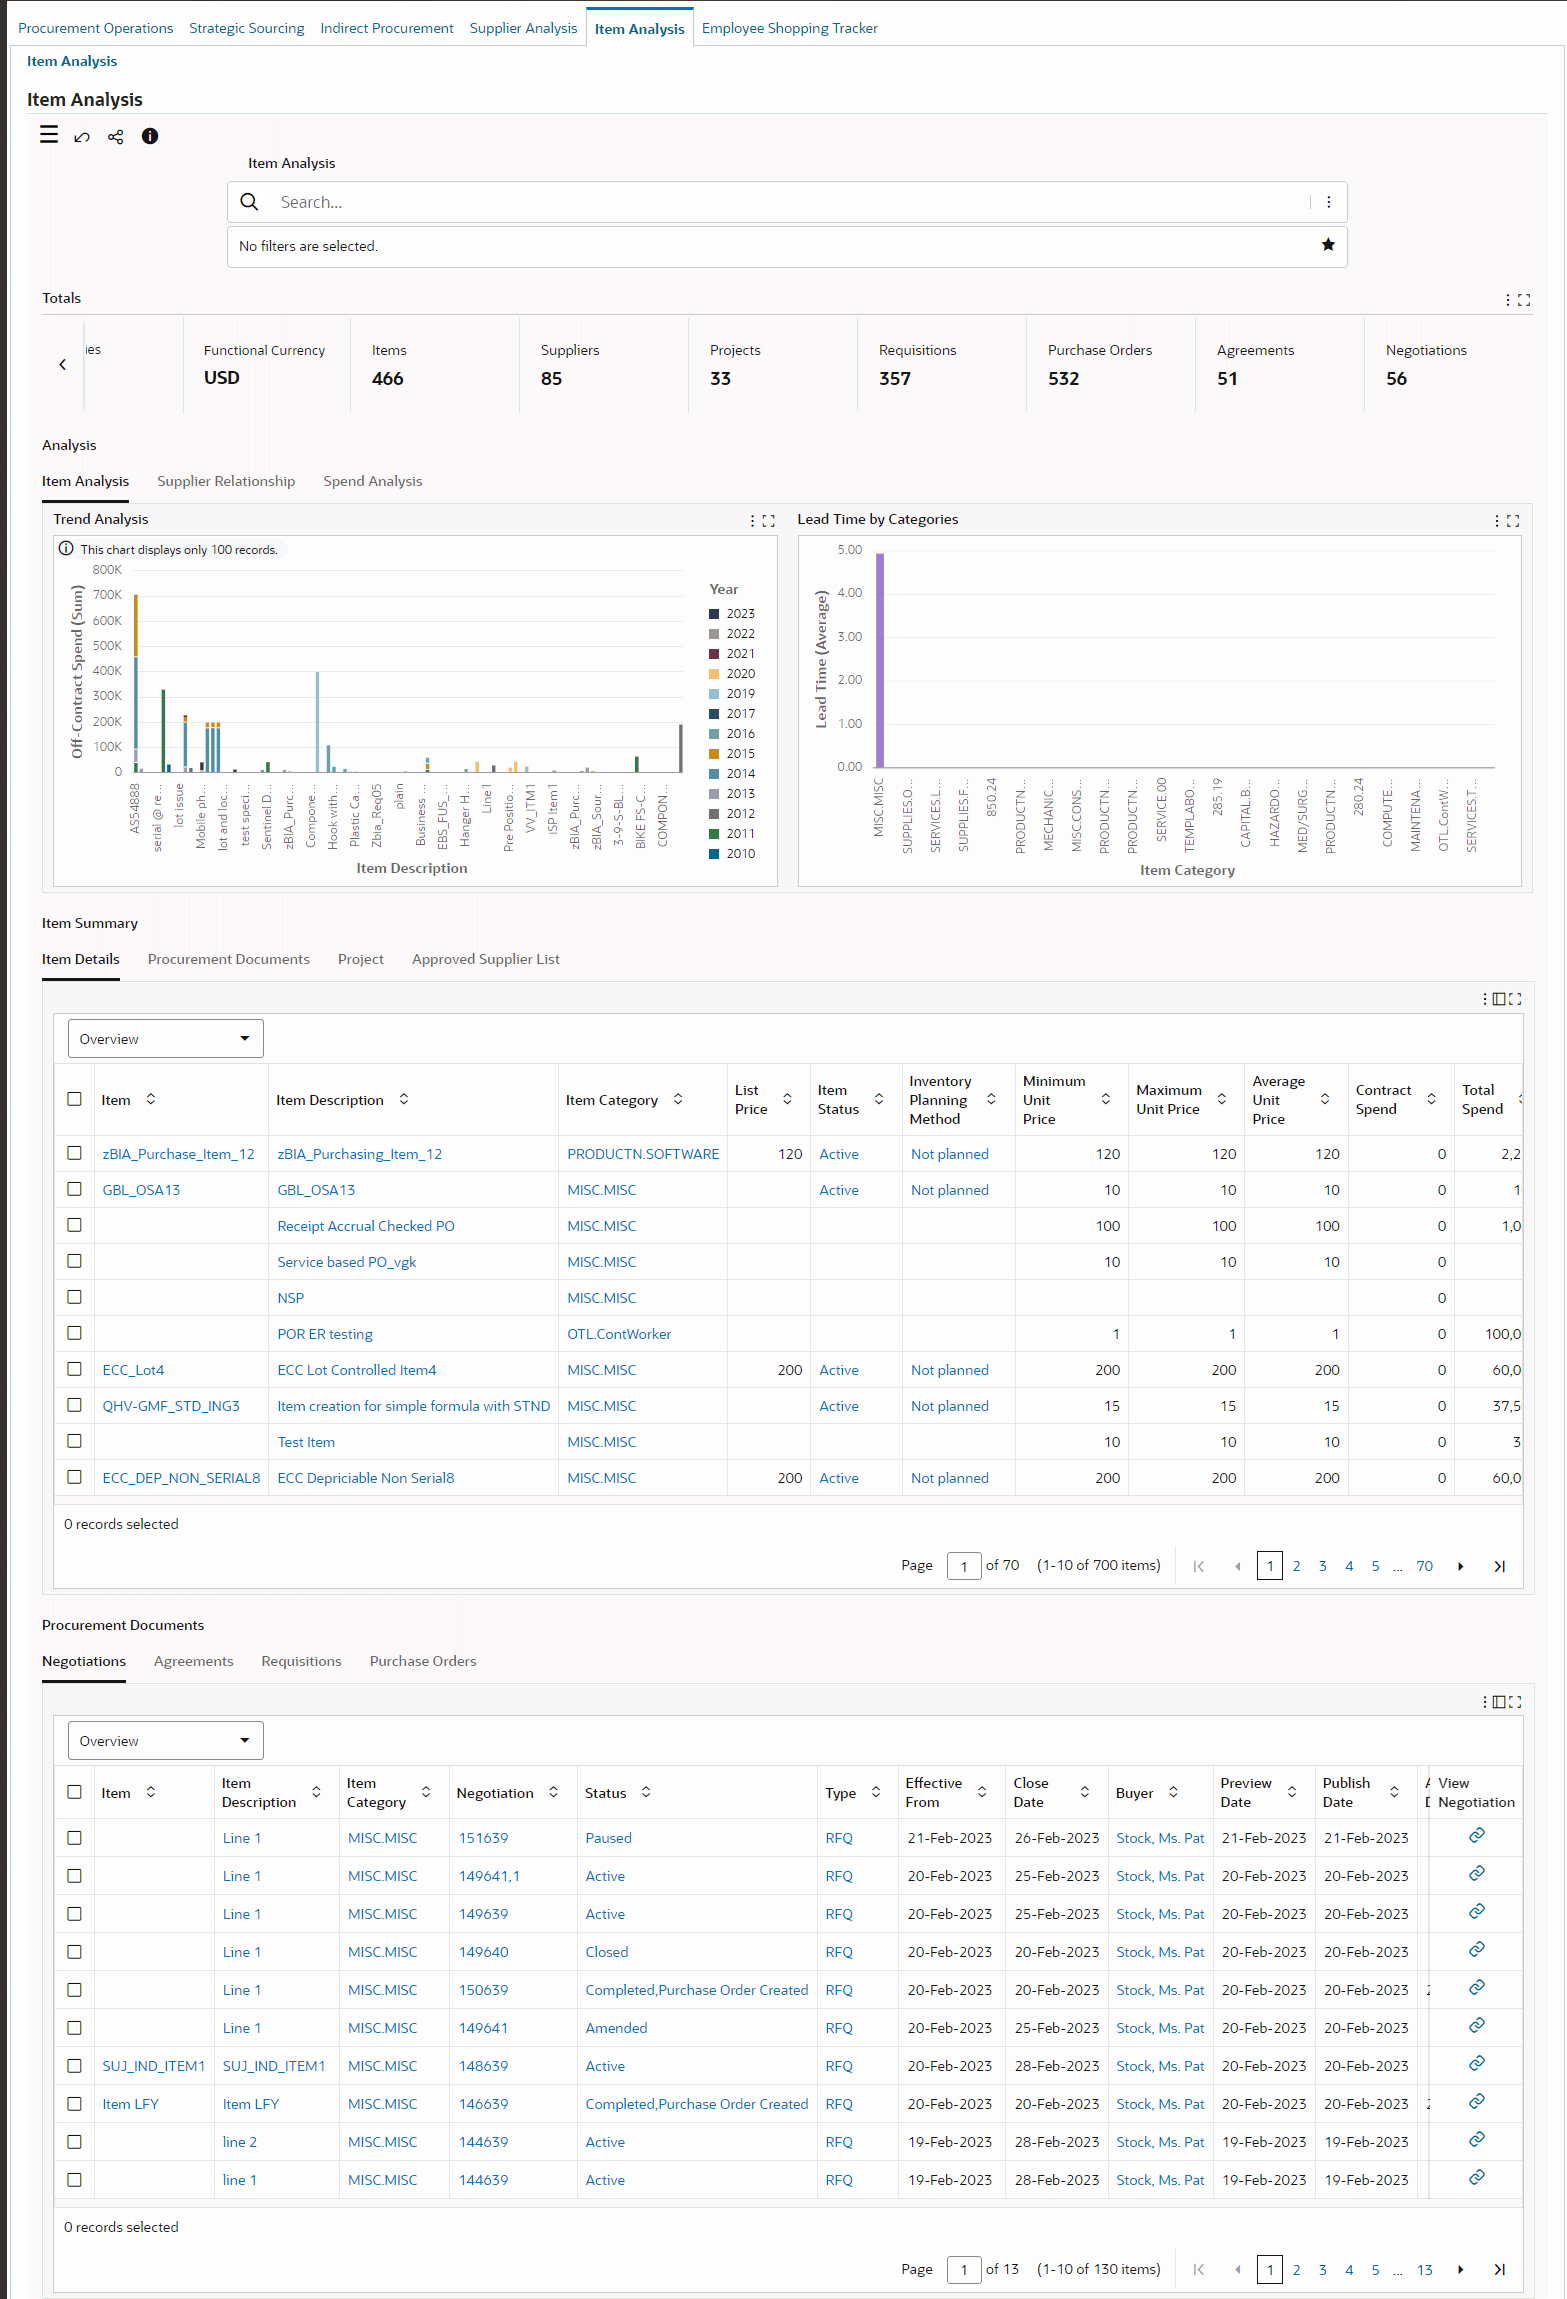
Item Analysis Dashboard
The Item Analysis dashboard is centered upon items that have been ordered for procurement.
The Item Analysis dashboard is available from the following command centers:
-
Project Procurement Command Center
-
Procurement Command Center
The following table lists the command centers, responsibilities, and the roles to which the dashboard is available.
| Command Center | Role | Responsibility | Additional Information |
|---|---|---|---|
| Project Procurement Command Center | Project buyer, project manager | Project Procurement ECC (Buyer), Command Center
Note: This dashboard is available to project managers from the Analyze Item link in the Plan Lines tab of the Procurement Plan dashboard. The dashboard shows the item information in the context of a procurement plan line. |
Analyze items or services assigned to project plan lines |
| Procurement Command Center | Procurement team member, buyer | Purchasing, Procurement Command Center
Note: This dashboard is also available from the Analyze Item link in the Requisitions tab of the Procurement Operations dashboard. The dashboard shows the item information in the context of a requisition line. |
Analyze items or services assigned to requisition lines |
Use the dashboard to:
-
Explore the history of items used in the organization including on-time delivery, quality, and item suitability.
-
Compare items based on the supply source, approved supplier lists, and existing agreements.
-
Align item selection to business needs using insights from procurement history.
-
Make an informed item choice by comparing procurement history and performance attributes for each item.
Note: The dashboard data is always refined to the organizations to which the user has access, and to transactions that match the selected currency.
Procurement Command Center: Item Analysis Dashboard
Project Procurement Command Center: Item Analysis Dashboard
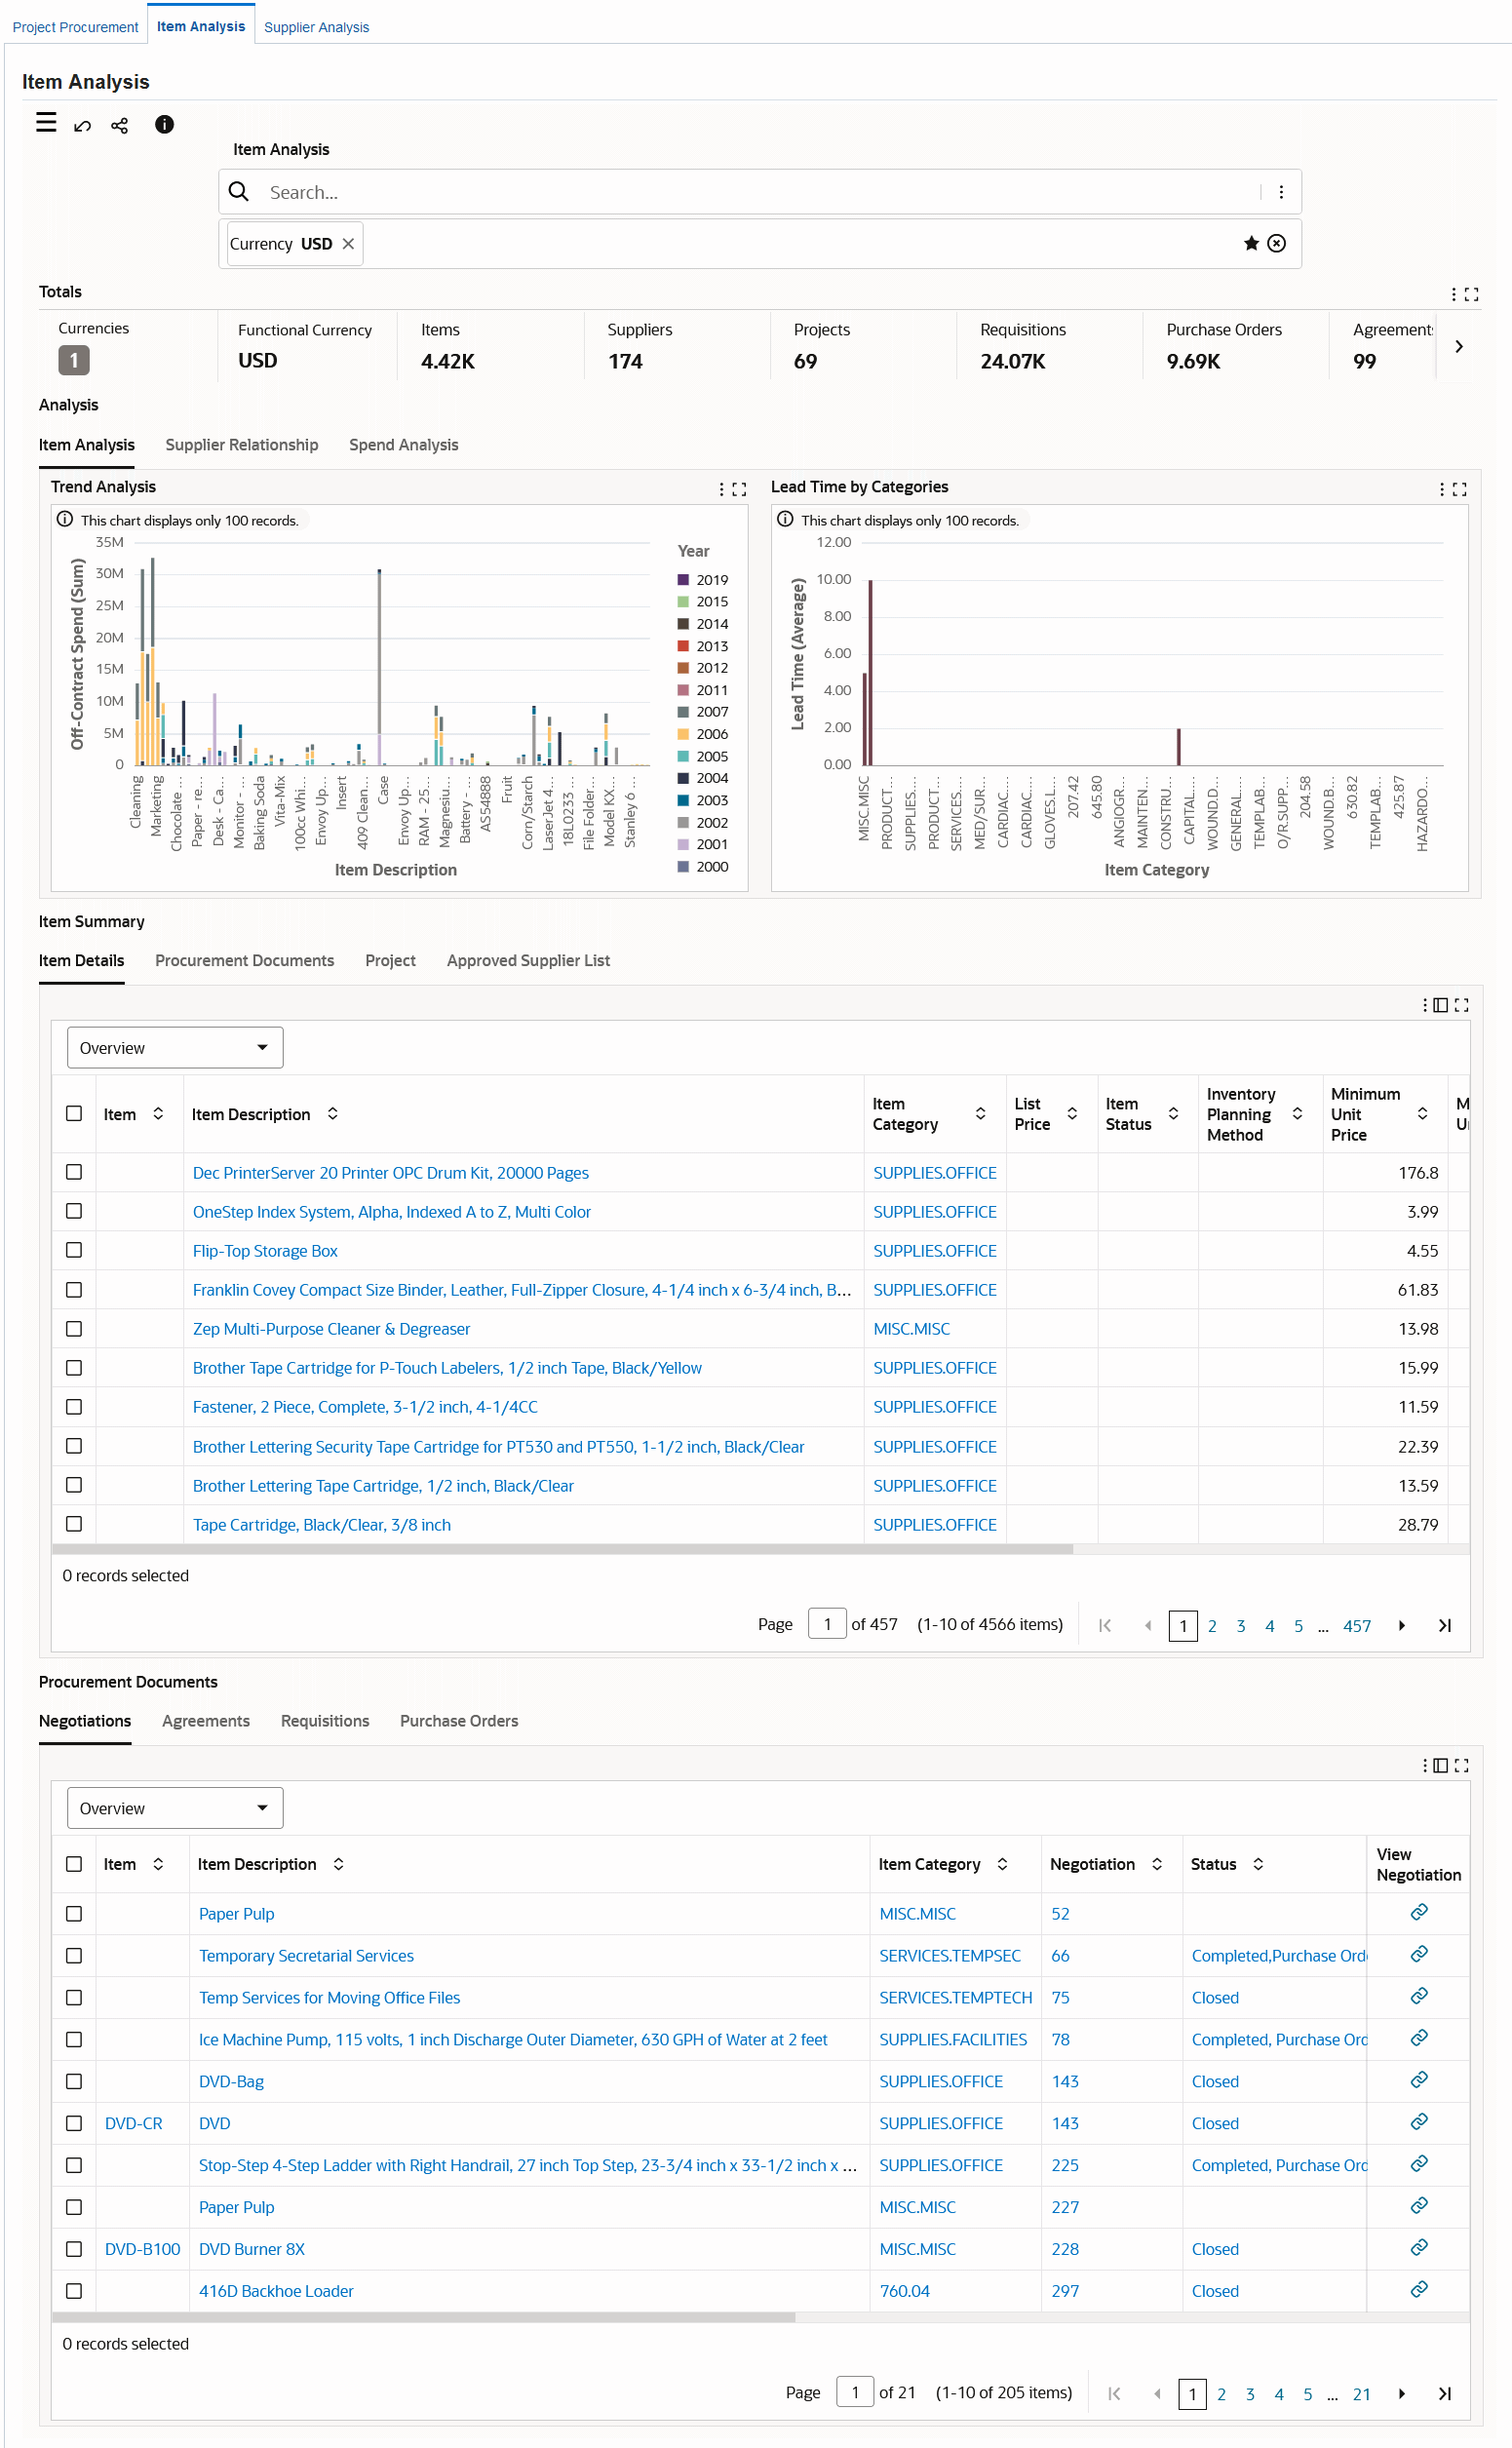
The following table describes the dashboard:
| Component | Description |
|---|---|
| Totals (summary bar) | This summary bar displays currency information and several metrics. To refine dashboard data, including the metrics, by currency, click Currencies and then select a value.
|
| Analysis (tabbed component) Item Analysis (tab) |
This tab contains the following charts:
|
| Analysis (tabbed component) Supplier Relationship (tab) |
This tab contains the following charts:
|
| Analysis (tabbed component) Spend Analysis (tab) |
This tab contains the following charts:
|
| Items Summary (tabbed component) Item Details, Procurement Documents, Project, Approved Supplier List (results tables) |
These tables summarize the details for items and information related to items in procurement documents, projects, and approved supplier lists. |
| Procurement Documents (tabbed component) includes: Negotiations, Agreements, Requisitions, and Purchase Orders (results tables) |
These tables show details for purchasing documents associated with items. You can review information for negotiations, agreements, requisitions, and purchase orders. From the Negotiations, Agreements, Requisitions, and Purchase Orders tables, to view details for a document or perform any action, click the link icon in the View column to navigate to the document's page. |
| Options (table-level actions) | See Performing Actions. |
Performing Actions
The following sections describe the actions that you can perform from the Options icon in the results tables.
Common Actions
The following are the common actions that are available from the Options icon in the results tables.
-
Compare: Select multiple rows to compare information.
-
Export: Use this action to export the search results in a comma-separated values (CSV) file.
Actions for Item Details
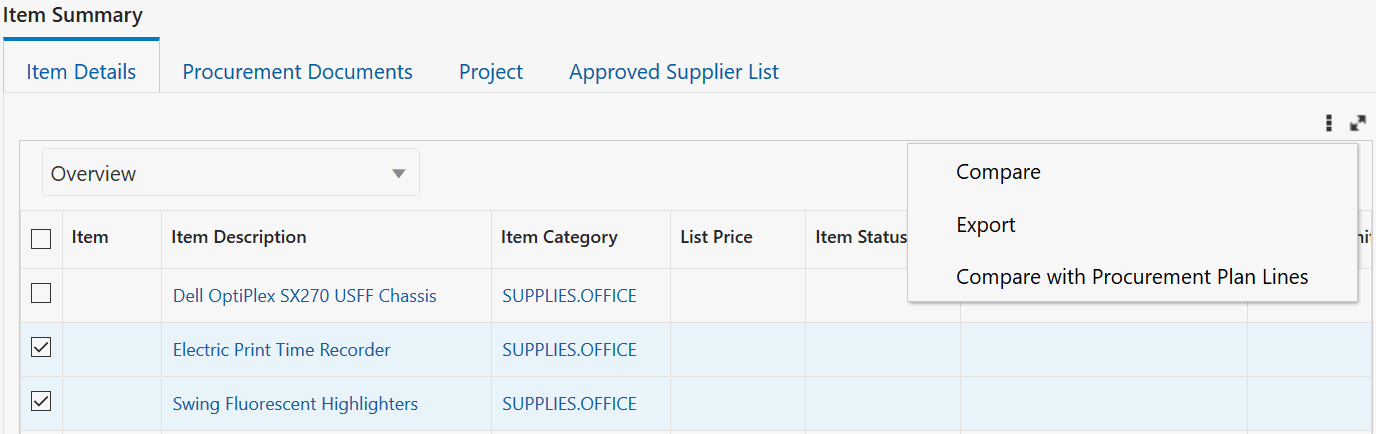
Replace Item
The following table describes the actions available when you select the Options icon in the Item Details results table. Select one or more rows and click the Options icon to act on your selection.
| Action | Description |
|---|---|
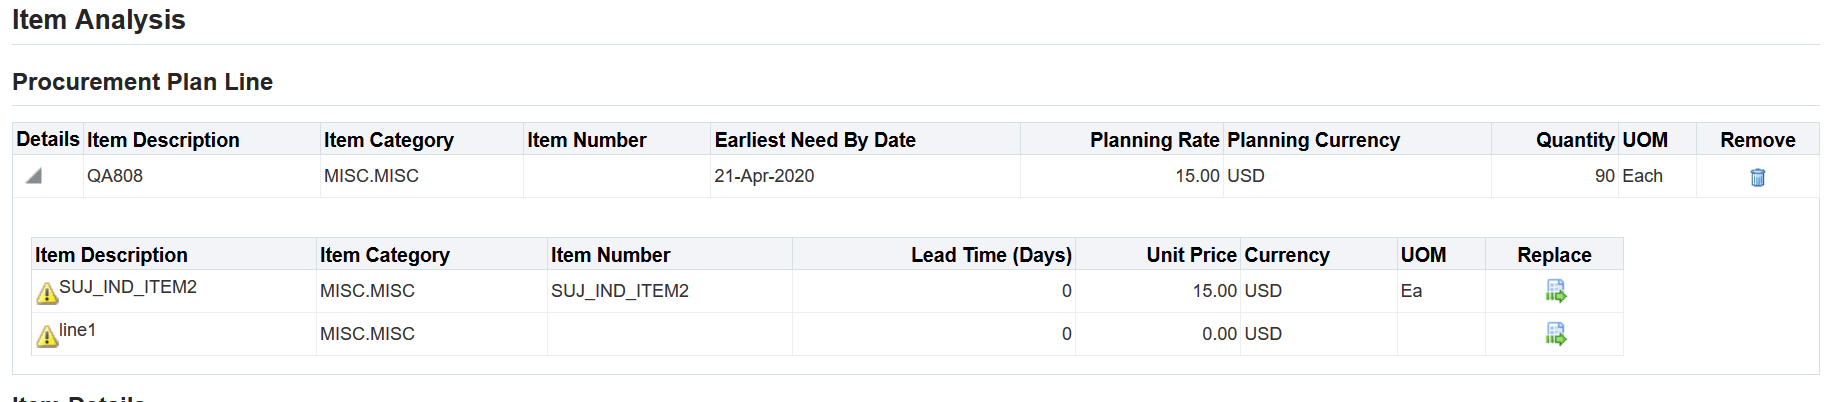
| Compare with Procurement Lines | This action is applicable to project managers and project buyers using the Item Analysis dashboard from the Project Procurement Command Center. Project Buyer: As a project buyer, use this action to compare an item with the item specified on the procurement plan. If there are no procurement plan lines, then you cannot perform this action. See Project Procurement Dashboard. Use the following navigation to the perform this action:
Project Manager: As a project manager, use this action to compare and replace an item or a service in the plan line. You can replace an item or a service only when the plan line is in the Draft status and with another item or service in the same purchasing category. See Procurement Plan Dashboard, Oracle Projects Fundamentals Guide. Use the following navigation to perform this action:
If the Replace action is successful, then the application automatically updates the record to display the latest item in the Item Summary tab. |
Employee Shopping Tracker Dashboard
See Procurement Command Center Overview.
The Employee Shopping Tracker dashboard displays the data for searches that employees perform in the iProcurement Shop page.
Use the dashboard to:
-
Review the keywords that are used in searches.
-
Take action to reduce the noncatalog shopping content in the iProcurement catalog.
-
Gather insight into the searches and search patterns.
-
Find out whether employees' searches were successful and resulted in items or services being added to the cart.
-
Analyze searches that had no matching items or services in the catalog.
-
Access the Employee Shopping Tracker dashboard using the following navigation:
(N) Purchasing > Procurement Command Center > Employee Shopping Tracker
Employee Shopping Tracker Dashboard
![]()
The following table describes the dashboard:
| Component | Description |
|---|---|
| Search Index (summary bar) | This summary bar shows the following metrics:
|
| Search Activity (chart) | For the date range selected in the Action Date refinement, this chart shows the total number of searches performed each day. The stacks represent the following:
|
| Frequently Searched Keywords (chart) | This bar chart shows the keywords that were used in searches and the number of results for each keyword search. |
| User Search Results (chart) | This stacked bar chart shows searches performed by each user. The stacks represent the following:
|
| Keywords Searched (tag cloud) | This tag cloud displays the top 50 keywords that were used in searches. |
| Filters Applied (tag cloud) | This tag cloud shows the refinements that were applied for searches in a search sequence. |
| Search Audit Results (tabbed component) Searches with Items Added to Cart, Searches with Results, and Searches with No Results (results tables) |
This tab shows details for searches and search results. |
| Options (table-level actions) | Select the Export option to export the search results in a comma-separated values (CSV) file. |