Oracle Bills of Material Command Center
This chapter provides information about Oracle Bills of Material Command Center dashboards.
This chapter covers the following topics:
- Bills of Material Command Center Overview
- Bills of Material Dashboard
- Routings Dashboard
- Change Orders Dashboard
Bills of Material Command Center
Bills of Material Command Center Overview
The Bills of Material Command Center enables users to efficiently manage product configuration and change order implementations. You can use key metrics, drillable graphs, tag clouds, and network diagrams that are available in the dashboards to explore product configurations, manage products, and perform impact assessments on change orders. Based on your role, you can use the Bills of Material Command Center to:
-
Track manufacturing and engineering bills graphically with all revisions and effectivity dates.
-
Visualize current and future bills before approving and implementing manufacturing changes.
-
Find and review alternate bills of material for assemblies.
-
View manufacturing routings and engineering routings.
-
View primary routings, alternate routings, routing revisions, and routings with pending changes.
-
Find and review source routings for common routings.
-
View routings, operations, resources, and alternate resources for routing operations in a network diagram.
-
Analyze change order reasons, revised items, revised components, revised operations, and revised resources details.
-
Explore where-used details for standard operations and operation resources in a network diagram.
-
Analyze items that undergo frequent changes to improve product lifecycle strategies.
-
Monitor component usage and manage bills of material to reduce manufacturing costs.
-
Drill down to analyze pending change orders grouped by stages.
-
Track change orders reasons to improve products and process flows.
Note: The Oracle Bills of Material Command Center currently supports date effective bills. Unit effective bills are not supported.
Before you load data from Oracle E-Business Suite into the Bills of Material Command Center, ensure that your EBS data is accurate and current.
The following Bills of Material Command Center dashboards enable search functions using Enterprise Command Center integration:
-
Bills of Material dashboard - Use this dashboard to view detailed information about bills and also explore the indented bills for assemblies. This dashboard is comprised of the Bills dashboard and the BOM Explorer dashboard.
-
Routings dashboard - Use this dashboard to view detailed information about all routings and explore the routings, operations, and alternate resources for operations. This dashboard is comprised of the Routings dashboard and the Routing Explorer dashboard.
-
Change Orders dashboard - Use this dashboard to view and analyze the complete lifecycle of an engineering change order (ECO). You can view complete details of ECOs along with their statuses, new item revisions, and change details.
Note: You can use the Oracle Bills of Material Command Center only after the installation and common configurations are completed as described in My Oracle Support Knowledge Document 2495053.1, Installing Oracle Enterprise Command Center Framework, Release 12.2. For additional ECC Overview information, see Overview of Oracle Enterprise Command Center Framework, Oracle E-Business Suite User's Guide.
Searching Enterprise Command Center Dashboards
Use the dashboard sidebars to refine (filter) the data on each dashboard. You can select a value or record from the Available Refinements component, or use Search to find a keyword, a value, or a specific record. The type-ahead feature suggests matches for your entry that correspond to the available refinements. When you submit a search, the search term is added to the Selected Refinements list, and the dashboard data is refined to include only records that match the search. You can add multiple refinements and remove any of them at any time. Use Saved Search to create and save your search. You can edit, delete, or refer to this saved search.
Use an asterisk (*) or percent sign (%) to perform a partial keyword or record search that matches any string of zero or more characters. You can also use a question mark (?) to perform a partial search that matches any single character.
Additional Information: For more information about searching for and refining data in enterprise command centers, see Search in Highlights of an Enterprise Command Center, Oracle E-Business Suite User's Guide.
Bills of Material Dashboard
The Bills of Materials dashboard in the Bills of Material Command Center is comprised of the following dashboards:
-
Bills dashboard - Use this dashboard to quickly search for bills of material across manufacturing bills or engineering bills and view bills with pending changes.
-
BOM Explorer dashboard - Use this dashboard to view and analyze the indented (multilevel and exploded) manufacturing or engineering bills of material of a manufacturing or engineering item using a network diagram.
As a product manager, manufacturing engineer, or production manager you can use the Bills of Material dashboards to efficiently manage product configurations across a product lifecycle. Use these dashboards to:
-
Track primary and alternate bills, including common bills for manufacturing, across organizations.
-
Identify and track bills with pending change orders.
-
Explore and visualize indented bills for assemblies.
-
Manage bills of material revision implementation and their component effectivity dates.
As an engineering supervisor, you can use the Bills of Material dashboards to effectively manage bills of material and their component usage. Use these dashboards to:
-
Track bill types and components for manufacture with quantities across organizations.
-
Identify noneditable common bills, editable common bills, alternates, and bills with pending change orders.
-
Manage bills revisions with effectivity dates.
-
Explore and visualize the indented bills of material for an assembly using network diagrams.
Bills Dashboard
The Bills dashboard provides bill of materials information including details of the assembly, organization, alternates, and revisions. Use this dashboard to quickly search for manufacturing bills or engineering bills and view bills with pending changes. Also ensure that you use the Bills dashboard to navigate to the BOM Explorer dashboard.
You can search using an assembly name or description. You can also view bills information based on the available refinements such as assembly, organization code, alternate, common bills and BOM item types. See Bills of Material Command Center Overview for more information.
From the Bills of Material responsibility, navigate to the Bills dashboard:
(N) Bills of Material > Bills > Bills > Bills of Material > Bills (tab)
Bills Dashboard
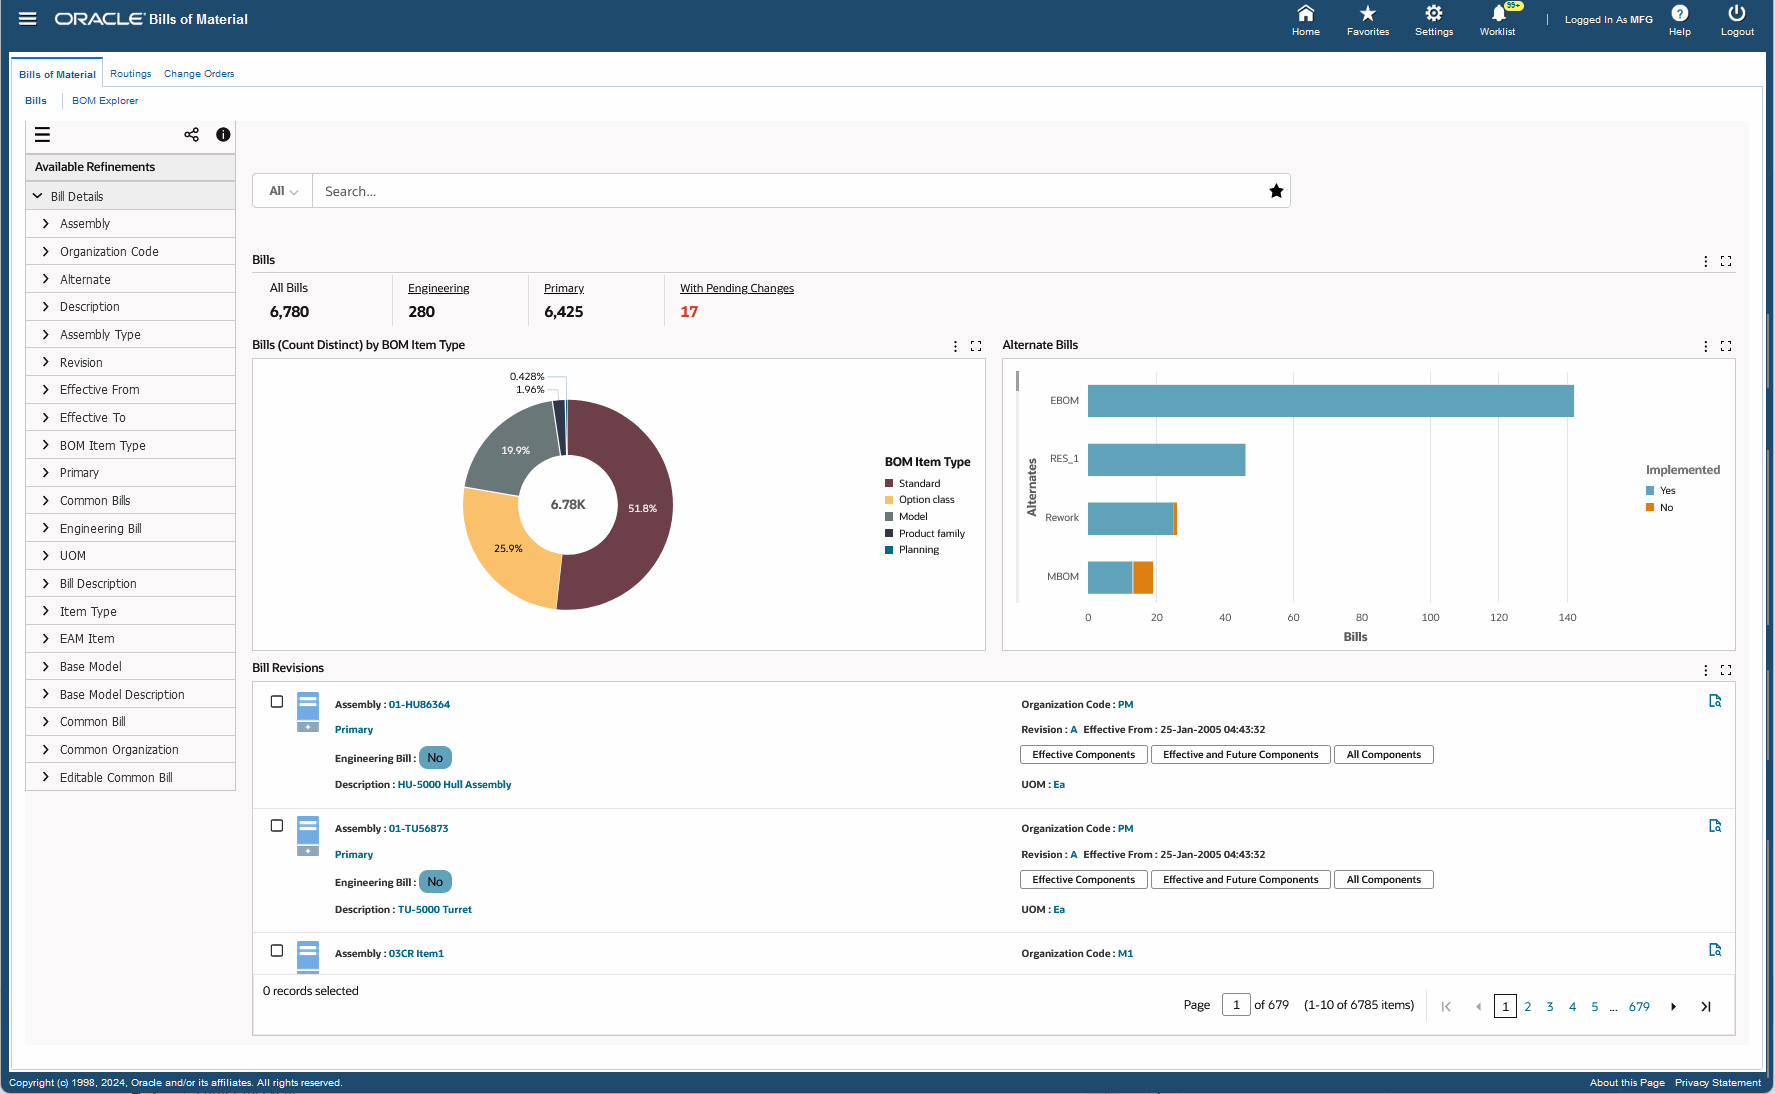
The following table describes the Bills dashboard components:
| Component | Description |
| Bills (summary bar) | The Bills summary bar displays the following key metrics:
Click a metric to refine the information on the dashboard. |
| BOM (Count Distinct) by BOM Item Type (chart) | This drill-down chart provides information on bills based on the following BOM item types:
You can refine the displayed data by clicking a data point on the chart and the dimension and metric value for a data point. Click the Options icon to select BOM Item Type, Common Bills, or Organization Code from the Dimension menu. Select Bills (Count Distinct) from the Group Dimensions menu. |
| Alternate Bills (chart) | This bar chart provides information on alternate bills that provide alternate lists of component items to produce assemblies. You can refine the displayed data by clicking a data point on the chart and the dimension and metric value for a data point. Click the Options icon to select Implemented from the Dimension menu and Alternate from the Group Dimensions menu. |
| Bill Revisions (grid) | Use the Bill Revisions grid to view information about bills based on assembly name, organization code, revision, unit of measure, and whether the bills are primary bills or alternate bills. Indicators display to let you know if it is an engineering bill or not. You can also view the effective from date for various revisions of an assembly. In case an alternate bill exists, then the alternate bill name displays. Note that the alternate does not appear for primary bills in the bill revision. Click the Record Details icon for a bill revision to view bill details such as assembly, assembly type, organization, alternate, description, revision, effective from and effective to dates, UOM, item type, common bill, common organization, whether it is an editable common bill, base model, base model description, and bills of material descriptive flexfield information if any. Note: The effective dates of the consecutive revisions shown, vary with one second only. Additionally, the Effective To date does not appear for the last revision of a bill. You can click a linked assembly name to view item attribute details in the Item Overview page. It is recommended that you use the Bills dashboard to navigate to the BOM Explorer dashboard to view the network diagram for assemblies:
Click the links in the grid to refine the information available in the dashboard. The following actions are available from the Options icon:
|
See :
BOM Explorer Dashboard
The BOM Explorer dashboard enables you to view, track and trace the manufacturing or engineering bill of material for manufacturing or engineering items in a network diagram. You can use the diagram to graphically view the assembly and monitor component changes and their effectivity dates. The diagram also displays the components for the bill of material of an assembly that you select in the Bills Summary grid. Ensure that you use the Bills dashboard to navigate to the BOM Explorer dashboard.
Using the available refinements, you can view indented bill information based on assembly name, alternate, effective from date, and effective to date. See Bills of Material Command Center Overview for more information.
From the Bills of Material responsibility, navigate to the Bills dashboard and ensure that you use the Bills dashboard to navigate to the BOM Explorer dashboard.
BOM Explorer dashboard
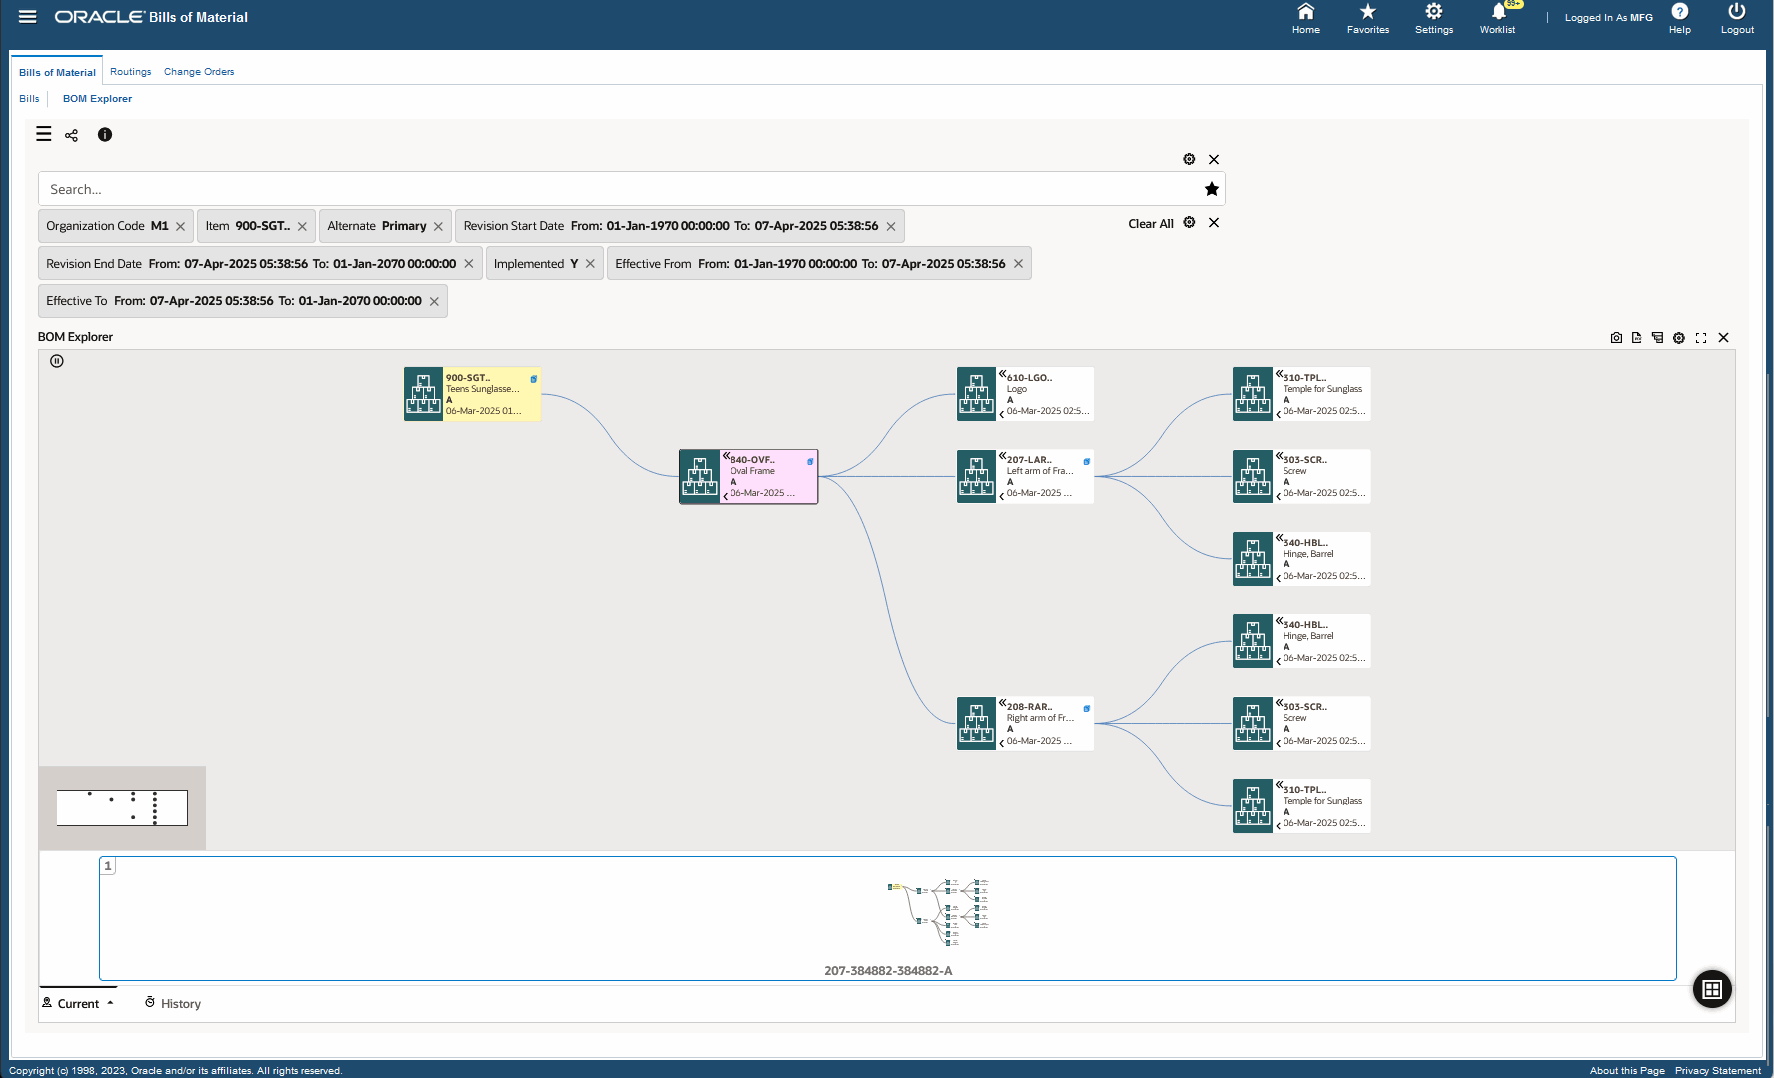
The following table describes the BOM Explorer dashboard components:
| Component | Description |
| BOM Explorer (diagram) | Use this diagram to view the indented (multilevel and exploded) manufacturing or engineering bill of material of a manufacturing or engineering item. Each node displays the assembly name, assembly description, revision, and the effective from date. Note: The node for the searched assembly shows the revision start effective from date in the BOM Explorer diagram. You must not modify or remove the Revision Start Date and Revision End Date filters. These filters are set to render the diagram correctly by showing the details of the selected revision. Note that in the selected filters, the Effective From and Effective To date entities both have the From and To date range components. For example, for a bill revision that is effective between 03-March-2022 and 07-March-2022, the following dates appear:
Note that the bill revision date appears in the:
The From date component in the Effective From date and the To date component in the Effective To date are given values to render the network diagram. Note: To render the BOM Explorer network diagram, the following dates are substituted while loading the indented bills data set:
You can modify the Effective From date and Effective To date filters to view the bill for a specific date. To modify these date filters, ensure that you enter the same date in the following date components:
Modifying Effective From and Effective To Date Filters: The following example demonstrates changing the date filters in the BOM Explorer dashboard to view a bill dated 05-March-2022 . If you select the Effective Components button to navigate to the BOM Explorer dashboard, modify the dates that appear in the selected filters using the following steps:
If you select the Effective and Future Components button to navigate to the BOM Explorer dashboard, modify the dates that appear in the selected filters using the following steps:
Right-click a node to select the following options available for the node:
Right-click a node and then select from the following actions:
The nodes display the following icons as visual indicators for the component status of assemblies:
The following icons are available for the BOM Explorer diagram:
|
See :
Routings Dashboard
The Routings dashboard in the Bills of Material Command Center is comprised of the following dashboards:
-
Routings dashboard - Use this dashboard to quickly search for all routings. The dashboard displays both manufacturing and engineering routings. You can view primary routings, alternate routings, routing revisions, and routings with pending changes. You can also view source routings for common routings.
-
Routing Explorer dashboard - Use this dashboard to view and analyze routing definitions, operations, resources, and alternate resources defined for operations using a network diagram.
As a manufacturing manager or engineer you can use the Routing dashboards to efficiently view and manage routing definitions. Use these dashboards to:
-
View the definition of standalone and common routings across organizations.
-
Track and view the number of items that have engineering routings.
-
Find and view the common routings that reference a source routing.
-
Identify and track routings with pending changes.
-
View resource where used across routings.
-
Explore and visualize standard operations referenced across routings.
Routings Dashboard
The Routings dashboard provides information about all routings. Use this dashboard to quickly search for manufacturing and engineering routings. You can also view primary routings, alternate routings, routing revisions, and routings with pending changes. Also ensure that you use the Routing Revisions grid on the Routings dashboard to navigate to the Routing Explorer dashboard.
You can view routing information based on the available refinements such as revision, alternate, assembly, and organization code. See Bills of Material Command Center Overview for more information.
From the Bills of Material responsibility, navigate to the Routings dashboard:
(N) Bills of Material > Routings > Routings (tab)
Routings Dashboard
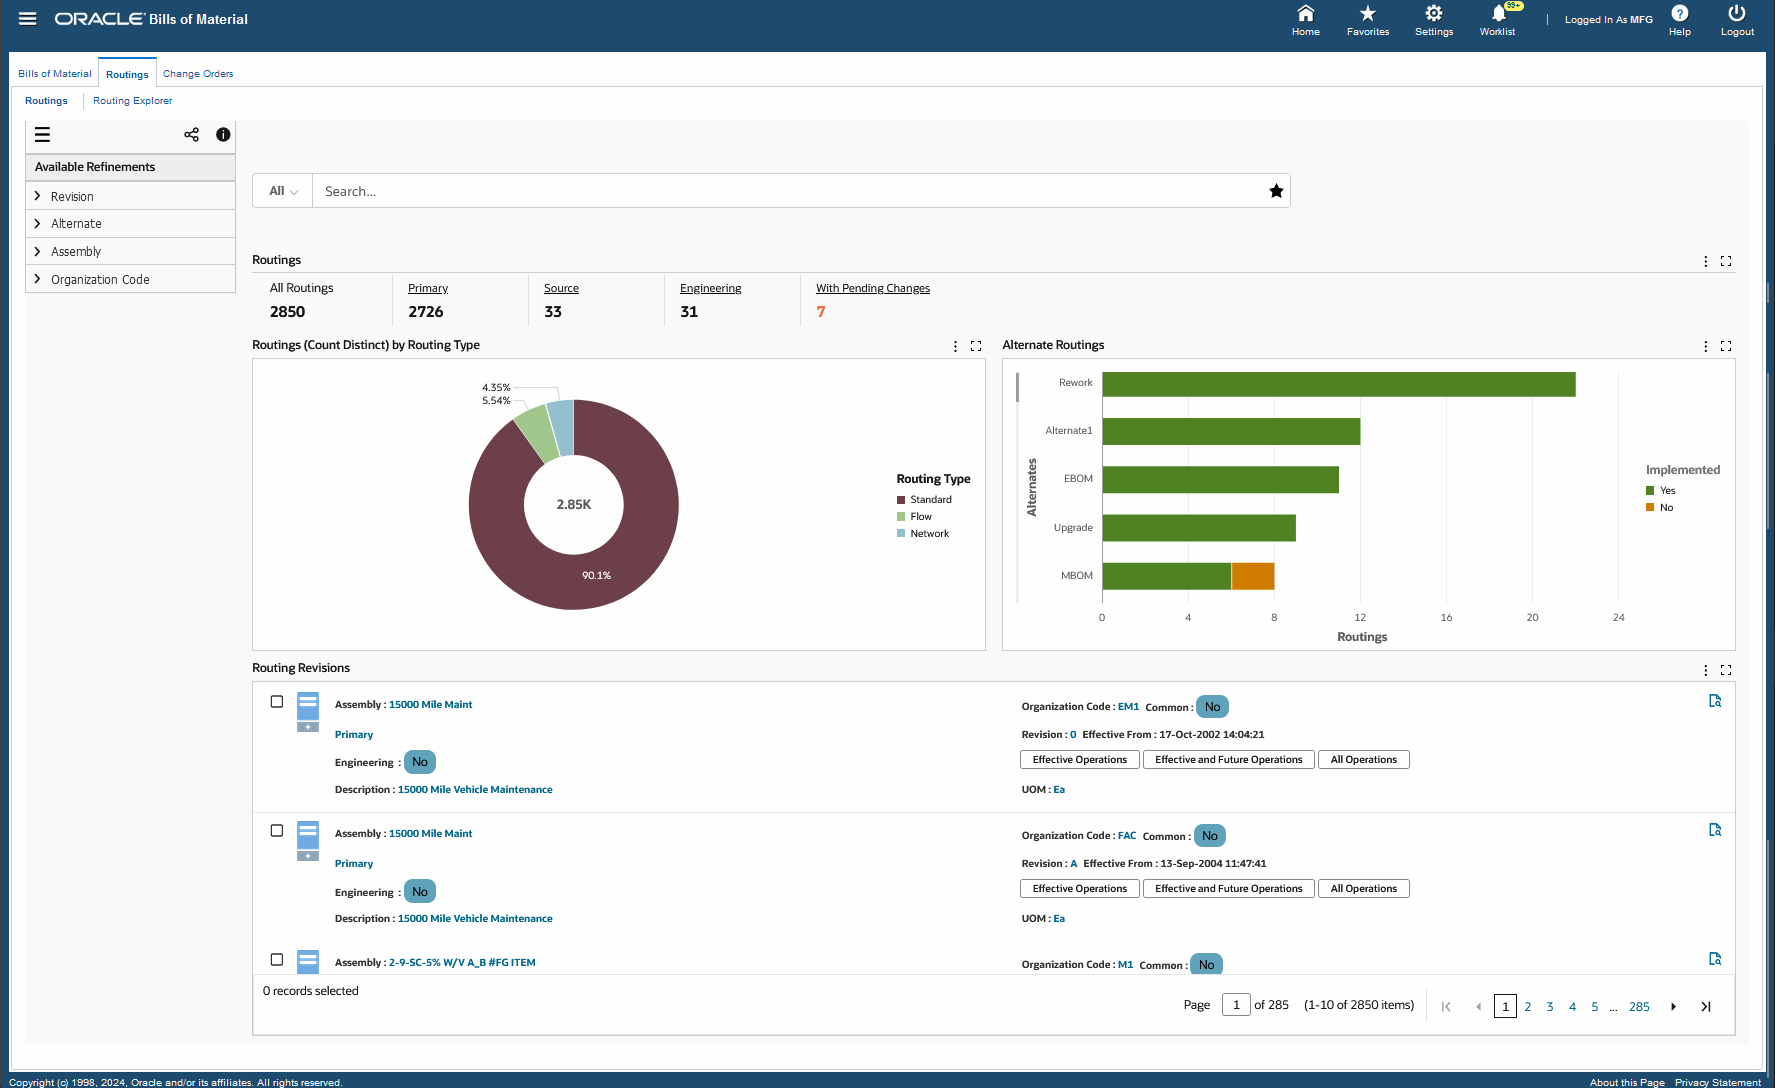
The following table describes the Routings dashboard components:
| Component | Description |
| Routings (summary bar) | The Routing summary bar displays the following key metrics:
Click a metric to refine the information on the dashboard. |
| Routing (Count Distinct) by Routing Type (chart) | This drill-down chart provides information on bills based on the following routing types:
You can refine the displayed data by clicking a data point on the chart and the dimension and metric value for a data point. Click the Options icon to select Routing Type, Common Routing, or Organization Code from the Dimension menu. |
| Alternate Routings (chart) | This bar chart provides information on alternate routings that provide alternate manufacturing processes to produce assemblies. You can refine the displayed data by clicking a data point on the chart and the dimension and metric value for a data point. Click the Options icon to select Implemented from the Dimension menu and Alternate from the Group Dimensions menu. |
| Routing Revisions (grid) | Use the Routing Revisions grid to view information about routings based on assembly, organization code, revision, unit of measure, description and whether the routing is primary. Indicators display to let you know if it is an engineering routing or not. In case an alternate routing exists, then the alternate routing name displays. Additionally, you can view whether the routing is common or not. You can also view the effective from date for various revisions of a routing. Click the Record Details icon for a routing revision to view details such as assembly, description, unit of measure, routing type, organization, alternate, capable to promise, revision, effective from and effective to dates, implementation dates, completion subinventory, and descriptive flexfield information if any. Note: The effective dates of the consecutive revisions shown, vary with one second only. Additionally, the Effective To date does not appear for the last revision of a routing. It is recommended that you use the Routings dashboard to navigate to the Routing Explorer dashboard to view the network diagram for routings and routing operations:
Click the links in the grid to refine the information available in the dashboard. The following actions are available from the Options icon:
|
See :
Routing Explorer Dashboard
The Routing Explorer dashboard enables you to view, track and trace the routing definition and the associated operations, resources, and alternate resources for that routing in a network diagram. The diagram displays details of the routing depending on whether you select to view effective operations or effective and future operations, or all operations for a routing in the Routing Revisions grid in the Routings dashboard. Ensure that you use the Routings dashboard to navigate to the Routing Explorer dashboard.
Using the available refinements, and the data set that you select, you can refine the routing information in the network diagram based on operation sequence number, standard operation code, assembly, organization code, resource code, and operation sequence. See Bills of Material Command Center Overview for more information.
From the Bills of Material responsibility, navigate to the Routings dashboard and ensure that you use the Routings dashboard to navigate to the Routing Explorer dashboard.
Routing Explorer Dashboard
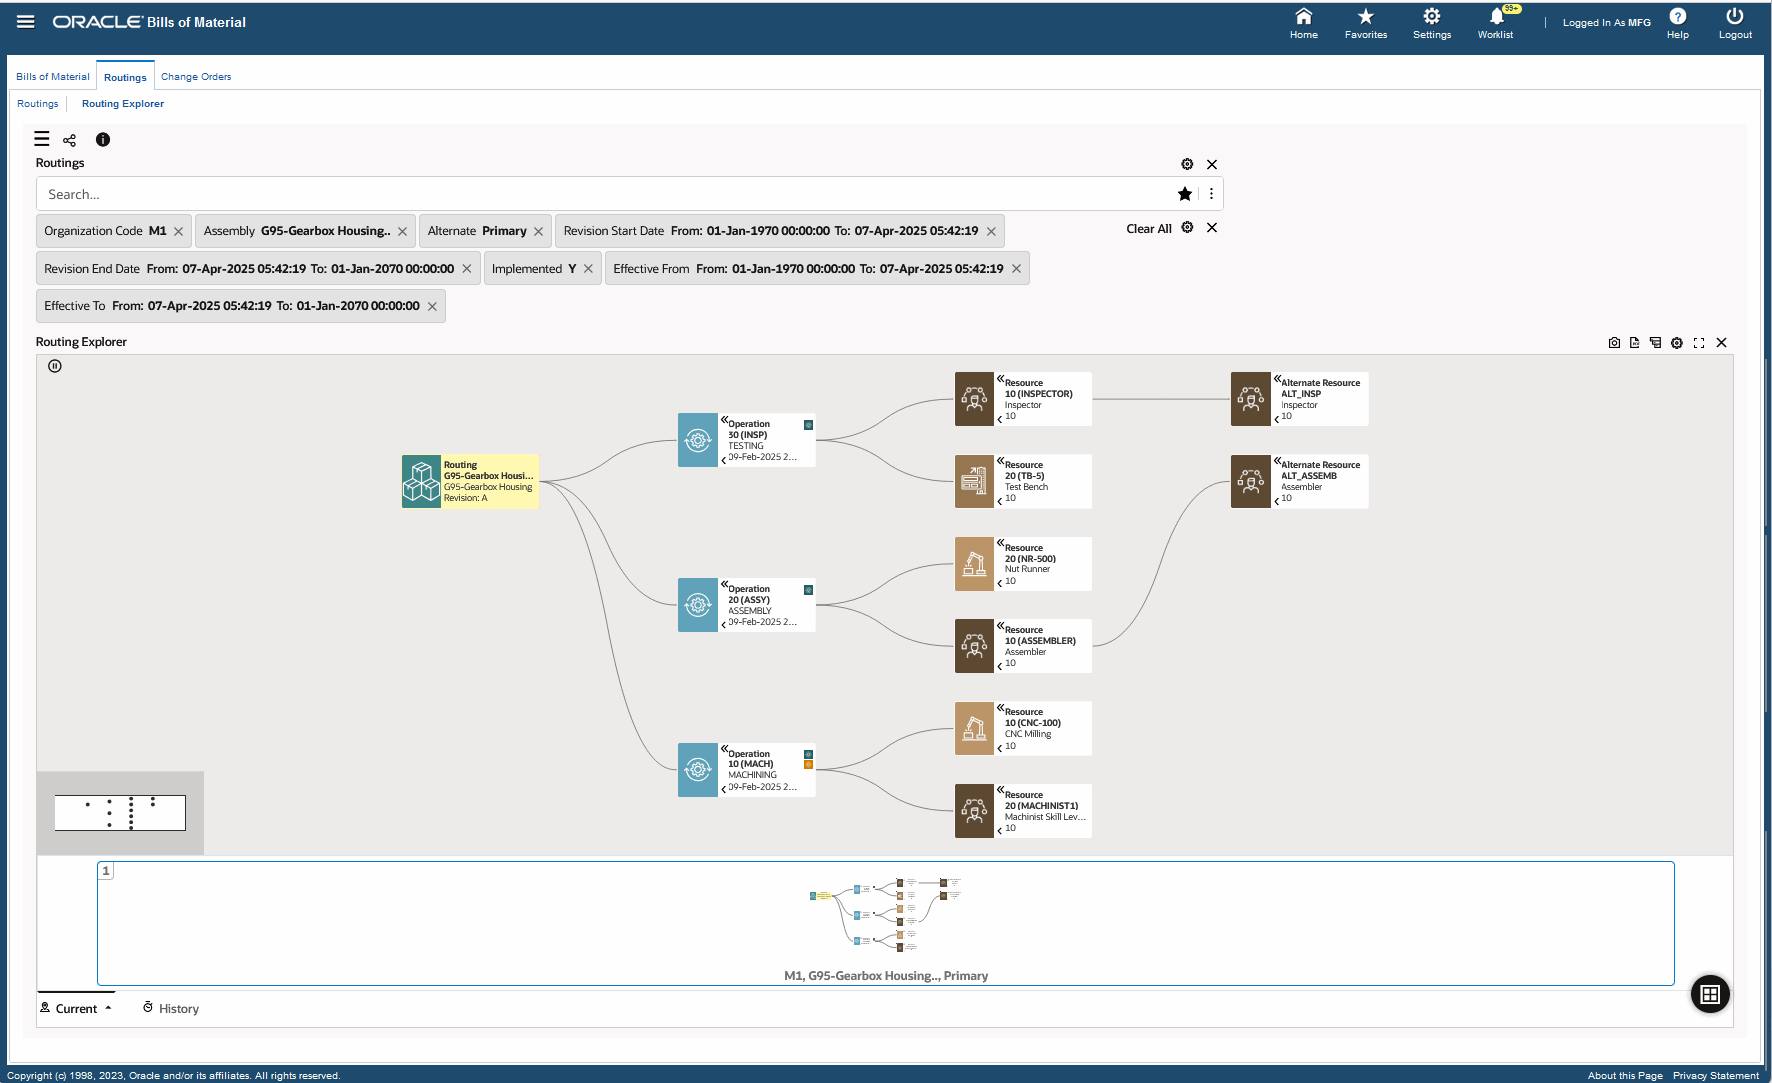
The following table describes the Routing Explorer dashboard components:
| Component | Description |
| Routing Explorer (diagram) | Use this diagram to view the routing definition, operations, resources, and alternate resources for a routing operation. The Routing Explorer network diagram displays the following nodes:
Note: The node for the searched routing shows the revision start effective from date in the Routing Explorer diagram. You must not modify or remove the Revision Start Date and Revision End Date filters. These filters are set to render the diagram correctly by showing the details of the selected revision. Right-click a node in the network diagram to select the following options available for the node:
The following icons are available for the Routing Explorer diagram:
|
See:
Change Orders Dashboard
The Change Orders dashboard enables you to view and analyze the complete lifecycle of an engineering change order.
As a product manager, manufacturing engineer, or production manager you can use the Change Orders dashboard to efficiently manage product configuration. Use this dashboard to:
-
Monitor and track high priority change orders and ensure their on-time implementation.
-
Review change reason, revised items, component changes, revised operations, and revised resources.
-
View standard operations and resource where used across routings in a network diagram to perform routing change impact analysis.
-
Approve or reject product configuration for manufacturing implementation.
-
Analyze products that frequently undergo change to determine product obsolescence strategies.
As an engineering supervisor you can use the Change Orders dashboard to ensure that product details are up-to-date and that product development is on track. Use this dashboard to:
-
Analyze change orders statuses across change reasons.
-
Monitor change orders and the revised item status for products with the priority codes.
-
Update the status for change orders.
You can search using a change order and description. You can also view change orders information based on the available refinements for the change order, revised items, revised components, revised operations, and revised resources data sets. See Bills of Material Command Center Overview for more information.
From the Engineering responsibility, navigate to the Change Orders dashboard using one of the following navigation paths:
(N) Engineering > ECOs > Change Orders > Change Orders (tab)
Change Orders Dashboard
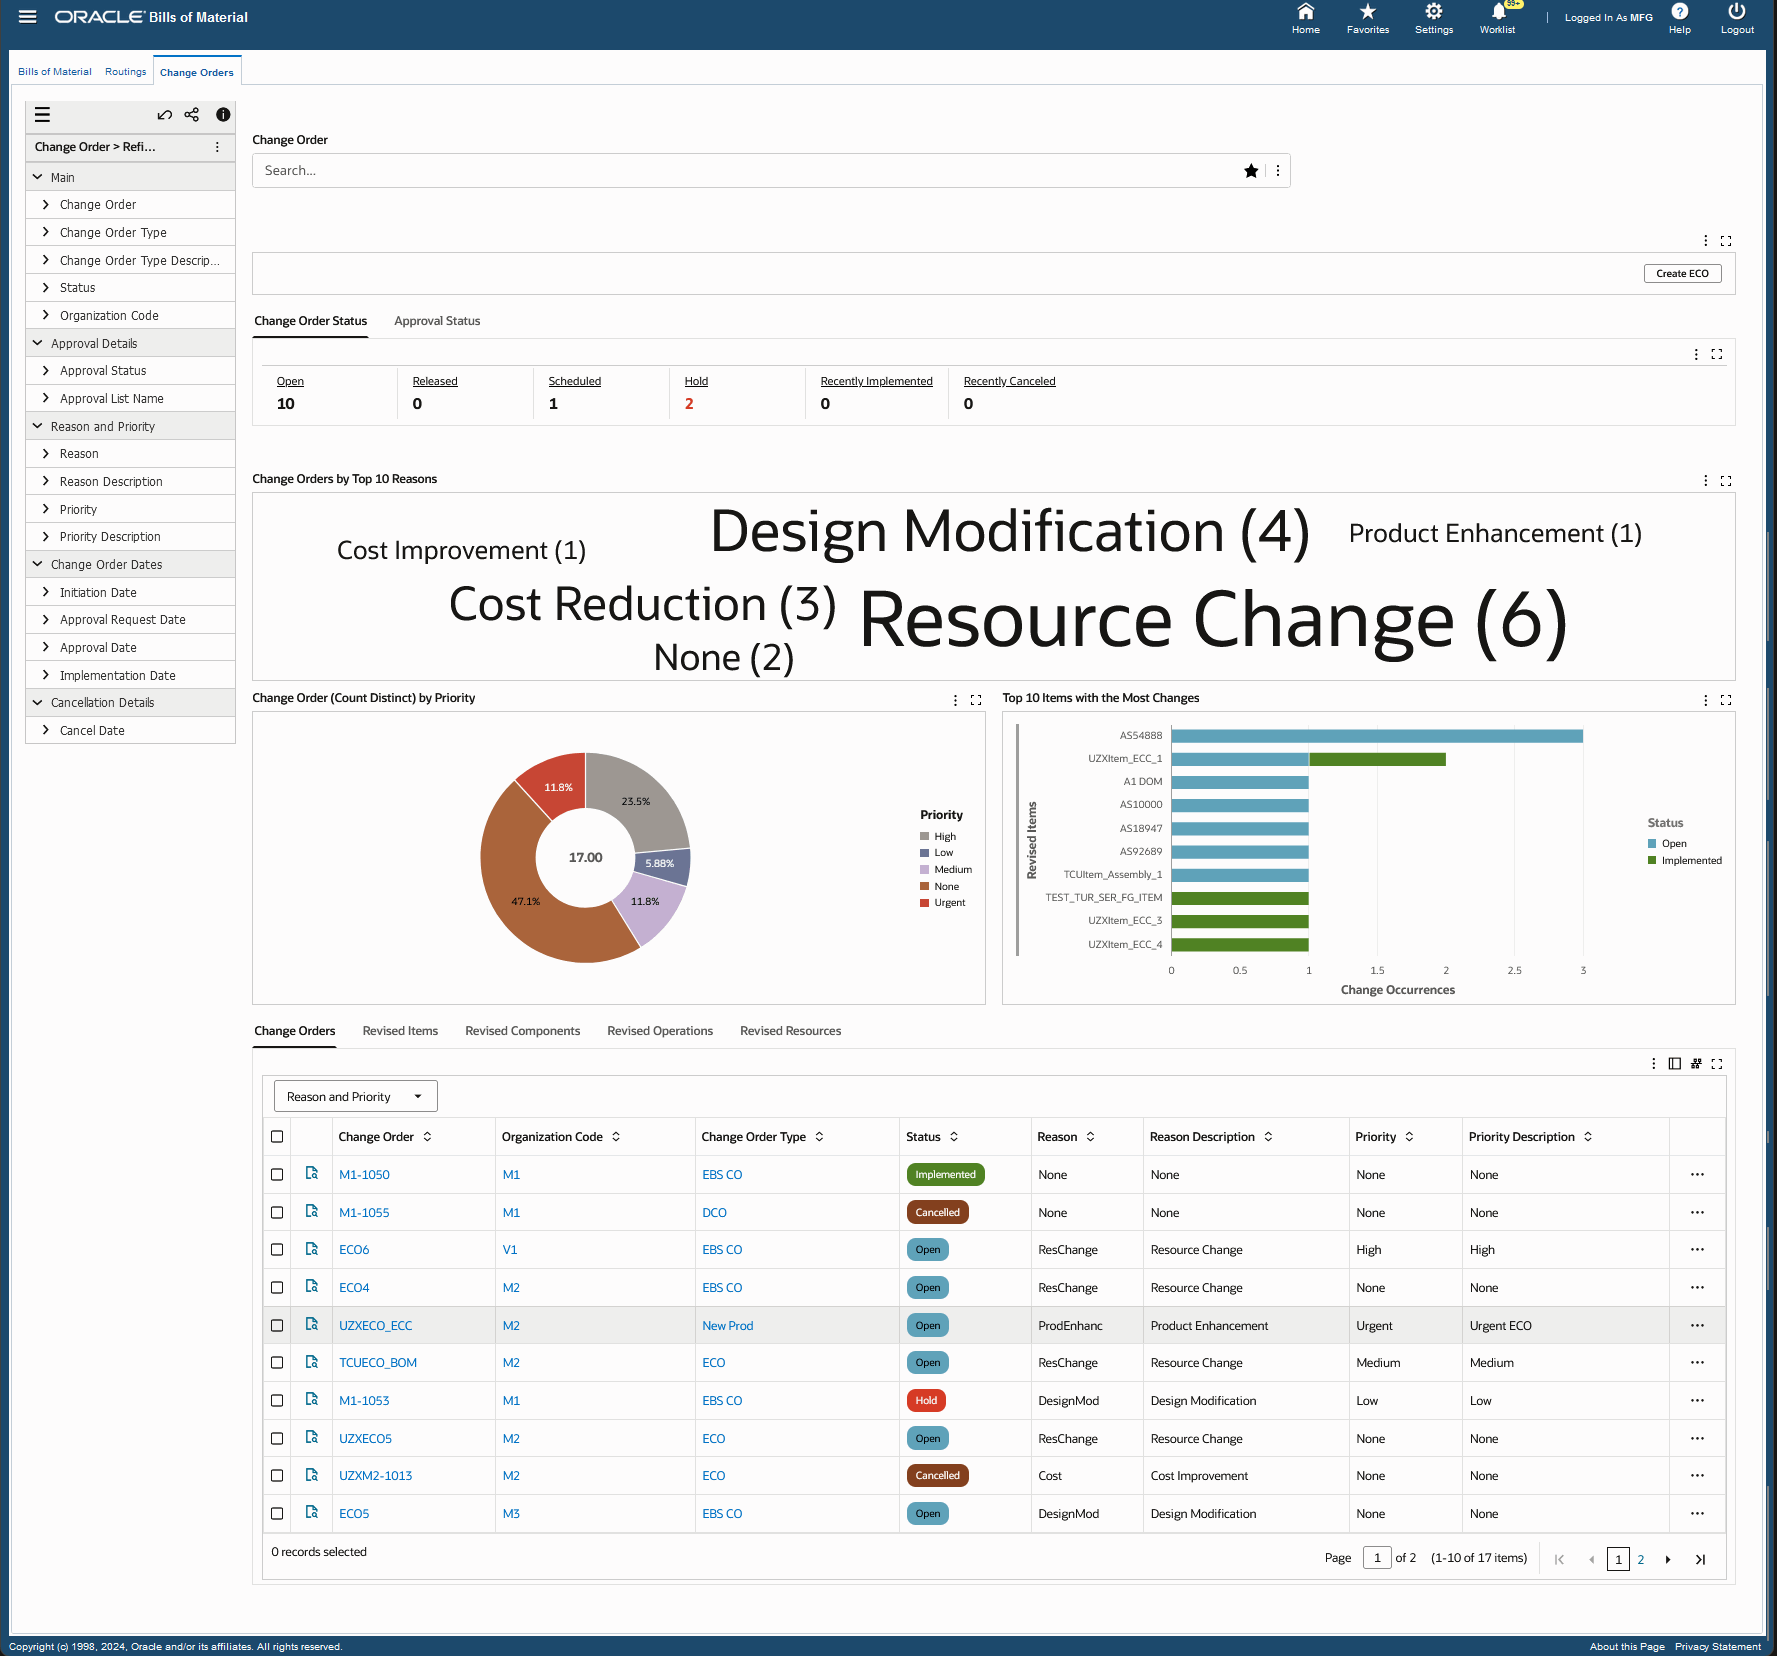
The following table describes the Change Orders dashboard components:
| Component | Description |
| Create ECO (button) | To create an engineering change order (ECO), click Create ECO to navigate to the Engineering Change Orders window. |
| Change Order Status (tab) | This tab displays the following key metrics:
Click on a metric to refine the dashboard data. Note: The metrics for recently implemented and recently canceled change orders display information for the past 14 days by default. You can change and configure this value using the ECC developer responsibility. |
| Approval Status (tab) | This tab displays the following key metrics:
Click a metric to refine information on the dashboard. Note: The metrics for recently approved and recently rejected change orders display information for the past 14 days by default. You can change and configure this value using the ECC developer responsibility. |
| Change Orders by Top 10 Reasons (tag cloud) | This tag cloud displays the top 10 reasons based on reason descriptions for engineering change orders. |
| Change Order (Count Distinct) by Priority (chart) | Use this drill-down chart to view change orders based on priority codes such as standard, urgent, and none (if there is no assigned priority). You can also view change order information in this chart based on ECO status and approval status. You can refine the displayed data by clicking a data point on the chart and the dimension and metric value for a data point. Click the Options icon to select Priority Code, ECO Status, and Approval Status from the Dimension menu. Select Bills (Count Distinct) from the Group Dimensions menu. |
| Top 10 Items with the Most Changes (chart) | Use this chart to view the top ten assemblies which were changed the most number of times based on revised items, and status. You can refine the displayed data by clicking a data point on the chart and the dimension and metric value for a data point. Click the Options icon to select Status from the Dimension menu and Revised Item from the Group Dimensions menu. |
| Results Tables (tab layout) | The Change Orders dashboard tables provide information in the following tabs:
Click the Record Details icon on the Change Orders, Revised Items, Revised Components, Revised Operations, and Revised Resources tabs to view details for a change order, revised item, revised component, revised operation, or a revised resource. You can view the information in the change order, revised items, revised components, and revised operations tables in the default Table View or the Timeline View. To view key events for change order, revised items, revised components, and revised operations in the Timeline View, click the Timeline View icon in the following tabs:
Click the links in the table columns to refine the information available in the dashboard. The following actions are available from the Options icon on the Change Orders dashboard tables:
|
See: