 Understanding PeopleSoft Quality Methods
This chapter provides overviews of Quality methods and graph and display preferences, lists common elements, and discusses how to:
Define control charts.
Define control tests.
Define control procedures.
Define sampling codes.
Maintain graph and display preferences.
Understanding PeopleSoft Quality Methods
Quality provides industry-accepted methods for applying statistical process control (SPC) practices to manufacturing operations. These methods help you:
Monitor several processes simultaneously, in real-time, to assess stability and identify out-of-control conditions.
Generate alarms and dispatch them online by using electronic mail or Workflow.
Characterize, stabilize, and improve the process by using advanced statistics and graphing techniques.
Note. The product is delivered with many industry-standard definitions for control charts, control tests, and control procedures. You can elect to use these defaults or create specific methods. If you use the system's standard definitions, you don't have to use this chapter to get started.
All the configured methods are available for use by Quality during both online and offline data analysis (Quality application client).
See Also
Delivered Workflow for PeopleSoft Quality
 Control Charts
Control charts are graphical representations of data that is associated with a process, plotted over time.
Use these charts to:
Monitor a process to determine stability.
Visualize trends and variability.
Note and track process adjustments.
Investigate causes of unacceptable or marginal quality.
PeopleSoft provides you with seven industry-standard control charts. These charts are time-series charts for monitoring and controlling processes or equipment. Each control chart has a unique chart ID that represents a different display format.
Using the Control Chart component, you can define custom charts to reflect special control requirements or labeling conventions. The charts are based on industry-standard control charts and are applicable to a specific data type.
Note. Chart IDs 1 through 7 are supplied as industry-standard system defaults.
|
Description |
Data Type |
|
|
1 |
X and Moving Range. |
Variables |
|
2 |
Xbar and Range. |
Variables |
|
3 |
Xbar and Sigma. |
Variables |
|
4 |
c Chart. |
Defects |
|
5 |
u Chart. |
Defects |
|
6 |
p Chart. |
Defectives |
|
7 |
np Chart. |
Defectives |
These tables illustrate the structure of each control chart.
Note. Some control charts are comprised of two individual subcharts for plotting means and variances together. These subcharts are labeled as chart 1 or chart 2 in the tables.
Control Chart ID: 1
This graphic shows Control Chart ID 1:
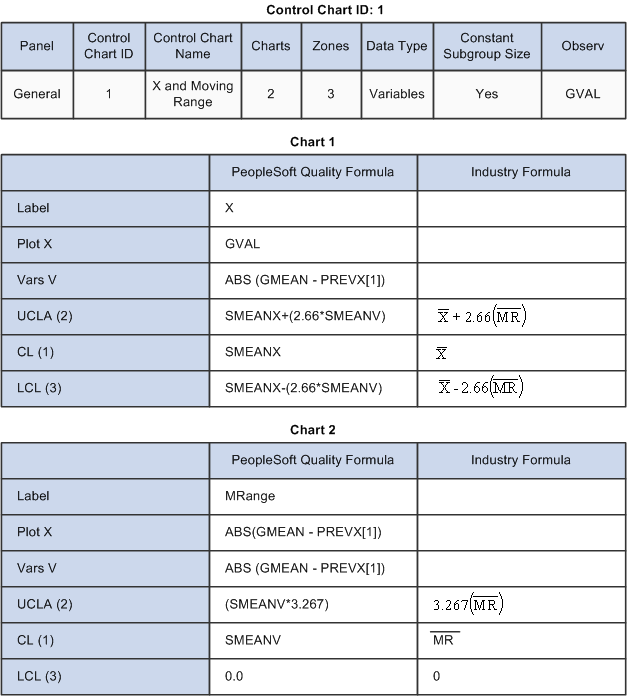
Control Chart ID: 1
Control Chart ID: 2
This graphic displays Control Chart ID 2:
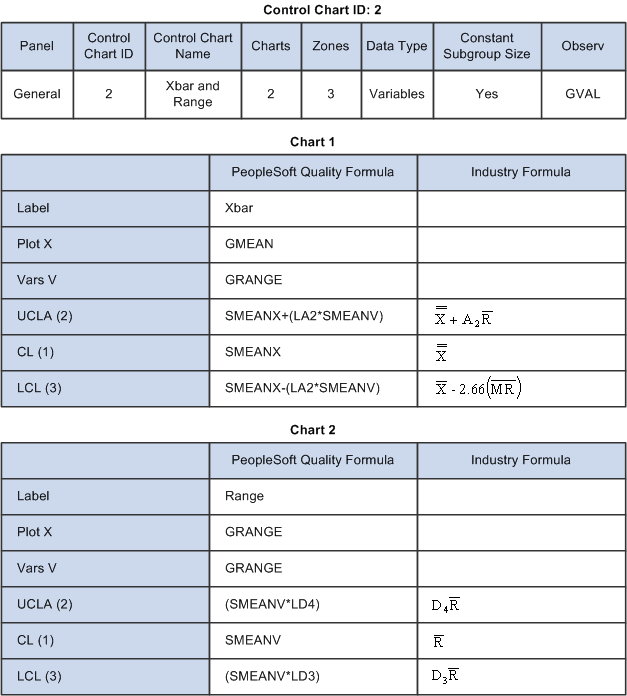
Control Chart ID: 2
Control Chart ID: 3
This graphic displays Control Chart ID 3:
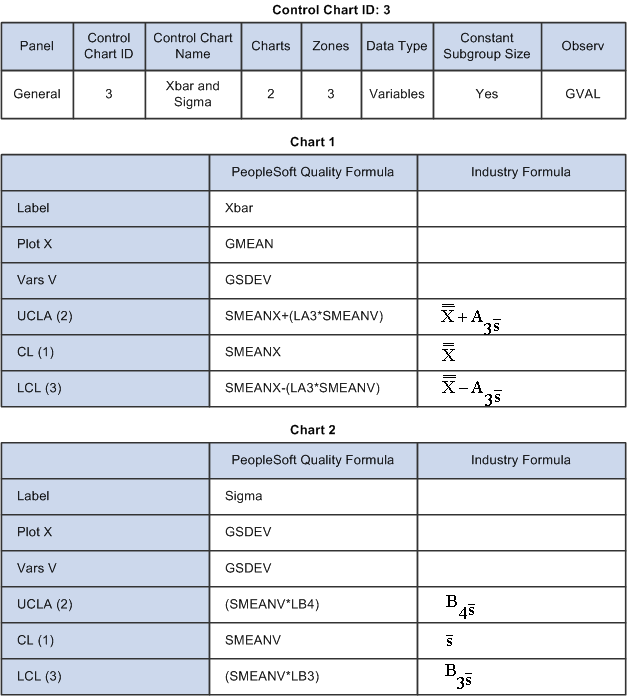
Control Chart ID: 3
Control Chart ID: 4
This graphic displays Control Chart ID 4:
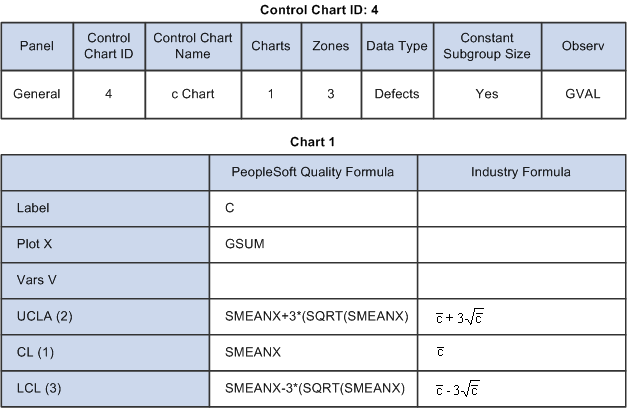
Control Chart ID: 4
Control Chart ID: 5
This graphic displays Control Chart ID 5:
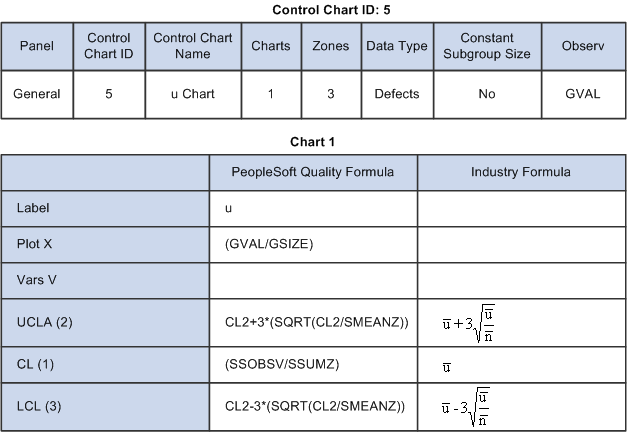
Control Chart ID: 5
Control Chart ID: 6
This graphic displays Control Chart ID 6:
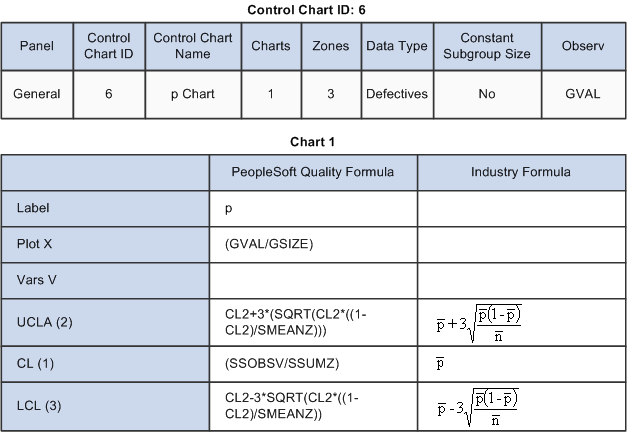
Control Chart ID: 6
Control Chart ID: 7
This graphic displays Control Chart ID 7:
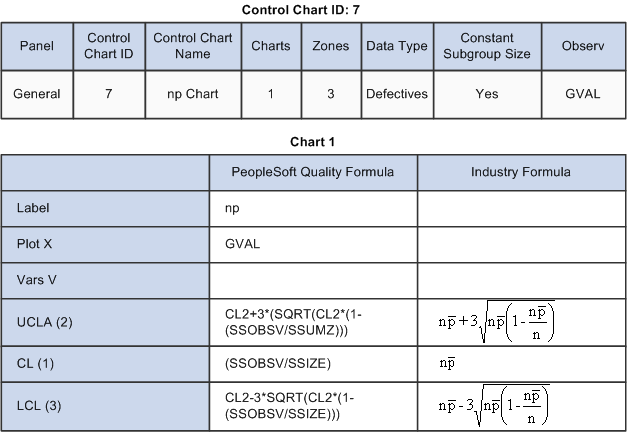
Control Chart ID: 7
See Also
Control Tests
To assess ongoing control and stability, you test incoming sample data online against various statistical conditions. Each condition is represented by a control test that is applied to subgroups that are plotted on a control chart. Quality includes a set of 17 default control tests. Each test is based on a standard Shewhart pattern for identifying special causes of variability. Use the default test or create control tests from the industry-standard default prototypes.
You can selectively apply the tests to mean or variance charts, and control the sensitivity of each test by specifying the number of points to evaluate and the number of points in the pattern that are required for triggering a violation. If a data point (subgroup) violates one or more control tests, the system generates an alarm. The system identifies a test by a unique ID number and description.
Note. Control tests 1 through 17 are supplied as industry-standard system defaults. You can't change the prototype fields for these tests.
|
Description |
Prototype |
Chart |
k of K |
|
|
1 |
Specification limit violation. |
1 |
1 |
1 of 1. |
|
2 |
Control limit violation (mean). |
2 |
1 |
1 of 1. |
|
3 |
Control limit violation (variance). |
2 |
2 |
1 of 1. |
|
4 |
Trend - 7 pts (mean). |
4 |
1 |
7 of 7. |
|
5 |
Shift - 2 of 3 pts (mean). |
6 |
1 |
2 of 3. |
|
6 |
Shift - 4 of 5 pts (mean). |
7 |
1 |
4 of 5. |
|
7 |
Shift - 8 of 8 pts (mean). |
3 |
1 |
8 of 8. |
|
8 |
Mixture - 8 pts (mean). |
9 |
1 |
8 of 8. |
|
9 |
Systematic variable - 14 pts (mean). |
5 |
1 |
14 of 14. |
|
10 |
Stratification - 15 pts (mean). |
8 |
1 |
15 of 15. |
|
11 |
Trend - 7 pts (variance). |
4 |
2 |
7 of 7. |
|
12 |
Shift - 2 of 3 pts (variance). |
6 |
2 |
2 of 3. |
|
13 |
Shift - 4 of 5 pts (variance). |
7 |
2 |
4 of 5. |
|
14 |
Shift - 8 of 8 pts (variance). |
3 |
2 |
8 of 8. |
|
15 |
Mixture - 8 pts (variance). |
9 |
2 |
8 of 8. |
|
16 |
Systematic variable - 14 pts (variance). |
5 |
2 |
14 of 14. |
|
17 |
Stratification - 15 pts (variance). |
8 |
2 |
15 of 15. |
The standard Control Test Prototypes are defaults that are shipped with Quality. The prototypes illustrate the basic pattern that is evaluated. Control tests that you create are variations that are based on specific prototypes.
|
Description |
|
|
Value < LSL or > USL. |
|
|
Current point beyond zone A. |
|
|
K consecutive points in zone C or beyond. |
|
|
K consecutive points steadily increasing or decreasing. |
|
|
K consecutive points alternating up and down. |
|
|
k of K consecutive points in zone A or beyond. |
|
|
k of K consecutive points in zone B or beyond. |
|
|
K consecutive points in zone C above and below the centerline. |
|
|
K consecutive points beyond zone C. |
See Also
Control Procedures
Control procedures are a convenience mechanism that you use to specify an overall testing and control scheme that is executed as process data is collected and analyzed. Each procedure is comprised of a list of control tests (listed in order of execution), and optionally, subgroup milestones indicating a progression for control limit calculations. You associate procedures with inspection characteristics to achieve the desired level of process control, feedback, and alarming.
PeopleSoft provides four predefined control procedures, each with a varying number of tests. You can use these predefined control procedures, modify them, or create a set of procedures:
|
Description |
Control Tests |
|
|
1 |
Level I |
Specification limit violation. |
|
1 |
Level I |
Control limit violation (variance). |
|
1 |
Level I |
Control limit violation (mean). |
|
2 |
Level II |
Level I +. |
|
2 |
Level II |
Trend - 7 pts (mean). |
|
2 |
Level II |
Shift - 2 of 3 pts (mean). |
|
2 |
Level II |
Shift - 4 of 5 pts (mean). |
|
2 |
Level II |
Shift - 8 of 8 pts (mean). |
|
3 |
Level III |
Level II +. |
|
3 |
Level III |
Trend - 7 pts (variance). |
|
3 |
Level III |
Shift - 2 of 3 pts (variance). |
|
3 |
Level III |
Shift - 4 of 5 pts (variance). |
|
3 |
Level III |
Shift - 8 of 8 pts (variance). |
|
4 |
Level IV |
Level III +. |
|
4 |
Level IV |
Mixture - 8 pts (mean). |
|
4 |
Level IV |
Systematic variable - 14 pts (mean). |
|
4 |
Level IV |
Stratification - 15 pts (mean). |
|
4 |
Level IV |
Mixture - 8 pts (variance). |
|
4 |
Level IV |
Systematic variable - 14 pts (variance). |
|
4 |
Level IV |
Stratification - 15 pts (variance). |
See Also
Sampling Codes
Sampling codes indicate inspection priorities among characteristics and specify the needed frequency of inspection sampling. The codes can also help meet customer or regulatory auditing, reporting, and certification requirements by enhancing inspection instructions and associated documentation. The system provides code libraries for characteristic and inspection frequency classifications.
See Also
Understanding Graph and Display Preferences
Graph and display preferences determine the statistical and visual content of quality charts and graphs when viewed from both the PeopleSoft Internet Architecture and when using the (optional) Quality application client. You use graph and display preferences to:
Define the presentation and statistical content of Quality charts and graphs to meet particular business needs.
Enunciate details by overlaying related information such as specification limits, summary statistics, or control chart alarms.
Simplify the interpretation of data when viewed by operators or quality personnel.
Quality provides four predefined graph preferences that contain standard default options and settings for the available graph types. Use the Graph and Display Preferences component to add new preferences or change the settings of existing preferences to suit data analysis requirements. The following tables illustrate the predefined graph and display preferences.
Graph Preferences ID: 1 - Variable Data Entry Default
This table shows graph preferences ID 1:
|
Option |
Setting |
|
Default Working Graph. |
Control Chart. |
|
Default Pareto Chart Item. |
Control Test Violations. |
|
Pareto Cell Display Limit. |
25. |
|
Bar Graph Display Limit. |
10. |
|
Display Control Chart Alarms. |
Yes. |
|
Indicate Specs on Histogram. |
Yes. |
|
Statistics List. |
OBSRV.MEAN.MINIMUM.MAXIMUM.STDDEV. CP.CPK.CPL.CPU.PCLOWER.PCUPPER. PCTOTAL.LSL.USL. |
Graph Preferences ID: 2 - Attribute Data Entry Default
This table shows graph preferences ID 2:
|
Option |
Setting |
|
Default Working Graph. |
Control Chart. |
|
Default Pareto Chart Item. |
Defects. |
|
Pareto Cell Display Limit. |
10. |
|
Bar Graph Display Limit. |
10. |
|
Display Control Chart Alarms. |
Yes. |
|
Indicate Specs on Histogram. |
No. |
|
Statistics List. |
OBSRV.MEAN.MINIMUM.MAXIMUM.SUMDEF. DEFPH.DEFPT.DEFPM.DEFPU. |
Graph Preferences ID: 3 - Analysis Default
This table shows graph preferences ID 3:
|
Option |
Setting |
|
Default Working Graph. |
Control Chart. |
|
Default Pareto Chart Item. |
Control Test Violations. |
|
Pareto Cell Display Limit. |
25. |
|
Bar Graph Display Limit. |
25. |
|
Display Control Chart Alarms. |
Yes. |
|
Indicate Specs on Histogram. |
Yes. |
|
Statistics List. |
OBSRV.MEAN.MINIMUM.MAXIMUM.STDDEV.CP. CPK.CPL.CPU.PCSPEC.PCLOWER.PCUPPER. PCTOTAL.LSL.USL. |
Graph Preferences ID: 4 - Advanced Analysis Default
This table shows graph preferences ID 4:
|
Option |
Setting |
|
Default Working Graph. |
Control Chart. |
|
Default Pareto Chart Item. |
Control Test Violations. |
|
Pareto Cell Display Limit. |
25. |
|
Bar Graph Display Limit. |
25. |
|
Display Control Chart Alarms. |
Yes. |
|
Indicate Specs on Histogram. |
Yes. |
|
Statistics List. |
OBSRV.MEAN.MINIMUM.MAXIMUM.STDDEV. RANGE.VARIANCE.STDERR.COEFVAR. SKEWNESS. KURTOSIS.ZLOWER.ZUPPER.LOWER3S.UPPER3S. DISTYPE.Q1.MEDIAN. Q3.AVEMEANS.AVEVARS. CP.CPK.CPL. CPU.PCSPEC.PCLOWER.PCUPPER. PCTOTAL. LSL.USL. |
Common Elements Used in This Chapter
|
Control Chart ID |
A unique sequential number that is assigned to a control chart appears. The numbering starts at 101. |
|
Control Chart Name |
Enter a user-defined name for a control chart. |
|
Label |
Enter a control chart or subchart label. |
|
Control Test ID |
A unique sequential number that is assigned to a control test appears. The numbering starts at 101. |
|
Test Description |
Enter a user-defined description of the control test. As tests are violated, the description becomes the alarm name. |
|
Control Procedure |
A unique sequential number that is assigned to a control procedure appears. The numbering starts at 101. |
|
Procedure Description |
Enter a user-defined name for the control procedures. |
Defining Control Charts
To define control charts, use the Control Charts component (QS_CL_CHART). This section discusses how to:
Define control charts.
Copy configuration items.
Pages Used to Define Control Charts|
Page Name |
Definition Name |
Navigation |
Usage |
|
QS_CL_CHART0 |
Quality, Define Methods and Procedures, Control Charts, Define Control Chart |
Define the scope of the chart, such as chart prototype and testing zones. Use these charts for real-time or offline data analysis. |
|
|
QS_COPY0_PNL |
Click the Copy From button on multiple pages in Quality. |
Creates a new chart by copying an existing chart. |
Defining Control Charts
Access the Define Control Chart page (Quality, Define Methods and Procedures, Control Charts, Define Control Chart).
|
|
Click the Copy From button to create the new control chart by copying from an existing control chart. When you click this button, the Copy Configuration Item page appears. |
|
Chart Prototype |
Select a chart prototype. Values are: X & Moving Range, Xbar & Range, Xbar & Sigma, c Chart, np Chart, p Chart, and u Chart. The chart prototype that you select defines the standard formulas that are used to calculate subgroup values and control limits. |
|
Test Zones |
Enter the number of divisions between the upper control limit (UCL) and the mean (CL) limit lines that are used for control-test evaluations. Zones typically represent standard deviations. |
|
Data Type |
Select the type of data that is to be plotted on this chart. Values include: Variables: Measurable characteristics, such as length, mass, or time, and for characteristics that are derived from measurable characteristics, such as volume, density, or area. Defects: Characteristics that represent defect counts, which are counts of the number of defects observed per unit, such as scratches, blemished, or missing subcomponents. Defectives: Characteristics that represent counts of defective units and counts of how many units are defective using a pass or fail criteria. |
See Also
Copying Configuration Items
Access the Copy Configuration Item page (Click the Copy From button on multiple pages in Quality).
Create a new control chart by selecting an existing chart from the Copy From field.
Defining Control Tests
To define control tests, use the Control Tests component (QS_CL_TEST). This section discusses how to define control tests.
Pages Used to Define Control Tests|
Page Name |
Definition Name |
Navigation |
Usage |
|
QS_CL_TEST |
Quality, Define Methods and Procedures, Control Tests, Define Control Test |
Define tests for detecting loss of process control. Test violations are reported as alarms and noted on control charts. |
|
|
QS_COPY0_PNL |
Click the Copy From button on multiple pages in Quality. |
Creates a new control test by copying an existing control test. |
Creating Control Tests
Access the Define Control Test page (Quality, Define Methods and Procedures, Control Tests, Define Control Test).
|
|
Click the Copy From button to create the new control test by copying from an existing control test. When you click this button, the Copy Configuration Item page appears. |
Test Prototype
|
Prototype |
Select the pattern to use for performing tests for special causes of variation. This is also known as the Western Electric rule type. |
|
Pattern Example |
Displays a cursory illustration of the pattern that is tested. |
Note. The prototype illustration is standardized and is not adjusted based on the number of tested or trigger points that are entered for a specific control test.
Apply To
Select which subchart (Chart 1 or Chart 2) within a control chart to apply the test to. This enables alarming distinction between means and variance tests.
Sensitivity
|
Trigger Points |
Enter the number of points (subgroups) in violation that are necessary to trigger the alarm. |
|
Tested Points |
Enter the overall number of plotted points (subgroups) that are to be tested. For example, if the Trigger Points value is 3 and Tested Points is 6, then it takes three subgroups out of six in violation of the pattern to trigger the alarm. |
Defining Control Procedures
To define control procedures, use the Control Procedures component (QS_CL_PROC). This section discusses how to define control procedures.
Pages Used to Define Control Procedures|
Page Name |
Definition Name |
Navigation |
Usage |
|
QS_CL_PROC |
Quality, Define Methods and Procedures, Control Procedures, Define Control Procedure |
Define groups of control tests and control limit promotion milestones that are to be applied for online analysis. |
|
|
QS_COPY0_PNL |
Click the Copy From button on multiple pages in Quality. |
Creates a new control procedure by copying an existing control procedure. |
Defining Control Procedures
Access the Define Control Procedure page (Quality, Define Methods and Procedures, Control Procedures, Define Control Procedure).
|
|
Click the Copy From button to create the new control procedure by copying from an existing control procedure. When you click this button, the Copy Configuration Item page appears. |
Limit promotion milestones indicate the subgroup numbers at which an automatic recalculation of control limits take place. As data is collected over time and corrective action is taken, the process should become more stable, yielding tighter control limits for periodic recalculations and reflecting a natural reduction in process variation. In Quality, this concept is considered to be control limit promotion.
Note. These settings are optional. Leave all three fields blank if you want to disable automatic control limit promotion.
|
Preliminary |
Enter the number of subgroups that the system will use for the first calculation point for a new or unstable process. |
|
Monitoring |
Enter the number of subgroups that the system will use for the second calculation point for a process reaching stabilization. |
|
OnGoing |
Enter the number of subgroups that the system will use for the third calculation point, which is assumed to be the point at which the process reaches maturity. |
|
Recalculate |
Enter the number of subgroups that the system will use at which limits are recalculated on a recurring basis after an ongoing status is achieved. This setting is optional and only applies to control limits that are calculated by using the promotion milestones. |
The history settings represent the number of prior subgroups that are recalled from the database for the purpose of calculating control limits. This number includes the currently entered subgroup.
|
Limits Calculate Window |
Enter the number of subgroups to recall from history to create a control limit calculation window. Values are 2 through 250. |
|
Graph Window |
Enter the number of subgroups that are used when producing a graphic display during online data entry and analysis. Values are 1 through 99. |
Control tests are evaluated during time of analysis in the order that this list specifies. The prompt selections are comprised of the Quality product defaults and any tests that you create. The system flags and reports up to three test violations per subgroup: one against each subchart, such as violations against both the means and variance, and one against specification limit violations.
See Also
Defining Sampling Codes
To define sampling codes, use the Sampling Codes component (QS_MFDS_TYPES). This section discusses how to:
Maintain characteristic class types.
Maintain sampling frequency types.
Note. Characteristic class and sampling frequency types are for reference and documentation only. System and processing behavior are not affected by their settings.
Pages Used to Define Sampling Codes|
Page Name |
Definition Name |
Navigation |
Usage |
|
QS_CLASS_TYPE |
Quality, Define Methods and Procedures, Sampling Codes, Characteristic Class Types |
Maintain characteristic class types that note differences in inspection criticality or function. You use characteristic class types when defining measurement plans. |
|
|
QS_FRQ_TYPE |
Quality, Define Methods and Procedures, Sampling Codes, Sampling Frequency Types |
Maintain sampling frequency types that note the frequency for taking inspection samplings. You use sampling frequency types when creating control plans. |
Maintaining Characteristic Class Types
Access the Characteristic Class Types page (Quality, Define Methods and Procedures, Sampling Codes, Characteristic Class Types).
Enter a class type code to qualify the quality control characteristics, either by criticality or function. Class types are associated with characteristics when you create measurement plans.
See Also
Maintaining Sampling Frequency Types
Access the Sampling Frequency Types page (Quality, Define Methods and Procedures, Sampling Codes, Sampling Frequency Types).
Enter a frequency code to specify the recommended frequency of inspection for a control plan.
See Also
Maintaining Graph and Display Preferences
To define graph preferences, use the Graph Preferences component (GRAPH_PREF). This section discusses how to maintain graph and display preferences.
Pages Used to Maintain Graph and Display
Preferences|
Page Name |
Definition Name |
Navigation |
Usage |
|
QS_GRSET |
Quality, Define Methods and Procedures, Graph Preferences, Define Graph Preferences |
Define the settings for calculations and the defaults for graphic displays for new graph preferences or change settings on predefined graph preferences. The online graphic displays and statistical content are determined by how you define these preferences. At run time these settings remain static and cannot be changed by the user. If you are using the Quality application client offline against an extracted or user-defined data set, the graph type is selectable and certain settings can be changed by using the Modify Graph menu option from the Quality application client toolbar. |
|
|
QS_STATSELECT_PNL |
Click the Statistics List link on the Define Graph Preferences page. |
Associate statistics with control charts, histograms, or Pareto charts. |
Defining Graph and Display Preferences
Access the Define Graph Preferences page (Quality, Define Methods and Procedures, Graph Preferences, Define Graph Preferences).
|
Graph Preference ID |
A sequential ID that is automatically assigned to a graph by the system appears. |
|
Graph Preference Name |
Enter a user-defined name for the graph. |
|
Default Working Graph |
Select the default graph that you want to view when performing online operations, such as data entry and alarm review. Options are: Control Chart, Histogram, and Pareto Chart. |
|
Default Pareto Chart Item |
Select the attribute type that you want to plot on the Pareto Chart. Options are: Control Test Violations, Corrective Actions, Defects, and Probable Causes. |
|
Pareto Cell Display Limit |
Enter the number of cells to display based upon cell count and the graphing order that you select. |
|
Bar Graph Display Limit |
Enter the number of bars to display based on the statistics value and the graphing order that you select. |
|
Display Control Chart Alarms |
Select to activate alarm point enunciation on each chart. Alarms are indicated on a separate (stacked) bar graph located below the control chart. The charts are arranged so that alarms (bars) will line up for each plot point on the control chart. The absence of a bar indicates no alarms for that point, a bar extending above the x-axis indicates an alarm charged against the means chart, and a bar extending below the x-axis indicates an alarm against the variance chart. If this option is not selected then the bar graph will not appear. |
|
Indicate Specs on Histogram |
Select to overlay the current characteristic specification limits on the histogram. For online graphs, the specification limits are indicated in the cell listing area and not actually drawn on the graph. |
|
Statistics List |
Click this link to access the Statistic Selections page, where you can select the statistics that you want to associate with control charts, histograms, or Pareto charts and the order in which the statistics appear. |
Assigning Statistic Selections
Access the Statistic Selections page (Click the Statistics List link on the Define Graph Preferences page).
Use the scroll function to display all statistics and associated descriptions that are available in the Statistics Catalog. Click the different statistics links to select and place them into the list for the graphic or display. The following table shows the 44 statistics that are available on the Statistic Selections page.
|
Statistic |
Statistic Description |
Data Type Qualifier |
|
MEAN |
Mean. |
Any |
|
OBSRV |
Observations. |
Any |
|
MINIMUM |
Minimum. |
Any |
|
MAXIMUM |
Maximum. |
Any |
|
STDDEV |
Std Dev (standard deviation). |
Any |
|
RANGE |
Range. |
Any |
|
VARIANCE |
Variance. |
Any |
|
STDERR |
Std Error (standard error). |
Any |
|
COEFVAR |
Coef Vars (coefficient variables). |
Any |
|
SKEWNESS |
Skewness. |
Any |
|
KURTOSIS |
Kurtosis. |
Any |
|
ZLOWER |
Lwr Z Score (lower Z score). |
Any |
|
ZUPPER |
Upr Z Score (upper Z score). |
Any |
|
LOWER3S |
Lwr 3 Sigma (lower 3 Sigma). |
Any |
|
UPPER3S |
Upr 3 Sigma (upper 3 Sigma). |
Any |
|
DISTYPE |
Dist Type (distribution type). |
Any |
|
SUMX |
Sum. |
Any |
|
SUMX2 |
Sum of Squares. |
Any |
|
SUMZ |
Sum Sgrp Sizes (sum of subgroup sizes). |
Any |
|
SIZEN |
Subgroup Size. |
Any |
|
Q1 |
Quartile 25%. |
Any |
|
MEDIAN |
Median. |
Any |
|
Q3 |
Quartile 75%. |
Any |
|
AVEMEANS |
X Dbl Bar (X double bar). |
Any |
|
AVEVARS |
R Bar. |
Variables |
|
CP |
Cp. |
Variables |
|
CPK |
Cpk. |
Variables |
|
CPL |
Cpl. |
Variables |
|
CPU |
Cpu. |
Variables |
|
CPK90 |
Cpk @ 90%. |
Variables |
|
PCSPEC |
Cr. |
Variables |
|
PCLOWER |
Est % Below Spec (estimated percent below specification). |
Variables |
|
PCUPPER |
Est % Above Spec (estimated percent above specification). |
Variables |
|
PCTOTAL |
Est % Total (estimated percent total). |
Variables |
|
SUMDEF |
Sum Defects. |
Defects |
|
DEFPH |
Defects/100. |
Defects |
|
DEFPT |
Defects/1000. |
Defects |
|
DEFPM |
Defects/Mil. |
Defects |
|
DEFPU |
Defects/Unit. |
Defects |
|
LSL |
LSL. |
Any |
|
USL |
USL. |
Any |
|
FACT1 |
Factor 1. |
Any |
|
FACT2 |
Factor 2. |
Any |
|
TRANS |
Transform. |
Any |