 Understanding Control Plans
This chapter provides an overview of control plans, lists prerequisites, and discusses how to:
Define attribute groups.
Define traceability sets.
Maintain stations.
Define control plans.
Review control plan configurations.
Understanding Control Plans
Control plans identify specific quality control points or processes and provide an overall structure for data collection, reaction, and analysis. Control plans comprise these features:
Specific hierarchy field definitions that identify the process.
Measurement plans containing the characteristics that you want to monitor.
Attribute codes within categories to facilitate data annotation within reaction plans.
Traceability information for use in tracking and identifying product variation.
(Optional) Control limits that are used to maintain a predetermined level of process control.
Use the following steps to begin online quality data collection and control:
Establish a Quality business unit.
Create the quality function.
Define measurement plans.
Create the control plan.
Establish the relationship between each component so that you can record inspection data in the quality control environment.
PeopleSoft Quality Control Plan Configuration
This diagram illustrates the Quality control plan configuration using a quality function, measurement plan, and control plan:
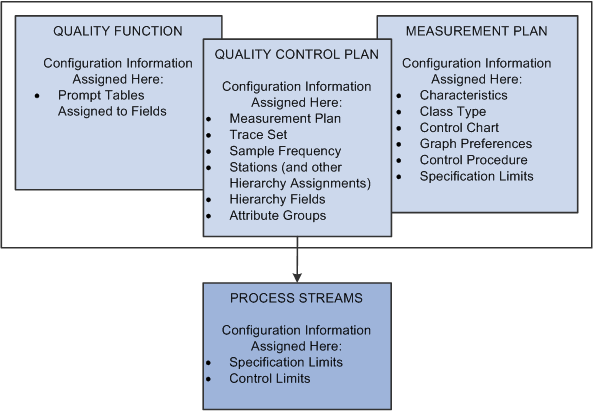
Quality control plan configuration
Quality Functions
A quality function is a set of fields that identify nonparametric information and map process-specific field information into Quality for process identification, data tracking, and analysis. Hierarchy fields define the actual process—stream—against which you collect and monitor data. Trace fields make it possible to collect associated information that is used for tracking purposes.
Measurement Plans
Measurement plans group characteristics that are used as quality indicators for a given process. Establish specific control methods, such as sampling, charting, and testing criteria, at this level.
Control Plans
The control plan brings together application, measurement, and control and response criteria for a specific product or process. PeopleSoft refers to a unique combination of hierarchy fields and a measurement plan as a control plan. The combination of fields and characteristics within the measurement plan is called a process stream. To this point, all elements of configuration that you establish are not yet applied to a specific process. The control plan provides the remaining element of configuration, defining the process and applying methods of inspection and control to that process.
When defining a control plan, you:
Reference a quality function to enter specific hierarchy field definitions that identify the process.
Assign a measurement plan to each individual hierarchy field combination.
Each characteristic that is associated with the plan then becomes a process stream with its own associated details.
Determine the method for data entry for each individual characteristic.
You can record data by subgroup or by sample for each characteristic.
Relationship Example
This diagram illustrates the relationship between a quality function, measurement plan, and control plan within a quality configuration:
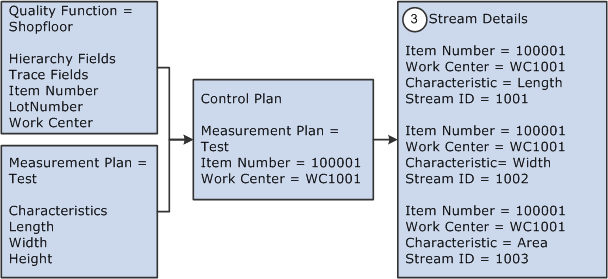
Example of Quality configuration
See Also
Prerequisites
Before you begin, consider the data tracking and collection requirements of areas where Quality is implemented. That is, how do you identify processes, what information is available or needed for tracking purposes, and how do you react to out-of-control conditions?
This table provides recommendations for configuring a quality plan either in combination with other PeopleSoft applications or as a standalone:
|
PeopleSoft Application |
Use |
Define Criteria in This Order |
|
Inventory |
Returned Material Authorization activity. |
Define items by using the Item Definition and Item Attributes by Unit components in Inventory. When creating control plans, be sure to reference an item that already exists. |
|
Purchasing |
Purchase receiving activity. |
1. Define items by using the Item Definition and Item Attributes by Unit components in Inventory. 2. Define vendors by using the Maintain Vendors component in Purchasing. When creating control plans, be sure to reference the purchasing vendor for the item. |
|
Production Management |
Recording inspection data against production IDs or schedules in the manufacturing environment. |
1. Define items by using the Item Definition and Item Attributes by Unit components in Inventory. 2. Define machines by using the Define Resources component in Manufacturing. You can use station codes to identify various machine parts or outputs as you create control plans. Defining machines or stations is optional. 3. Define work centers by using the Define Work Centers and Tasks component in Manufacturing. When you record inspection samplings in Quality for manufacturing activity, reference the work center and machine where the sampling occurred. 4. Define routings for the items by using the Structure Routings component in Manufacturing. When recording inspection samplings relating to manufacturing activity, you can specify at what operation the sampling is taken. Defining operation sequences is optional. 5. Define the production area by using the Area Maintenance component in Manufacturing. 6. Reference the product type for the order that you are recording information against. The system supplies this field for you. Options are: rework, production, or tear down. |
|
Quality |
Standalone or with other applications. |
1. Define all the data that you associate with the hierarchy fields on the quality function. 2. Add the data to other applications in the correct sequence. 3. Establish the inspection criteria that is necessary for Quality. |
Defining Attribute Groups
To define attribute groups, use the Attribute Groups component (QS_ATTRIB_SET). This section provides an overview of attribute groups and discusses how to:
Define attribute labels.
Maintain attribute codes.
 Understanding Attribute Groups
Attribute groups are categorized lists of defect, cause, and action codes that you relate to one or more control plans. The system uses the lists as prompts during data entry and alarm review to assist in the classification of problems and corrective measures that are associated with a subgroup.
Using attribute codes, you can:
Apply them to inspection samplings during quality data collection and alarm review activities.
Provide qualitative annotation against a process.
Present concise selection lists when noting product defects or indicating responses to out-of-control conditions.
Enable detailed Pareto analysis of individual elements.
Attribute groups are made up of various categories: defects, probable causes, and corrective actions. Each category comprises one or more components that, when combined, form complete phrases. During data entry, the system builds attribute phrases as individual components are selected. You can analyze the resulting attribute phrases in their entirety or by individual components to investigate root problems or causes.
The following attribute categories are available:
Defect components.
Cause components.
Corrective action components.
You can define up to three levels of defect components:
|
Defect Component 1 (Location) |
Defect Component 2 (Fault) |
Defect Component 3 (With) |
|
Top |
Broken |
Bolt |
|
Bottom |
Worn |
Resistor |
Cause components typically identify a problem that affects the process that you are monitoring. You can define up to two levels of cause components:
|
Cause Component 1 (Problem) |
Cause Component 2 (Affecting) |
|
Worn |
Tool |
|
Temperature Setting |
To Low |
Action components describe what actions are taken in response to problems or out-of-control conditions. This is a single component.
Pages Used to Define Attributes|
Page Name |
Definition Name |
Navigation |
Usage |
|
QS_ATTRIB_SET |
Quality, Establish Control Plans, Attribute Groups, Attribute Labels |
Define the attribute and the labels that are used for the defect, cause, and corrective action components. |
|
|
QS_ATTRIB_DEFN |
Quality, Establish Control Plans, Attribute Groups, Attribute Codes |
Maintain attribute codes for their associated attribute categories for an attribute group. |
Defining Attribute Labels
Access the Attribute Labels page (Quality, Establish Control Plans, Attribute Groups, Attribute Labels).
|
Attribute Group |
Enter a name for the group. |
|
Defect Component 1, 2, and 3 |
Define a label for each of the defect components. Enter new labels for the components or use the defaults. Entering a blank label disables that component from entry and selection. That is, the system does not generate a pick list for that specific attribute component during data entry or alarm review. |
|
Cause Component 1 and 2 |
Define a label for each cause component. Enter a blank label to disable a component. |
|
Corrective Action |
Define a label for the corrective action codes. |
Note. You cannot blank out all labels, such as disable all components, for an attribute category. If all labels are blank, the system inserts default labels when it saves the group.
Maintaining Attribute Codes
Access the Attribute Codes page (Quality, Establish Control Plans, Attribute Groups, Attribute Codes).
When this page initially appears, all the attribute codes that are associated with all components of the attribute group appear. Select a particular type of attribute component to view its codes.
|
Attribute Component |
Select the type of attribute that you want to view or define. Types include:
|
|
Attribute Type |
Displays the type of attribute, such as action, cause, or defect component. This field appears only when you select List All Attribute Components in the Attribute Component field. |
|
Code |
Enter a unique code for the attribute type. |
|
Attribute Text |
Enter the actual text that is used to build an attribute phrase. |
|
Inactive |
Select the check box if you want to deactivate the code. Inactive codes are not available for selection during processing. |
See Also
Defining Traceability Sets
To define traceability sets, use the Traceability sets component (QS_TRACE_SET). This section provides an overview of traceability sets and discusses how to create traceability sets.
Understanding Traceability Sets
A traceability set is a group of fields that specify the tagging or trace information that is collected during inspection. Each set comprises the trace fields that are defined within its parent quality function. Use traceability sets to:
Assign to one or more control plans.
Collect traceability item information at the time of inspection.
Maintain process or product content and handling information, such as lot or serial ID.
This information is useful in determining causes of variation or in performance comparisons.
Page Used to Define Traceability Sets|
Page Name |
Definition Name |
Navigation |
Usage |
|
QS_TRACE_SET |
Quality, Establish Control Plans, Traceability Sets, Define Traceability Set |
Create a traceability set. |
Creating Traceability Sets
Access the Define Traceability Set page (Quality, Establish Control Plans, Traceability Sets, Define Traceability Set).
Traceability fields are inherited from the parent quality function. You cannot add additional fields, but you can edit or inactivate field entries.
You can establish each field at the individual or subgroup level. If the field is set as Individual, the system prompts you for trace data for each sample in a subgroup. For example, if a subgroup size is five, and a traceability set has a Lot ID field set to Individual, then you are prompted for five lot numbers—one for each measured value in the subgroup. In the same example, if the field is set to Subgroup, then you are prompted for one lot number for the entire subgroup.
|
Active |
Select to activate the trace field. The system prompts for and displays only active fields during data entry. You can activate up to 12 fields for a traceability set. |
|
Field Name |
The actual trace field (PeopleSoft object) name. |
|
Level |
Select the level at which you collect and store the trace field information: Individual: A trace field value is entered for each individual sample of a subgroup. Subgroup: A single trace value is entered for the entire subgroup regardless of subgroup size. |
|
Input Type |
Specify how data is entered in the trace field: Auto Dflt (auto default): The default value is read from the input source or internal call-out routine and appears on the data-entry page. Override this entry by typing into the field or selecting from a prompt table list. Fixed: A value is read from the input source or internal call-out routine and appears on the data-entry page. You can't override this entry. User Input: Enter values directly into the field or select from a prompt table list. |
|
Prompt Table or View |
Specify the prompt table to associate with the trace field. This is the table or view that the system uses to populate drop-down lists during data entry. The default is inherited from the quality function, but you can override it here. Prompt tables are assumed to be Structured Query Language (SQL) tables or views that are created in a working database and are validated by using the Tools Record Definition table (QS_PSRECDEFN_VW). This field is not applicable for an input type of fixed. |
|
Custom Field Format |
Enter the name of an optional PeopleTools custom field-formatting object to use for display or input control. |
|
Input Source |
Set the source for populating default or fixed-trace values. The trace field value is read from this source at the time of data entry if either Auto Dflt or Fixed is specified for the Input Type field. This field is not applicable for an input type of user input. Options include: %Datetime (datetime): Gets the current server date and time. %OperatorId (operator ID): Gets the current user ID. &G_TRACE_01 through &G_TRACE_12: Gets the value of a global PeopleCode variable that is defined prior to starting data entry. |
Maintaining Stations
To define stations, use the Stations component (QS_STATIONS). This section discusses how to define stations.
Page Used to Maintain Stations|
Page Name |
Definition Name |
Navigation |
Usage |
|
QS_STATIONS |
Quality, Establish Control Plans, Stations, Define Stations |
Use stations in combination with other hierarchy fields to differentiate or track multiple points of control. For example, stations can identify various machine parts or tooling facets, with each having a unique set of process-control limits. |
Defining Stations
Access the Define Stations page (Quality, Establish Control Plans, Stations, Define Stations).
Enter a station code to associate with the Quality business unit.
Defining Control Plans
To define control plans use the Control Plans component (QS_CREATE_QCPLANS). This section provides an overview of control plans and discusses how to:
Load control plans.
Maintain control plans.
Create multiple control plans at once.
Maintain process streams.
Understanding Control Plans
The control plan is the combination of one set of characteristics with a specific instance of hierarchy values. The control plan:
Brings together all areas of control into one single plan for data collection and analysis.
Is required to collect data.
Is the method by which you apply quality controls to specific hierarchy fields and the measurement plan.
Because a control plan contains a measurement plan (which can have more than one characteristic) when you save the control plan, the system creates a process stream beneath the control plan for each characteristic in the measurement plan. The process streams become the actual points of control.
A Quality business unit, quality function, and measurement plan must exist to create control plans. You can delete only those control plans that haven't been previously saved.
Pages Used to Define Control Plans|
Page Name |
Definition Name |
Navigation |
Usage |
|
QS_ROOT_FILTER |
Quality, Establish Control Plans, Control Plans, Load QCPlans |
Load a limited list of control plans with which to work. |
|
|
QS_STREAM_ROOT |
Quality, Establish Control Plans, Control Plans, Maintain QCPlans |
Define and maintain control plans that bundle all associated inspection and control information into individual plans. |
|
|
QS_QCPLAN_DEFINE |
Quality, Establish Control Plans, Control Plans, Create QCPlans |
Create multiple control plans at once. Enter the different fields on the page or use a wild card pertaining to a hierarchy field. |
|
|
QS_STREAM_DETAIL |
Click the Details button on the Maintain QCPlans page. |
Maintain control limits for individual streams that are associated with each control plan. |
Loading Control Plans
Access the Load QCPlans (load quality control plans) page (Quality, Establish Control Plans, Control Plans, Load QCPlans).
All fields are optional.
Configuration Settings
Select the fields by which you want to filter control plans.
Hierarchy Constant
Displays the hierarchy fields that are associated with the quality function. Select the hierarchy fields by which you want to filter the control plans.
Maintaining Control Plans
Access the Maintain QCPlans (maintain quality control plans) page (Quality, Establish Control Plans, Control Plans, Maintain QCPlans).
The first columns on the page vary depending on the quality function that you select. The columns are the individual hierarchy fields associated with the quality function. Enter the individual hierarchy fields for the control plan.
Data Collection Tab
Select the Data Collection tab.
|
Data Entry Method |
Select the data-entry method: By Sample or By Subgroup. |
|
Data Entry Name |
Enter a name by which to group multiple control plans. By giving the same name to multiple rows, you can gather more than one set of streams for data entry and data extraction purposes. |
|
Sequence |
Enter a sequence number to define the order in which control plans with a common data-entry name appear in data entry. |
|
Sample Frequency |
Select the recommended sampling frequency for this control plan. |
|
Trace Set |
Select a trace set for the control plan. This field is active if you associate trace fields with the selected quality function. |
|
Attribute Group |
Select an attribute group to the control plan. This field is active if attribute groups are defined for the selected Quality business unit. |
Examples of Data-Entry Methods
Using the by sample method for a control plan, you inspect all the characteristics for the first sample, then all the characteristics for the next sample, such as inspecting a large item that must be fixtured. You take all measurements of that item prior to fixturing the next item.
This diagram illustrates the by sample data-entry method where item 1 is inspected for characteristics A, B, and C, then item 2 is inspected for characteristics A, B, and C, and finally item 3 is inspected for characteristics A, B, and C:
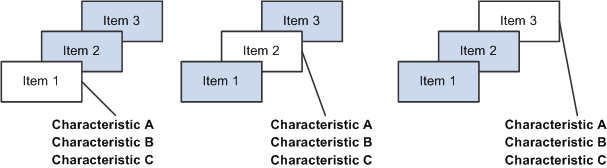
Example of the by sample data-entry method
Using the by subgroup method, you inspect one characteristic for a group of items, then another characteristic for a group of items, such as inspecting several small items in succession with a specific gauge. You complete the sample for each characteristic prior to using the next gauge.
This diagram illustrates the by subgroup data-entry method where items 1, 2, and 3 are inspected for characteristic A, then items 1, 2, and 3 are inspected for characteristic B, and finally items 1, 2, and 3 are inspected for characteristic C:
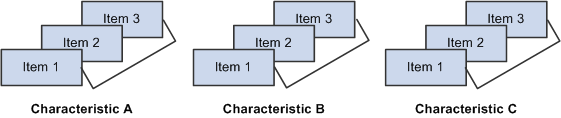
By subgroup data-entry method
If you are collecting data against this control plan by using data entry by control plan, the system uses the method that you specify on this page. Otherwise, the system uses the data-entry method that you assign on the access list. The system uses the access list when setting up data entry for multiple control plans.
Status Tab
The system displays the number of streams that exist under this control plan in the Stream Count field.
See Also
Creating Multiple Control Plans at Once
Access the Create QCPlans (create quality control plans) page (Quality, Establish Control Plans, Control Plans, Create QCPlans).
Configuration Settings
Select or enter the values that you want to apply to the new control plans.
Wildcard (optional)
This group box affects the Hierarchy Constants group box.
|
Field |
Select the field for which you want to use a wildcard. |
|
String |
Enter the wildcard using SQL-link syntax. For example, if you select Item ID as the field for the wildcard, and you want to create control plans for all items containing the letter A, enter %A% in the String field. |
|
Source |
Enter the prompt table that is assigned to this field in the quality function definition. You can override this entry with any valid table or view containing one column matching the wildcard field. |
Hierarchy Constants
If you select a hierarchy field as a wild card, you can't enter data in that particular field in this group box.
The hierarchy fields in this group box are associated with the quality function. The fields vary depending on the quality function that you select.
See Also
Maintaining Process Streams
Access the Stream Details page (Click the Details button on the Maintain QCPlans page).
Use this page to define stream-specific data-collection settings and specification limits.
|
Stream ID |
A unique sequential ID that is assigned by the system to each stream appears. It cannot be changed. |
|
Sequence |
Enter the sequence of how the characteristics are ordered when performing data entry against the plan. |
|
UOM (unit of measure), LAL (lower acceptance limit), and UAL (upper acceptance limit) |
The system displays the values that are inherited from the measurement plan. The fields are display-only; you can't change them. The Cascade Lock field doesn't affect them. |
|
Cascade Lock |
With cascaded fields, the values that you assign at the characteristic level in the measurement plan cause the plan to act as a template. You can override the values that cascade to streams at any time at the stream level. You might want to change a specification limit in the characteristic instead of changing it on every stream, which is an advantage of cascading. However, if you don't want to overwrite the values for specific streams with values from the characteristic, protect those streams with the cascade lock. Select the Cascade Lock check box if you want to lock the stream from being updated by changes that are made to the parent characteristic from the measurement plan. Changes in characteristics that are cascaded to streams are changes to the active setting, specification limits (lower specification limit and upper specification limit), and factors 1 and 2. |
|
LSL (lower specification limit), USL (upper specification limit), Factor 1 , and Factor 2 |
Enter stream-specific specification limits that you want to use. By default, the limits that are defined for the underlying characteristic are inherited. Select the Cascade Lock check box to protect these entries from changes that are made at the measurement plan level. |
Select the Control Limits tab to view or change working control limits for individual streams.
|
Displays the control limit status for a particular stream: None: Limits are not yet assigned or calculated for the stream. Preliminary: First level of promotion. Monitoring: Second level of promotion. Ongoing: Third and final level of promotion. Recalc (recalculate): Recalculated after ongoing. Assigned: Limits are assigned manually. Reset: Limits are reset manually to begin the promotion cycle that is defined by the control procedure that is assigned to this characteristic. |
|
|
LCL (1) [lower control limit (graph 1)], CL (1) [control limit (1)], UCL (1) [upper control limit (1)], LCL (2), CL (2) , and UCL (2) |
Display if control limits are established either by assignment or by calculation. The fields reflect the current control limit values and status of the stream. |
Note. Quality assigns the statuses according to the limit promotion milestones information that you define by using the Control Procedures page.
|
|
Click the Assign Control Limits button to assign process control limits. The limit status changes to assigned, which means to ignore the promotional milestones that are associated with a control procedure that is associated with the measurement plan. Enter the control limits that you want to assign to the stream in the control limit fields: LCL (1), CL (1), UCL (1), LCL (2), CL (2), or UCL (2). |
Resetting Process Control Limits
|
|
Click the Reset Control Limit Promotions button to restart the limit calculation-promotion cycle. The Clim Status value changes to Reset. |
Control Limit Promotion Method Example
In a typical control limit promotion method, the limits are assumed to be ever tightening over time as the process matures and process improvement methods take effect. This diagram illustrates process control limits where the subgroup milestones of 10, 20, and 30 are used as examples only and are not fixed:
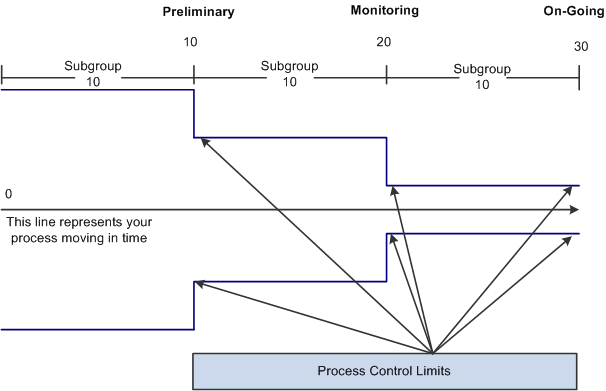
Understanding process control limits
The following steps show how a control limit promotion cycle progresses:
For a new process with unknown capability, control limits are indeterminate and the system reflects a preliminary status.
As the process matures, the promotion cycle continues to collect data and makes improvements to the process through corrective actions. Control limits are recalculated at intervals, and the status progresses to monitoring and then to ongoing to reflect heightened stability and tighter control.
At any time during the different levels of promotion, you can reset control limits and restart the cycle. When you reset control limits, the system status is reset until it reaches the first promotion milestone (preliminary).
You can also assign specific control limits at any time. When you assign control limits, the system status is assigned and limit promotions are not performed.
See Also
Reviewing Control Plan Configurations
This section discusses how to:
Review where-applied characteristics.
View stream specifications.
View control limit history.
Common Elements Used in This Section
|
Date From |
Select the beginning date from which you want to view data. The system initially displays the current date (minus one day) in the field. |
|
Active Only |
Select this check box to indicate that you want to see only the active characteristics and streams. |
|
Full History |
Select this check box if you want to view the full specification or control limit history from a given date. |
|
Graph Results |
Click the Graph Results button to launch a Pareto analysis of the original summary value for each inquiry. |
Pages Used to View Control Plan Configuration
Information|
Page Name |
Definition Name |
Navigation |
Usage |
|
QS_MFDSCLASS_INQ |
Quality, Review Quality Plans, Characteristics-Where Applied |
View where and how often characteristics are applied to control plans. |
|
|
QS_SPEC_LIM |
Quality, Review Quality Plans, Stream Specifications |
View stream specification change history for individual process streams. |
|
|
QS_CONTROL_LIMIT |
Quality, Review Quality Plans, Control Limits |
View control-limit history for individual process streams. |
Reviewing Where-Applied Characteristics
Access the Characteristics/Where Applied page (Quality, Review Quality Plans, Characteristics-Where Applied).
The columns on this page vary depending on the quality function that you select. The columns are the hierarchy fields that are associated with the quality function.
Enter the filter fields to view specific data. The specification limits are the current limits applied to each stream and may be defined at the stream level or inherited from the underlying measurement plan characteristic.
Characteristic Details Tab
Access the Characteristic Details tab.
The system displays the characteristic, class type code, LSL, USL and UOM that is associated with each characteristic.
See Also
Using PeopleSoft Quality Graphics
Viewing Stream Specifications
Access the Stream Specifications page (Quality, Review Quality Plans, Stream Specifications).
The system displays the process stream specifications and specification changes, such as changes that are applied to specifications at the characteristic and stream levels, for all control plans that are associated with the Quality business unit and quality function that is selected. View all characteristics that are defined for all control plans (process streams) for a quality function or select a specific set of characteristics by selecting the measurement plan.
The first columns on the page vary depending on the quality function that you select. These columns are the hierarchy fields that are associated with the quality function.
Specification Limit Details Tab
Select the Specification Limit Details tab.
|
Origin Code |
The code appears, indicating where the specification limits are set or changed. Codes include:
|
|
USL, LSL, Factor 1, and Factor 2 |
The systems displays the information that is associated with the process stream. |
See Also
Viewing Control Limit History
Access the Control Limits page (Quality, Review Quality Plans, Control Limits).
You can further qualify the inquiry by selecting to see the full specification history. To do this, select the Full History check box. This option ignores the date from field.
If you want to see the current specifications, deselect the Full History check box and select the Active Only check box
The first columns on the page vary depending on the quality function that you select. These columns are the hierarchy fields that are associated with the quality function.
Control Limit Details (1) Tab
Select the Control Limit Details (1) tab.
Displays control limits for the first subchart that is assigned to the characteristic.
Control Limit Details (2) Tab
Select the Control Limit Details (2) tab.
Displays the control limits for the second subchart if you are using a control chart that is constructed of multiple subcharts.
See Also