 Understanding the Quality Data Collection
Process
Understanding the Quality Data Collection
Process
This chapter provides an overview of the quality data collection process and discusses how to:
Define data-entry access lists.
Enter, maintain, and edit quality data.
Use subgroup and sample methods to enter data.
Work with control plans.
Understanding the Quality Data Collection
Process
Operator interaction is part of the data-collection methodology. Quality provides you with a comprehensive data-collection environment that combines operator data entry with online analysis and immediate feedback. You record sample information against a control plan and then view analysis results to make improvements or corrections to the process.
You can enter, maintain, and edit quality data against variable, defect, or defective characteristics within a control plan. The system creates a data-entry session for each new sampling, based on the inspection frequency, as a container for the related measurement, cause, and action information that you entered.
 Data-Entry Pages
To access data-entry pages:
Select a control plan from a list of often-used plans (access list).
Enter the specific hierarchy fields associated with the control plan.
Each method accesses the same set of pages that you use to create a new data-entry session or complete a pending session.
See Also
Defining Data-Entry Access Lists
Quality Data Entry
This diagram illustrates the process flow when creating a new data-entry session against a control plan. Choose to access the control plans using the access list mode or the hierarch fields mode. For the new session, enter data using the subgroup method or the sample method and then the session ID is created. Next, submit the readings for analysis. Review and diagnose any system-generated alarms and review the results in graphic form:
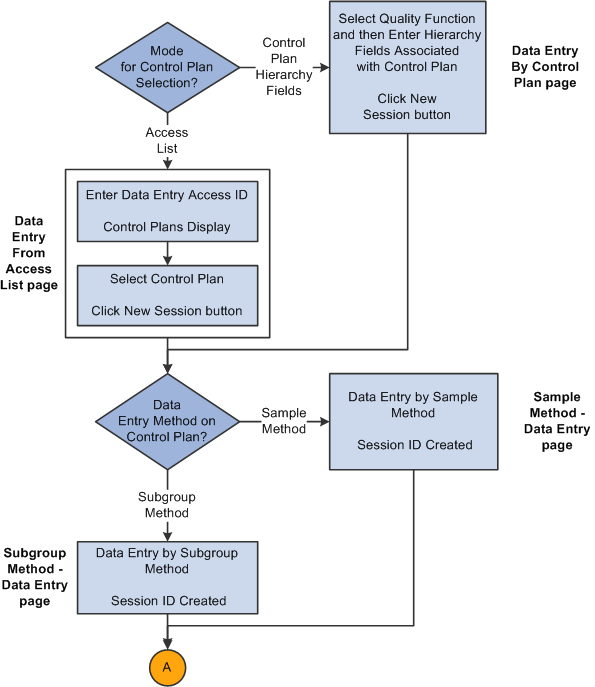
Entering quality data business process flow (1 of 2)
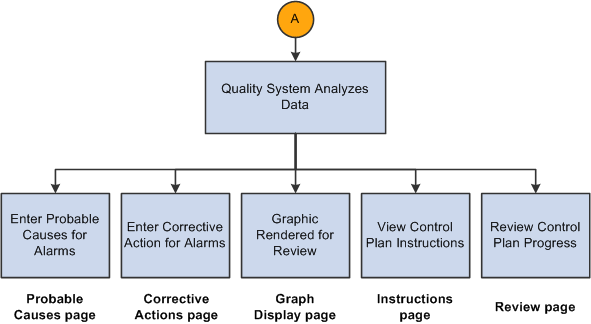
Entering quality data business process flow (2 of 2)
Use the following procedures to initiate a quality session and record sampling data.
To enter quality data:
Determine how you want to access the control plans.
If you choose the access list mode, perform the steps in the "To choose the access list mode" procedure.
If you choose the hierarchy field mode, perform the steps in "To choose the hierarchy field mode" procedure.
To choose the access list mode:
Create an access list by using the Define Operator Access List page and associate control plans with the access list using the Control Plan Selections page.
Enter the data entry access ID and then select the control plan on the Data Entry From Access List page with which you want to work.
Click the New Session button.
Enter data associated with the characteristics on the control plan on the Subgroup Method - Data Entry page or the Sample Method - Data Entry page.
The system invokes the appropriate page depending on the data-entry method defined for the control plan. While entering data you can view:
Instructions for the control plan on the Instructions page.
Current results for a sampling on the Review page.
Submit the readings for analysis.
Review and diagnose the alarms that the system generated.
If the system generates alarms, you can:
View the alarm notifications for each characteristic.
Enter the causes for the alarms on the Probable Causes page.
Enter the corrective actions taken to correct the alarm condition on the Corrective Actions page.
(Optional) Enter causes for potential problems and corrective actions on the Probable Causes and Corrective Actions pages even if the system does not generate alarms.
View the results as a graphic.
The working control chart that you assigned to the characteristic appears on the Graph Display page.
To choose the hierarchy field mode:
Select the quality function and then enter the hierarchy fields associated with the control plan using the Data Entry By Control Plan page.
Click the New Session button on the Data Entry By Control Plan page.
Enter data associated with the characteristics for the control plan on the Subgroup Method - Data Entry page or the Sample Method - Data Entry page.
The system invokes the appropriate data-entry page depending on the data-entry method that you defined for the control plan.
While entering data you can:
Complete the data-entry readings for one or more characteristics on the control plan.
View the instructions for the complete control plan on the Instructions page.
View the current results for a sampling on the Review page.
Submit the readings for analysis.
Review and diagnose the alarms that the system generated.
If the system generates alarms, you can:
View the alarm notifications for each characteristic.
Enter the causes for the alarms on the Probable Causes page.
Enter the corrective actions taken to correct the alarm condition on the Corrective Actions page.
(Optional) Enter causes for potential problems and corrective actions on the Probable Causes and Corrective Actions pages even if the system does not generate alarms.
View the results in a graphic.
The working control chart that you assigned to the characteristic appears on the Graph Display page.
Pending Session Recall
This graphic illustrates the process flow when recalling a pending data-entry session for completion. For the pending session that needs to be completed, choose to access the control plan using the access list mode or the hierarch fields mode. Select the data entry method of subgroup method or sample method and then complete the session. Next, the Quality system analyzes the data to generate any alarms, and display the results in graphic form:
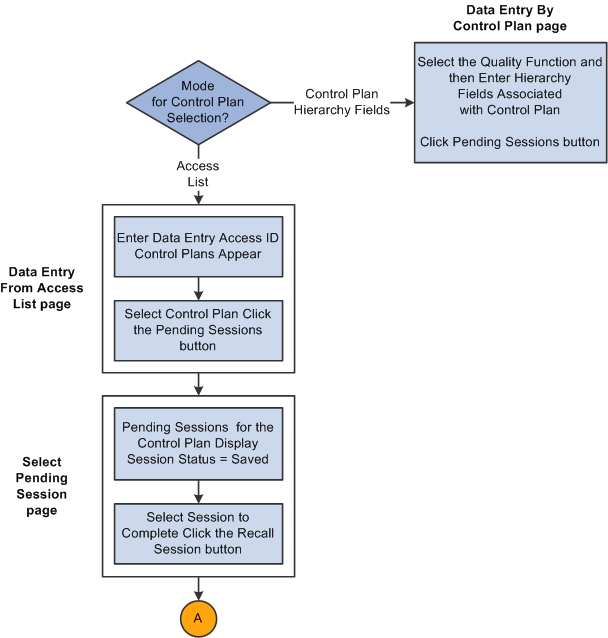
Recalling a pending session business process flow (1 of 2)
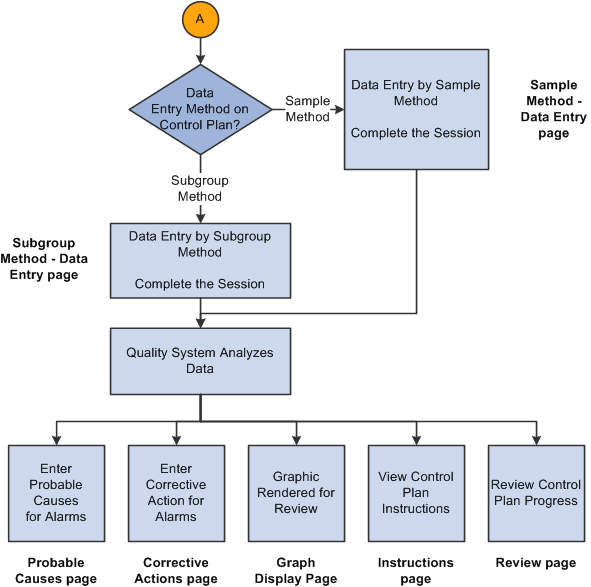
Recalling a pending session business process flow (2 of 2)
To recall a pending session:
Determine whether you have pending sessions that need to be completed and how you want to access the control plans.
If you choose the access list mode, perform the steps in the "To choose the access list mode" procedure.
If you choose the hierarchy field mode, perform the steps in the "To choose the hierarchy field mode" procedure.
To choose the access list mode:
Enter the data entry access list ID and select the control plan with which you want to work on the Data Entry From Access List page.
Click the Pending Sessions button on the Data Entry From Access List page.
Select the pending session that you want to complete, by clicking the Recall Session button on the Select Pending Session page.
Enter data associated with the characteristics for the control plan on the Subgroup Method - Data Entry page or the Sample Method - Data Entry page.
The appropriate data-entry page appears depending on the data-entry method that you defined for the control plan.
As you enter data for a session, you can:
Complete the data-entry readings for the incomplete characteristics.
View the instructions for the entire control plan on the Instructions page.
View the current results for a sampling on the Review page.
Submit the readings for analysis.
Review and diagnose the alarms that the system generated.
If the system generates alarms, you can:
View the alarm notifications for each characteristic.
Enter the causes for the alarms on the Probable Causes page.
Enter the corrective actions taken to correct the alarm condition on the Corrective Actions page.
(Optional) Enter causes for potential problems and corrective actions on the Probable Causes and Corrective Actions pages even if the system does not generate alarms.
View the results in a graphic.
The working control chart that you assigned to the characteristic appears on the Graph Display page.
To choose the hierarchy field mode:
Select the quality function and then enter the hierarchy fields associated with the control plan, using the Data Entry by Control Plan page.
Click the Pending Sessions button on the Data Entry by Control Plan page.
Select the pending session that you want to complete, by clicking the Recall Session button on the Select Pending Session page.
Enter data associated with the characteristics for the control plan on either the Subgroup Method - Data Entry page or the Sample Method - Data Entry page.
The system invokes the appropriate data-entry page depending on the data-entry method that you defined for the control plan. While you enter data for a session you can:
Complete the data-entry readings for the incomplete characteristics.
View the instructions for the entire control plan on the Instructions page.
View the current results for a sampling on the Review page.
Submit the readings for analysis.
Review and diagnose the alarms that the system generated.
If the system generates alarms, you can:
View the alarm notifications for each characteristic.
Enter the causes for the alarms on the Probable Causes page.
Enter the corrective actions taken to correct the alarm condition on the Corrective Actions page.
(Optional) Enter causes for potential problems and corrective actions on the Probable Causes and Corrective Actions pages even if the system does not generate alarms.
View the results as a graphic.
The working control chart that you assigned to the characteristic appears on the Graph Display page.
Completed Session Edits
This graphic illustrates the process flow for editing a completed session. The steps are explained below the graphic:
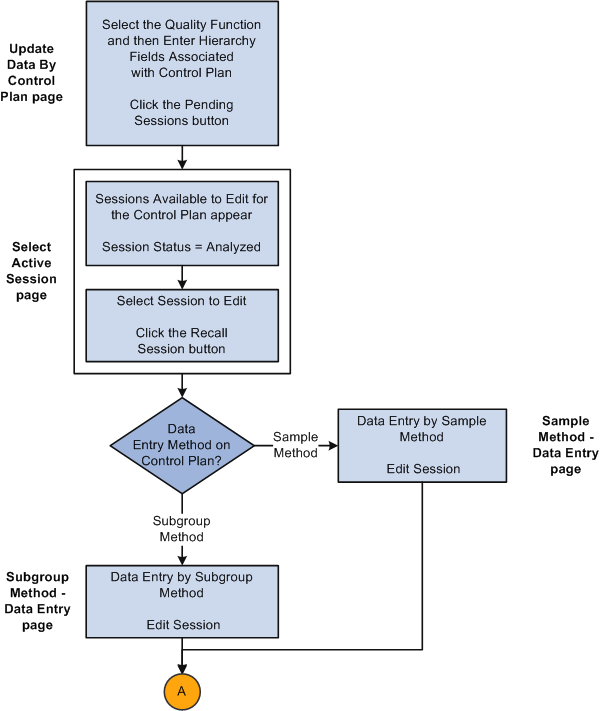
Editing a completed session business process flow (1 of 2)
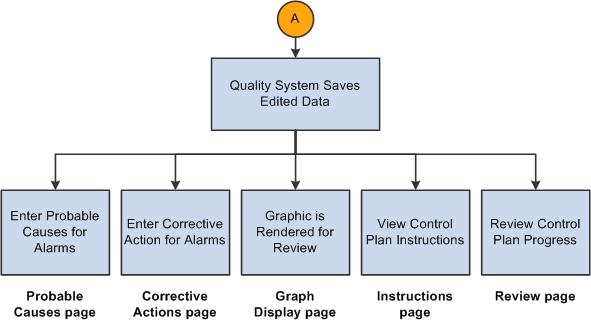
Editing a completed session business process flow (2 of 2)
To edit data on a session that is completed:
Determine whether you have sessions that need to be edited, such as data that was entered incorrectly for the session.
Enter the hierarchy fields associated with the control plan on the Update Data By Control Plan page and click the Pending Sessions button.
Select the completed session that you want to edit, by clicking the Recall Session button on the Select Active Session page.
Edit data associated with the characteristics that are completed for the session by using the Subgroup Method - Data Entry page or the Sample Method - Data Entry page.
The system invokes the appropriate data-entry page depending on the data-entry method that you defined for the control plan. While editing data, you can:
Edit the data-entry readings for completed characteristics.
View the instructions for the complete control plan on the Instructions page.
View the results for a sampling on the Review page.
Save the edited readings.
After you edit and save readings, the system does not generate new or cancel existing alarms; however, it does check acceptance limits (if defined). Plus, the system selects and displays the Subgroup Was Edited check box for each edited characteristic subgroup.
View the results as a graphic.
The working chart appears on the Graph Display page.
Common Elements Used in This Chapter
|
Data Entry Access ID |
A user-specified ID providing access to a list of predefined and often used control plans. |
|
Session |
Denotes a data-entry instance. A session encapsulates all characteristics, readings, alarms, and actions that you enter for specific inspection samplings. The system automatically generates the unique session ID. |
|
Pending Session |
The session has been saved, but not all sample values have been entered or analyzed. |
|
Completed Session |
All sample values have been entered and each characteristic has been analyzed. |
|
Date Created |
Displays the date and time that the session was created. |
|
Data Entry Name |
A name given to a series of control plans to be run together. The number in parentheses next to the name displays the number of control plans associated with the data entry name. For example, Assembly_1 (3) means that you have three control plans associated with the date entry name of Assembly_1. |
|
New Session |
Click this button to create a new session using the subgroup or sample method depending on the data-entry method associated with the control plan. From there, you can enter readings for the characteristics. |
|
Pending Sessions |
Click this button to view the sessions that are pending or the sessions that are completed. When you click this button the Select Pending Session or Select Active Session pages appear. |
|
|
Click the Next button to scroll to the next quality object. |
|
|
Click the Previous button to scroll to the previous quality object. |
|
Add To List |
After you select an attribute, click the Add To List button to populate the list for a Quality page. |
|
|
Click the Enter Defects button to record defects observed for defects or defectives data types. |
|
Calculate |
Click this button to calculate and populate the Reading fields associated with a derived characteristic. This button is active only for derived-type characteristics. For example, suppose that you define three characteristics, such as length, width, and area and you define the area to equal the length times the width. If you have already entered readings for the length and width characteristics, click the Calculate button to generate readings for the area characteristic. The system calculates and automatically enters the derived readings on the page. |
|
|
Click the Next Control Plan in Sequence button to access the next control plan in sequence associated with the data entry name. |
|
Complete |
Click this button to populate the remaining reading fields with the average of the readings already entered for the characteristic. You can use this button after you enter at least one reading. In addition, you must have selected to average the data for an incomplete subgroup associated with a characteristic from the Measurement Plan page. |
|
Repeat Sampling |
Click this button to display the Data Entry page and create a new data-entry session. Use this feature to continue entering sample information without traversing the menu system. This button becomes active when you complete and save at least one characteristic for a control plan. The button is not active when editing a completed session. |
|
|
Click the View Chart button to display the current working chart for the characteristic that you selected. The data appears with the graph preference that is associated with the control plan characteristic. |
|
|
Click the Enter Probable Cause button to access the Probable Causes page and enter probable causes for alarms. |
|
|
Click the Enter Corrective Action button to access the Corrective Actions page and log any corrective actions taken. |
|
|
This button indicates an alarm associated with a subgroup of a characteristic. This button appears on various data entry, data analysis, and alarm review pages. |
Defining Data-Entry Access Lists
To define data-entry access lists, use the Define Operator Access Lists component (QS_DE_ACCLIST8). This section discusses how to:
Maintain access lists.
Assign control plans to access lists.
Pages Used to Define Data-Entry Access Lists|
Page Name |
Definition Name |
Navigation |
Usage |
|
QS_DE_ACCLIST |
Quality, Prepare Data Collection, Define Operator Access Lists |
Define an access list. You create access lists and assign control plans to them. The lists present a concise list of frequently performed data-entry tasks to an operator. Multiple operators can use the same lists. The creation of an access list advances the security and flexibility in which administrators can assign specific data-entry obligations to operators. |
|
|
QS_DS_ACCLIST2 |
Click the Control Plan Selections link on the Define Operator Access List page. |
Display all control plans associated with a quality function and select the plans that you want to associate with the access list. |
Maintaining Access Lists
Access the Define Operator Access List page (Quality, Prepare Data Collection, Define Operator Access Lists).
|
Control Plan Selections |
Click this link to select control plans to associate with the access list. |
|
Inactive |
Select this check box if you do not want the system to display this control plan during data entry. |
|
Default |
Select this check box to launch this control plan automatically when performing data entry using an access list. |
Assigning Control Plans to Access Lists
Access the Control Plan Selections page (Click the Control Plan Selections link on the Define Operator Access List page).
Select the Select check box next to each data entry name (control plan) that you want to assign to the access list. Control plans can be assigned to any number of access lists.
Note. Only control plans with a data entry name appears.
See Also
Entering, Maintaining, and Editing Quality
Data
This section provides an overview of how to create a new sampling and discusses how to:
Select control plans from access lists.
Select control plans using hierarchy fields.
Recall pending sessions from access lists.
Recall sessions using hierarchy fields.
Use session list pages.
Understanding the Creation of a New Sampling
To create a new sampling:
Select the control plan that you are working on from either the access list or by entering hierarchy fields associated with the control plan.
You can enter the readings for an inspection sampling for each characteristic through the Data Entry From Access List or Data Entry By Control Plan pages.
Enter inspection readings for the various characteristics associated with a control plan.
If you do not complete the plan, you can save the session and recall it at a later time for updates.
Submit the data for analysis to assess control and view the current working chart for each characteristic.
Enter probable causes for alarms or log corrective actions for any characteristic.
Review the control plan and current sample results.
View instructions on how to perform the inspection readings for all characteristics.
Pages Used to Enter, Maintain, and Edit
Quality Data|
Page Name |
Definition Name |
Navigation |
Usage |
|
QS_DE_ACLEXEC |
Quality, Enter Sampling Information, From Access List, Data Entry From Access List |
|
|
|
QS_STRMROOT_SEL |
Quality, Enter Sampling Information, By Control Plan, Data Entry By Control Plan |
|
|
|
QS_STRMROOT_SEL |
Quality, Enter Sampling Information, Update Completed Sessions, Update Data By Control Plan |
Recall completed sessions using hierarchy fields. |
|
|
QS_SESSN_SEL |
Click the Pending Sessions button on the Data Entry From Access List page or the Data Entry By Control Plan page. |
Select the pending session that you want to complete. |
|
|
QS_SESSN_SEL |
Click the Pending Sessions button on the Update Data By Control Plan page. |
Select the completed session that you want to edit. |
Selecting Control Plans from Access Lists
Access the Data Entry From Access List page (Quality, Enter Sampling Information, From Access List, Data Entry From Access List).
Select a control plan from an access list. This page simplifies the selection of repetitive control plans by inspection personnel.
Note. For security, the Access ID field does not provide a prompt list.
|
Launch Default Data Entry |
Click this link to launch the control plan that you specified as the default for this access ID. |
See Also
Using Subgroup and Sample Methods to Enter Data
Selecting Control Plans Using Hierarchy
Fields
Access the Data Entry By Control Plan page (Quality, Enter Sampling Information, By Control Plan, Data Entry By Control Plan).
Enter the hierarchy fields associated with the plan. The fields that appear vary depending on the quality function. In the lower portion of the page, the hierarchy fields associated with the specific quality function appear.
Recalling Pending Sessions From Access Lists
To recall a pending session from an access list:
Access the Data Entry From Access List page.
Note. You can recall pending or incomplete sessions by using
either the Data Entry From Access List or Data Entry By Control Plan pages.
You can recall completed sessions for editing only by using the Update
By Control Plan page.
Click the Pending Sessions button next to a control plan to access the Select Pending Session page.
Select the pending session to complete.
See Also
Selecting Control Plans from Access Lists
Recalling Sessions Using Hierarchy Fields
To maintain or complete a pending session:
Access the Data Entry By Control Plan page.
Enter the appropriate hierarchy fields for the target control plan.
Click the Pending Sessions button to access the Select Pending Session page.
Select the specific session that you want to complete from the list.
To edit a completed session:
Access the Update Data By Control Plan page.
Enter the appropriate hierarchy fields for the target control plan.
Click the Pending Sessions button to access the Select Active Session page.
Select the specific session that you want to edit from the list.
See Also
Selecting Control Plans Using Hierarchy Fields
Using Session List Pages
Access the Select Pending Session page (Click the Pending Sessions button on the Data Entry From Access List page or the Data Entry By Control Plan page) or the Select Active Session page (Click the Pending Sessions button on the Update Data By Control Plan page).
Depending on the mode of entry to these pages, the system displays either a list of pending sessions to be completed or a list of completed sessions available to edit. Sessions are listed in descending order of creation date. In addition, the hierarchy fields associated with the quality function and control plan appear.
|
Session |
Displays the pending or completed sessions. |
|
Status |
Displays the state of the session. Values include: Saved: Pending sessions that you can maintain. Analyzed: Completed sessions that you can edit. |
The listed sessions are limited by the data persistence settings, the session data life days, and the edit data limit days that you defined for the quality function. This table lists the criteria that affects sessions:
|
Sessions |
Session Status |
Data Criteria |
|
Pending |
Saved |
Current Date - Session Data Life Days |
|
Completed |
Analyzed |
Current Date - Edit Data Limit Days |
For example, suppose that you want to edit data for a completed session. The date is March 30, 2003, and the edit data limit days for the quality function is set to 20 days. The list of sessions that appear on this page are those sessions that you created between March 10, 2003 and March 30, 2003, with a session status of Analyzed.
See Also
Entering, Maintaining, and Editing Quality Data
Using Subgroup and Sample Methods to Enter
Data
This section provides an overview of subgroup and sample methods and discusses how to:
Use the subgroup method.
Use the sample method.
Record defects.
Understanding Subgroup and Sample Methods
You enter, maintain, and edit quality data for characteristics by using either the subgroup or sample method. Use the subgroup method to enter readings for an entire subgroup at once. Use the sample method to enter individual readings for each characteristic on one unit.
The method that you select for data collection depends on the way that you physically measure and record readings for characteristics with which you are working. While the pages are functionally equivalent, each page is optimized to enhance field navigation and input based on the type of item handling or inspection taking place.
To use the subgroup method:
Enter readings for one characteristic on as many units as it takes to meet the subgroup size for the characteristic.
Enter readings for the next characteristic until its subgroup size is met, and so on, until you inspect all of the characteristics for the control plan.
To use the sample method:
Enter data readings for each characteristic on one unit.
Enter readings for each characteristic on another unit, and so on, until you have inspected enough units to meet the subgroup size that you defined.
Pages Used to Maintain Quality Data Using
Subgroup and Sample Methods|
Page Name |
Definition Name |
Navigation |
Usage |
|
QS_DE_GUI_S |
|
Enter readings for the inspection sampling for each characteristic subgroup according to subgroup. |
|
|
QS_DE_GUI_I |
|
Enter readings for the characteristic by individual units, one by one. |
|
|
QS_DFCT8B_PNL |
|
Record defect information associated with a sample data type of defects or defectives. |
Using the Subgroup Method
Access the Data Entry (Subgroup Method) page (Click the New Session button on the Data Entry page From Access List or Data Entry By Control Plan pages).
The Subgroup Method pages function basically the same, whether you are entering data for a new session, maintaining data for a pending session, or editing data for a completed session. The differences in the page behavior depend on the type of task that you are performing.
To enter data for a new session:
Enter data for all the characteristics for the control plan, including any defect classifications and tallies.
Enter causes and actions for the alarms after the characteristics have been analyzed.
Review the working chart for any characteristics.
To maintain data for a pending session:
Complete the readings for any unfinished characteristics or samples for the session.
The previously completed (analyzed) characteristics appear but cannot be changed.
Enter causes and alarms.
Review the working chart for any characteristic.
Note. A characteristic is considered complete after its sampling criteria has been fulfilled and analyzed. That is, subgroup results are calculated and alarm conditions evaluated. A data-entry session is considered complete after all the characteristics within the control plan have been analyzed.
To edit a completed session:
Make corrections to the data that you entered for that session.
Change trace fields, sample values, or defect information associated with the historical session.
Change or augment any of the probable causes and corrective actions.
Click the Apply button to resubmit the new readings.
Quality calculates and saves the results; however, it does not evaluate or generate new alarms.
Any prior alarm conditions remain in the database. Subgroups that are edited in this way are stamped in the database and annotated when they appear on control charts.
Characteristic
The system displays the number of characteristics associated with the control plan, such as 1 of 3 or 2 of 3.
The system uses the Control Plan field to display the number of control plans associated with a particular data entry name. For example, 1 of 1 means there is only 1 control plan associated with this data entry name.
User Input
Enter the row of data associated with the sample. The column titles that appear on the page correspond to the trace set fields associated with the control plan. If you previously defined the subgroup size, an equivalent number of detailed rows appear on the page. If you didn't define the subgroup size, which is possible for attributes-type characteristics using u, p, and np charts, enter the Sgrp size (subgroup size) on the page.
Enter the reading information for the different types of characteristics. Values are:
|
Value |
Description |
|
Variable |
For variable data types, enter the value in the Reading field. The Enter Defects button does not appear for variable data-type characteristics. |
|
Defect |
For defect data type characteristics, select the actual defects and the number observed using the Enter Defects page. The attribute group associated with the control plan defines the defect selection lists. When you close the Enter Defects page, the defect tally is automatically placed in the Reading field. You can also enter the defect tally directly in the Reading field without accessing the Enter Defects page. What you enter on the Enter Defects page overrides what you enter directly in the Reading field on this page. |
|
Defective |
For defective data types, enter the observations in #Defectives. You also have the option of selecting any defect observations and counts on the Enter Defects page. |
See Recording Defects.
Characteristic - Other Information
As you submit samplings for analysis, Quality evaluates the process for control violations and displays any detected alarms. Up to three alarm conditions, one for mean, variance, and specification limit violations may appear in the center of the page. In addition, the appropriate control-chart labeling and associated subgroup calculations appear on the page.
Using the Sample Method
The Sample Method pages function basically the same, whether you are entering data for a new session, maintaining data for a pending session, or editing data for a completed session. The differences in the page behavior depend on the type of task that you are performing.
Note. A subgroup is considered complete after its sampling criteria is fulfilled and analyzed. That is, subgroup results are calculated and alarm conditions evaluated. A data-entry session is considered complete after all the characteristics within the control plan have been analyzed.
Control Plan Information
The system uses the Control Plan field to display the number of control plans associated with a particular data entry name. For example, 1 of 1 means there is only 1 control plan associated with this data entry name.
Traceability
Enter the traceability data associated with the sample.
The titles of the columns that appear on the page correspond to the trace set fields associated with the control plan. Depending on the definition of the trace set, there may be one or more fields that you can enter.
Sample Values
If you previously defined the subgroup size, an equivalent number of detailed rows appear on the page. If you didn't previously define the subgroup size, which is possible for attributes-type characteristics using u, p, and np charts, you can enter the Sgrp Size (subgroup size) on the page.
Enter the reading information for the different types of characteristics.
Note. The heading for the Reading field changes to represent the sample you are currently on. For example, Reading 1 lets you know you are entering data in the Reading field for the first sample.
Other Information
As you submit samplings for analysis, Quality evaluates the process for control violations and displays detected alarms. Up to three alarm conditions, one for means, variance, and specification limit violations may appear in the center of the page. In addition, the appropriate control-chart labeling and associated subgroup calculations appear on the page.
See Also
Recording Defects
Access the Enter Defects page (Click the Enter Defects button found on multiple pages).
To enter a complete defect description:
Select each defect component required for a complete defect description using the defect category group boxes.
Select the Select One check box next to the correct component.
Note. The attribute group assigned to this control plan defines the list of entries that appear in the category group boxes.
Click the Add To List button.
After you click this button, use the List group box (Location, Fault and With) to view the predefined defect category selections applicable to this control plan. Select from each component to build a completed defect description corresponding to actual observations.
Enter the number of defects of this type observed in the Count field.
Note. A defect count of zero is not valid.
To change a defect description:
Select the List check box next to the defect description that you want to change that appears in the List group box.
Select the correct defect component or components.
Select the Select One check box next to the correct component.
Click the Add To List button.
When you click this button, the system overrides the values for the selected defect descriptions with the new values.
See Also
Working With Control Plans
This section discusses how to:
View instructions.
Review current session results.
Display graphs.
Record probable causes.
Record corrective actions.
Pages Used to Work With Control Plans|
Page Name |
Definition Name |
Navigation |
Usage |
|
QS_DE_INSTRUCTIONS |
|
Review instructions associated with the control plan while you enter data. |
|
|
QS_DE_REVIEW8 |
|
Review results and alarms for each characteristic on the control plan. |
|
|
QS_CLCHART_RVW |
|
View the current working chart for a characteristic. |
|
|
QS_CAUSE8B_PNL |
Click the Enter Probable Cause button on the Review page. |
Record probable causes for alarms associated with the characteristic. |
|
|
QS_ACTION8B_PNL |
Click the Enter Corrective Action button on the Review page. |
Record actions taken in response to an alarm condition or to log comments against the process. |
Viewing Instructions
Access the Instructions page (Click the New Session or Pending Session buttons on the Data Entry From Access List page).
This page displays the instructions defined for the measurement plan. The instructions are the same, whether you are using a subgroup or sample method. In the upper-right portion of the page, a text box displays the hierarchy fields associated with the control plan.
Reviewing Current Session Results
Access the Review page (Click the New Session or Pending Session buttons on the Data Entry From Access List page).
Control plans usually contain more then one characteristic. As you enter readings for a plan, you can review what has been analyzed. This page displays information and current subgroup results for each characteristic and is the same, whether you enter data for a new session, maintain a pending session, or edit a completed session.
In the upper-right portion of the page, a text box displays the hierarchy fields associated with the control plan. Each control plan characteristic appears in the Characteristic column.
|
LSL (lower specification limit) and USL (upper specification limit) |
Displays the lower and upper specification limits for the characteristic. |
|
Subgroup Size |
Displays the subgroup size. |
|
Result 1 and Result 2 |
Displays the subgroup results, based on the associated control chart calculated from the readings. |
|
General Alarm, Chart 1 Alarm, and Chart 2 Alarm |
Displays alarm conditions for the characteristic. |
See Also
Displaying Graphs
Access the Graph Display page (Click the View Chart button on the Review page).
The graph defined by the graph preference that is associated with the characteristics on the measurement plan appears. The graph is based upon the current N-point history for the process and may be a control chart, histogram, Pareto chart, or bar graph. In this mode, Quality generates the graph using the PeopleSoft Internet Architecture application server.
See Using PeopleSoft Quality Graphics.
See Also
Using the PeopleSoft Quality Application Client
Recording Probable Causes
Access the Probable Causes page (Click the Enter Probable Cause button on the Review page).
Use this page to enter probable causes for an alarm or process behavior. You can post probable causes and corrective actions against any subgroup that has been analyzed, whether or not alarms have been detected.
To enter a probable cause definition:
Select each probable cause component required for a complete probable cause definition using the category group boxes.
Select the Select One check box next to the correct component.
Note. The attribute group assigned to this control plan defines the list of entries and actual labels that appear in the category group boxes.
Click the Add Probable Cause to List button.
After you click this button, use the List group box (Problem and Affecting) to view the predefined probable cause category selections applicable to this control plan. Select from each component to build a completed probable cause definition corresponding to actual observations.
To change a probable cause definition:
Select the List check box next to the probable cause definition that you want to change that appears in the List group box.
Select the correct probable cause component or components.
Select the Select One check box next to the correct component.
Click the Add Probable Cause to List button.
When you click this button the system overrides the values for the selected probable cause definition with the new values.
See Also
Recording Corrective Actions
Access the Corrective Actions page (Click the Enter Corrective Action button on the Review page).
Use this page to enter corrective actions for an alarm or process behavior. You can post probable causes and corrective actions against subgroups that have been analyzed, whether or not alarms have been detected.
To enter a corrective action definition:
Select the action component required for a corrective action definition using the Category group box.
Select the Select One check box next to the correct component.
Note. The attribute group assigned to this control plan defines the list of entries and actual labels that appear in the category group box.
Click the Add Corrective Action to List button.
After you click this button, use the List group box (Action) to view the predefined corrective action category selections applicable to this control plan. Select the component to build a completed corrective action definition corresponding to actual observations.
To change a corrective action definition:
Select the List check box next to the corrective action definition that you want to change that appears in the List group box.
Select the correct corrective action component.
Click the Select One check box next to the correct component.
Click the Add Corrective Action to List button.
When you click this button, the system value overrides the value for the selected corrective action definition with the new value.
See Also