 Understanding the Market Compensation Module
This chapter provides an overview of the Market Compensation module and discusses how to:
Create market compensation scenarios.
Analyze scenarios.
Approve compensation target rates.
Compare current pay structures with new target rates.
Understanding the Market Compensation Module
This section discusses:
The Market Compensation module.
The Market Compensation business process.
Base currencies.
Trees.
The Compensation Survey Data Crystal report.
 The Market Compensation Module
Managing market compensation means analyzing your organization's compensation strategy, by job and pay structure. You collect market compensation data from external survey sources, to compare the data against your organization's existing pay structures and compensation strategy. This requires an understanding of what your organization's compensation strategy is for these jobs. For example, does your organization want to meet the 50th percentile market rate for the regular base compensation for a job and use aggressive incentives to allow workers to exceed the 50th percentile for total cash compensation? Or does your organization want to match the 50th percentile market rate for cash compensation for jobs requiring essential technological and managerial skills, and then meet the 40th percentile market rate for the remainder of the jobs? Gain a clear understanding of these issues and identify your organization's compensation strategies.
The process of defining market compensation rates involves:
Matching your organization's jobs to similar benchmark jobs that appear in published compensation surveys.
Developing market rates for the jobs.
Comparing your organization's compensation rates to the market rates.
Determining target market rates for your pay programs.
Jobs that are common across industries (or within an industry) and that appear in published survey sources are benchmark jobs (or benchmarks). They provide a basis for comparison against similar jobs in your organization. Jobs in your organization for which there are no corresponding benchmarks are termed non-benchmark jobs.
Market rates are the best estimate of the external market value of a job, that is, the prevailing compensation rate for the job in the labor market. The market compensation process typically involves these steps:
Import relevant survey data into the system.
Transform the survey data to meet your predefined dimensions and requirements.
Transform the survey data to update data from multiple sources to a common date, or age old data to the present date.
Calculate market rates for each benchmark job based on a weighted average from selected survey samples.
Conduct analyses to compare current organization pay programs and actual pay levels to the market.
The Market Compensation Business ProcessThis diagram shows the main steps in the Market Compensation business process:
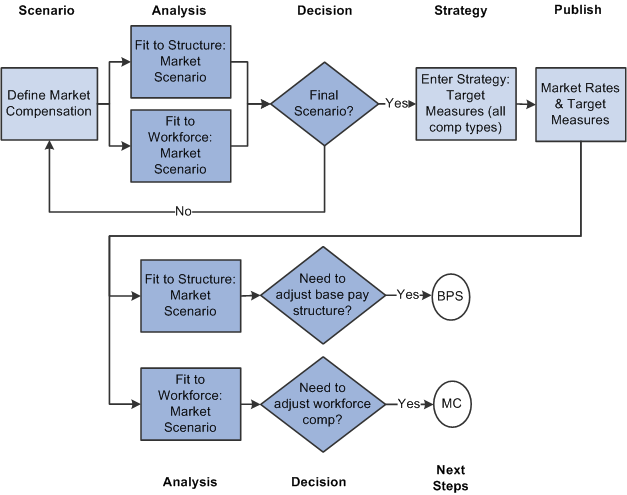
Market Compensation business process
Base Currencies
PeopleSoft EPM applications require that there can be only one business unit per scenario, and that every business unit can have only one base currency code. Therefore, every scenario can have only one base currency code.
You must import external compensation survey data that is in the same base currency as that for the business unit that you are using in your scenario.
See Also
Setting Up Currency Rules for EPM
Trees
In Workforce Rewards, you use trees to provide structure to all of the main dimensions (department, geography, compensation code, job code, financial size, unit size, and industry type). You can have multiple versions of these trees in your system, with different names.
In the Market Compensation module, use the trees specified on the Mapping Tree Names page. When you specify a tree on this page, the tree mapping value must remain constant. The value must remain unchanged, from the start of your external survey data import, until you are finished using the survey data to generate a market compensation scenario.
See Also
The Compensation Survey Data Crystal Report
Use the Compensation Survey Data Crystal report (WAC0020) to understand and analyze the external compensation survey data that you imported into Workforce Rewards. Then prepare a strategy for how to use this in data in the Market Compensation module. To run the report, select EPM Foundation, Business Metadata, OW-E Dimension Maintenance, HRMS, Workforce Survey Setup Reports, Compensation Survey Data.
See Also
Generating External Survey Data Reports
Creating Market Compensation Scenarios
To create market compensation scenarios use the WA_CM_MODEL_TBL.GBL, WA_WEIGHT_DFN.GBL, and WA_SCENARIO_DFN.GBL components.
This section provides an overview of market compensation scenarios, and discusses how to:
Calculate regressions.
View regression statistics.
Define market models.
Define market weighting rules.
View market survey samples.
Set up market scenarios.
Run the Market-Based Pricing Application Engine process (WA_MBP).
Review the Market-Based Pricing process.
Review market compensation scenario data.
Understanding Market Compensation Scenarios
Create scenarios with the Market Compensation module to assess your organization's compensation gap to market, that is, to compare your organization's current compensation rates to an estimate of the prevailing market rates. To create a scenario:
Regress the survey values for certain executive and some mid management level jobs, based on your organization's dimensions and business needs.
Define a model ID, including aging rules.
Select survey samples and apply weighting rules.
Create a scenario ID.
Run the Market-Based Pricing process.
To summarize, define a market compensation model as a set of benchmark job codes, along with their weighting and aging rules. Then reference the model to define a market compensation scenario.
Regression is a statistical technique that determines the relationship between two or more variables. Regression predicts the value of one variable (the dependent variable) based upon one or more independent variables.
Run regression calculations in the Market Compensation module to adjust market rates for certain jobs from those delivered with the survey. For example, the market rates delivered in a particular compensation survey may come from a set of companies whose business circumstances are substantially different from your organization's circumstances. The survey data might be from companies that are much larger or smaller than yours, based upon their total revenue or the number of employees.
Perform regression on the salary data for executive level jobs, where the pay levels are strongly dependent on the size of the organization. The Market Compensation module uses the financial size and unit size dimensions to gauge relative organization size. This helps you run regressions for executive pay data from surveys where the companies surveyed are much larger or smaller than your organization, based on one of these dimensions, and where regression statistics are provided by that survey.
For each survey with data requiring regression, specify dimension values (financial size or unit size) to regress the compensation survey data for each benchmark job. The system calculates and stores the regressions for the predicted market rates, with a dimension value of Regressed. Market Compensation calculates single regression equations, in either natural logarithms or common logarithms. Choose according to your business requirements.
When you create a model in the Market Compensation module, one of the model parameters that you specify is an aging factor. The aging factor is an annualized percentage, used by the system to age the survey data by updating it to a common date. The aging factor is usually based on the expected movement of pay in the market (for example, 4 percent) based on surveys that report merit budgets for the coming year. The aging calculation is a daily calculation and it works as follows:
(Market Rate Measure Value x Aging Factor) / 360 = (Daily Adjustment Amount) .
(Daily Adjustment Amount x Number of Days to Age) + (Market Rate Measure Value) = (Aged Market Rate Measure Value) .
For example, assume that:
A compensation survey is effective-dated March 1, 2000.
The market rate measure value for a job in the survey is 50,000 USD.
We choose to apply an annualized aging factor of 4 percent (based on the expected movement of pay in the market).
We choose to age the survey data to January 1, 2001, a period of 10 months (or 300 days).
The calculation is:
(50,000 USD x .04) / 360 days = 5.5 USD per day .
(5.5 USD per day x 300 days) + 50,000 USD = 51,650 USD, which is the new aged market rate measure value.
Survey Selection and Weighting Rules
Market compensation surveys provide data about prevailing compensation rates for jobs. Use this data to calculate market rates for comparison against your organization's current pay structures, or against a pay strategy. Different compensation surveys have differing importance or credibility based upon how closely they reflect the business circumstances for your organization (industry type, financial size, and so on).
On the Market Weighting Rules page, you select the compensation survey data from the data warehouse tables that best fits your analysis. This way, you direct the system to process only the market compensation data that you consider to be most relevant. Assign relative weights to the data, if you think that one set of data is more, or less, important than another.
Workforce Rewards uses the compensation survey data and weightings when calculating market rates for a scenario.
Pages Used to Create and Run Market Compensation Scenarios
|
Page Name |
Definition Name |
Navigation |
Usage |
|
WA_REGRESS_TBL |
Workforce Analytics, Market Compensation, Setup, Salary Regression Calculator |
Calculate regressions. Specify dimension criteria about your organization's size, relative to the size of companies in the survey. The system uses this information to calculate and store regressed survey values for predicted market rates. |
|
|
WA_REGR_INFO_SPNL |
Click the View Statistics link on the Salary Regression Calculator page |
View regression statistics for the selected job code and survey instance. |
|
|
WA_CM_MODEL_TBL |
Workforce Analytics, Market Compensation, Setup, Setup Market Model, Market Model |
Define market compensation models and view job codes in the model. |
|
|
WA_WEIGHT_DFN |
Workforce Analytics, Market Compensation, Setup, Setup Weighting Rules, Market Weighting Rule |
Define market weighting rules. Select the compensation survey data to include in the model, screen the survey data, and apply a weight to the data. |
|
|
WA_SAMPLE_SPNL |
Click the Information button on the Market Weighting Rule page. |
View market survey samples. |
|
|
WA_SCENARIO_DFN1 |
Workforce Analytics, Market Compensation, Setup, Setup Market Scenario, Market Scenario |
Set up market compensation scenarios by specifying the models that make up the scenarios. |
|
|
RUN_PF_JOBSTREAM |
Workforce Analytics, Market Compensation, Process, Run Market Scenario, Run Market Scenario |
Run market–based pricing application engine process. |
Calculating RegressionsAccess the Salary Regression Calculator page (Workforce Analytics, Market Compensation, Setup, Salary Regression Calculator).
|
Job Code Set |
Select the node of the JOBCODE tree to which you want to map the survey job code. Values are from the WA_JOBCDSET_D00 table. |
|
Geography, Industry, Financial CD (financial code), Unit CD (unit code) |
Select survey dimensions. The selection criteria tells the system which survey samples to pull the regression statistics from, and then uses these dimension values as keys for the new regressed survey sample rows of data. Select from the prompt list values, which are from the GEOGRAPHY_D00, WA_INDUSTRY_D00, WA_FINCODE_D00, and WA_UNITCODE_D00 tables, respectively. |
|
Variable Type |
Select the appropriate variable type for this survey sample regression calculation. Values are: Financial: The regression calculation takes into account your organization's financial size. Unit: The regression calculation takes into account your organization's unit size. |
|
Variable |
Enter your organization's financial or unit size value. The system uses this value when calculating the regression. |
|
Logarithm Type |
Select Natural or Common, depending on the preferences or practices of your organization. |
|
View Statistics |
Click to access the Regression Statistics page, and review statistics provided by the selected survey sample that is involved in running the regression calculation. |
|
Calculate |
Click to trigger system processing. The system regresses the survey data, based on the survey sample, dimension criteria, and variable information that you entered on this page. |
Regressed Values
The system populates the Regressed Values group box with the regressed values for each compensation code and measure ID provided by that survey sample. The system also inserts new rows of data for that survey sample, with regressed measure values, in the WA_SURVALUE_F00 table.
|
Measure ID |
Displays a percentile of the market rate. |
|
Measure Value |
Displays the calculated market rate value for a specified percentile of a market rate. This is the annual, monetary pay level that you compare against the compensation level for similar jobs in your organization. |
Note. When you click the Calculate button, the system writes the rows of data that appear on the page to the WA_SURVALUE_F00 table. However, the system uses the original effective date of the survey instance, not the effective date that you entered on this page. Each time that you modify the information for the survey instance and job code set and run the regression calculation, the system writes over the previous rows of data for the survey instance and job code set.
Viewing Regression StatisticsAccess the Regression Statistics page (Click the View Statistics link on the Salary Regression Calculator page).
View statistics for the regression calculation for this survey sample and benchmark job. Base Compensation and Cash Compensation are the two most common compensation types found in compensation surveys, and these are some of the most common statistics used to evaluate the regressions.
|
Return |
Click to return to the salary regression calculator. |
Defining Market ModelsAccess the Market Model page (Workforce Analytics, Market Compensation, Setup, Setup Market Model, Market Model).
Note. You normally create model IDs on the EPM Foundation, Business Metadata, Business Framework, Models page. The Workforce Rewards Market Model page, however, enables you to create the model ID and further define the model, all on one page. Create your market compensation model IDs using this page only.
If you are adding a model, you have the option of cloning an existing model. To do this, enter a clone model ID and click the Tab button to move through the field. When saving the page, the system clones the specified model along with the associated job codes and weighting rules.
|
Annual Aging Rate |
Enter the annual aging rate or factor. The system uses this percentage to age the survey data included in the model. Specify an aging rate to bring the survey data up to the current date or to make the survey data consistent with the dates of other surveys. |
|
Parent Model ID |
Enables you to link models together, using object-based modeling. This functionality is discussed in the EPM Foundation documentation. |
|
Notes |
Enter notes as appropriate. |
|
Job Codes |
Displays job codes and descriptions. If you cloned a previous model as well as the associated job codes and weighting rules for the model, then the system displays the job codes here. If you created a model without cloning the rules from another model, then the system displays no data rows. To view the job data associated with this model, save and close the Market Model page, complete the Weighting Rules page for this new model, and then access the Weighting Rules page again in Update/Display or Correction mode. Access the Market Model page, where you can now view the job data. When you create a market model and assign a parent model, the page does not display the job codes of the parent model. The page displays only the job codes for the current model. To view the job codes from the parent model, access the page for the parent model. |
See Also
Defining Market Weighting RulesAccess the Market Weighting Rule page (Workforce Analytics, Market Compensation, Setup, Setup Weighting Rules, Market Weighting Rule).
Select the compensation survey data that you want to include.
Screen the survey data using dimension criteria.
Assign the survey data a relative weighting.
Note. Any job codes for which you want to establish weighting rules must appear on the Job Code tree. If you try to add a weighting rule, and you receive an error message from the system saying that the job code is not available, you may not have added the job code to your tree.
|
Clone Rule |
This field appears at the top of the page in Add and Correction mode. Use this field to clone your weighting rules for the selected job code from a prior job code. Then modify the weighting rules or use as is. Select a job code from the prompt list values. These values are from a view that joins the JOBCODE_D00 and WA_WEIGHT_DFN tables. The system uses the sample rows of the cloned job code as search criteria for the new job code. If the system returns a valid row for the new job code, then the sample row inherits the set and weight from the cloned job code. |
Selection Criteria
Use the Selection Criteria group box to select survey samples, define screening criteria for the survey samples, and apply weighting factors to the selected survey samples.
|
Survey |
Select a set of survey data to include in your model, to enter the selection criteria manually. The prompt values are from the WA_SURVEY_R00 table. |
|
Geography, Industry, Financial CD (financial code), and Unit CD (unit code) |
Select the dimension values to use to screen the specified set of survey data. The values are from the GEOGRAPHY_VW, WA_INDUSTRY_VW, WA_FINCODE_VW, and WA_UNITCODE_VW tables, respectively. To select regressed survey values from the Regression Calculator, enter Regressed in either the Financial CD or the Unit CD field. |
|
Weight |
Enter a whole number multiplier weight for this set of survey samples. The system uses the weighting to calculate an adjusted market rate for this job code from all of the selected survey samples. Use a weight value of 0 (zero) to exclude a survey sample from the calculation for sizes that are too small or otherwise has data that is not thought to be valid for your organization. |
|
Set |
Enter a set value, which is a counter used to identify each set of search criteria that you enter using this page. It is a logical group of survey sample criteria containing a particular set of dimension values. |
|
Attach |
Click to enable the system to populate the Survey Samples group box with rows of survey data based on your selection criteria. Each time that you click the button, the system returns a new set of survey samples based on your criteria. |
|
Remove |
Click to enable the system to remove the data that appears in the Survey Samples group box, based on your selection criteria. |
Survey Samples
For each survey sample returned, the system displays the set number, or counter, for the survey sample screening criteria, and the weight that you applied to the survey sample. You can override this value for a particular row. The Survey, Job Code Set, Geography, Industry, Financial CD (financial code), and Unit CD (unit code) fields display the selection criteria that you entered in the Search Criteria group box. The data is taken from the WA_WEIGHT_SEQ table.
|
|
Click the Survey Sample Information button to access the Market Survey Samples page and view details of the survey sample. |
Add, remove, and modify data in the grid as needed, to define the survey data that you want to use for this model ID and job code. Click the Attach to List button to add more survey samples. Click the Remove From List button to remove the rows from the grid and start over. Or remove one row at a time.
The system uses these survey samples and associated weightings to perform market rate calculations, when you run the Market-Based Pricing process. Here is a summary of the weighting calculation that occurs:
The market rates for each of the survey samples are multiplied by the weights indicated, to provide adjusted market rate values for each sample.
All of the adjusted market rate values are added to make an aggregate value.
All of the weights are added to make an aggregate value.
The aggregate rate value is divided by the aggregate weight value, to yield a single, weighted market rate value for each job code, compensation code, and measure ID.
Viewing Market Survey SamplesAccess the Market Survey Samples page (Click the Information button on the Market Weighting Rule page).
Survey Instance
|
Survey Instance |
In this group box, the page displays the company participant count and employee participant count, which provide you with an idea of the overall size of the survey from which you selected your samples. |
Survey Sample
|
Survey Sample |
In this group box, the system displays selection criteria that you applied to the survey data on the Market Weighting Rules page. |
Market Values
|
Market Values |
In this group box, the system displays the data for the selected survey sample, including each compensation code, measure ID, and associated measure value (market rate). The measure ID is a percentile of the market rate. The measure value is the calculated market rate value for a particular percentile of a market rate, and for a particular scenario and job code. This is the annual, monetary pay level to compare against the compensation level for similar jobs in your organization. For each row, the system also displays the total sample count of companies and sample count of employees, which provide you with an idea of the overall size of the survey samples that you selected from the survey with your screening criteria. Review this information to determine if your sample size is too small to be statistically significant, or whether the survey data is weighted properly. This can help you decide whether you want to use the data on the Market Weighting Rule page, and whether to save the data. |
Setting Up Market ScenariosAccess the Market Scenario page (Workforce Analytics, Market Compensation, Setup, Setup Market Scenario, Market Scenario).
Note. You normally create scenario IDs in the EPM Foundation, Business Metadata, Business Framework, Scenarios page. The Market Scenario page, however, enables you to create the scenario ID from within Workforce Rewards. Market compensation scenarios are always historical.
|
Model ID |
Select the model ID of the model that you want to include in the scenario. The prompt values are from the MODEL_VW table. |
|
Notes |
Enter notes as appropriate. |
Running the Market-Based Pricing Application Engine Process (WA_MBP)
Access the Run Jobstream page to run the Market-Based Pricing process (EPM Foundation, Job Processing, Update/Run Jobstreams, Run Jobstream).
|
As of Dated Jobstream |
Market compensation scenarios are historical scenarios only, as of a single point in time. Select the As of Dated Jobstream check box to enable the system to hide the Fiscal Year and Accounting Period fields and display the As of Date field. Enter an as of date for the scenario. |
|
Jobstream ID |
Select the WA_MBP jobstream ID. Although several jobstream IDs appear in the list of values, this is the jobstream that you want to run from this page for the Market-Based Pricing process. We deliver this metadata for you to use to run the process: Application Engine IDs WA_MBP and PF_MERGE. Job IDs WA_MBP and WA_MBP_MRG. Jobstream ID WA_MBP. |
Warning! Do not run the Market Compensation Scenario jobstream based on a fiscal year and accounting period. Also, do not run a jobstream with a Forecast type scenario from this page. If you do either, the Market Compensation engine will not run successfully.
See Also
Streamlining Processing with Jobstreams
Reviewing the Market-Based Pricing Application Engine Process (WA_MBP)
The WA_MBP jobstream runs the Market-Based Pricing process. This process calculates market rates for the job codes from the survey samples that you selected, using the aging and weighting rules that you defined. A market rate value is calculated for every compensation code and measure. (A measure is a percentile of the market rate.) The system places the new, calculated market rate data in a temporary table called WA_MKT_SCEN_T.
The jobstream then runs the Final Table Merge Application Engine process (PF_MERGE). This process moves the data from the temporary table to the final table, WA_MKT_SCEN_TBL, where the calculated market rates are stored with Scenario ID as a key. WA_MKT_SCEN_TBL is also the source table for the Market Compensation data approval process.
Reviewing Market Compensation Scenario Data
When you run the Market-Based Pricing process, the system also calls the Market Scenario Data Mart process (WA_MC_SCEN), which updates the Workforce Rewards Data Mart. This keeps the data for the Data Mart and the Workforce Rewards tables synchronized. You can also run the Market Scenario Data Mart process alone, to populate the fact tables for previous periods without having to run the WA_MBP process.
This table lists the input tables used to populate the Data Mart fact tables:
|
Reporting Area |
Input Table (D00, R00, and F00) |
Output Table (Fact) |
|
Market Compensation |
WA_MKT_SCEN_TBL, WA_MKT_RATE_TBL , JOB_F00, WA_COMP_HST_F00, JOBCODE_D00, LOCATION_D00, SAL_GRADE_D00 |
WA_MC_SCEN_FACT: Contains all of the data required from the Market-Based Pricing engine, at the job code level. WA_MC_EMPL_FACT: Contains all of the data required from the Market-Based Pricing engine, at the employee level. |
In Market Compensation, the fact table data is accessed by delivered inquiry pages in the Market Compensation Scenario component. You may also select a business intelligence application and develop analysis templates to use with Market Compensation.
See Also
Analyzing Scenarios
This section provides an overview of scenario data analysis and discusses how to:
Run Crystal reports to analyze scenarios.
Review market compensation scenario summary data.
Review market compensation scenario fit to market data.
Review market compensation scenario gap to target data.
Review market compensation scenario market rate detail data.
Understanding Scenario Data AnalysisAfter you've generated a market compensation scenario, check the market compensation rates against your current workforce compensation data. Determine whether the scenario market rates are skewed, or in agreement with what you were expecting to see. To assist with scenario data analysis, we deliver:
Two Crystal reports.
An inquiry component consisting of four pages.
The review and analysis process is iterative. If you find that you don't like the results of the scenario that you just generated, then run additional scenarios with a different set of rules and dimension values. Adjust the scenario until you feel that you have valid market rate data to use as a basis for comparison and strategy. Then decide whether to approve and publish the new market rates. Some examples of the types of questions to consider during this process are:
Does this scenario make sense?
Are these the results that you would expect?
Did you do something wrong in the process, resulting in skewed data?
Was the survey data valid for your situation?
Were your weighting rules valid for your situation?
Common Elements Used in This Section|
Establish Target Market Rates |
Select this link to return to the Establish Target Market Rates page. The Market Compensation Scenario pages use market rate IDs (the Measure ID), which you must occasionally modify in the Establish Target Market Rates page. This link enables you to move directly to the Establish Target Market Rates page without having to navigate the menu. |
Pages Used to Analyze Scenarios|
Page Name |
Definition Name |
Navigation |
Usage |
|
Weighting Rules report |
RUN_WA_0001 |
Workforce Analytics, Workforce Reports, Market Compensation Reports, Weighting Rules |
Run the job code weighting definition Crystal report (WAC0001). |
|
Scenario Fit to Structure report |
RUN_WA_0028 |
Workforce Analytics, Workforce Reports, Market Compensation Reports, Scenario/Fit to Structure |
Run the Market Scenario Fit to Structure Crystal report (WAC0028). |
|
Market Compensation Scenario - Scenario Summary |
WA_MC_SCNSUM |
Workforce Analytics, Market Compensation, Analyze and Approve, Review Market Scenario, Market Compensation Scenario - Scenario Summary |
Review a summary of the market compensation results for a particular scenario and job code, including a comparison of the market fit to the market targets. |
|
Market Compensation Scenario - Fit to Market |
WA_MC_SCNFIT |
Workforce Analytics, Market Compensation, Analyze and Approve, Review Market Scenario, Market Compensation Scenario - Fit to Market |
Review a summary of monetary value and variance details about market fit data as compared to the employee average, for each type of compensation for each job code included in the scenario. |
|
Market Compensation Scenario - Gap to Target |
WA_MC_SCNGAP |
Workforce Analytics, Market Compensation, Analyze and Approve, Review Market Scenario, Market Compensation Scenario - Gap to Target |
Review a summary of monetary value and variance details about the market target data as compared to the employee average, for each type of compensation for each job code included in the scenario. |
|
Market Compensation Scenario - Market Detail |
WA_MC_SCNDET |
Workforce Analytics, Market Compensation, Analyze and Approve, Review Market Scenario, Market Compensation Scenario - Market Detail |
Review the market rates for a particular scenario and job code, including the market range for a particular scenario, job code, and compensation code. |
Running Crystal Reports to Analyze Scenarios
Run these two Crystal reports to review your scenario:
Job Code Weighting Definition report (WAC0001).
This report lists the job code weighting rules for a particular model used in the scenario.
Fit to Structure Market Scenario report (WAC0028).
This report enables you to compare the calculated market rates from the scenario with the current base pay structure of your organization, enabling you to evaluate the validity of the market compensation scenario.
See Also
Reviewing Market Compensation Scenario Summary DataAccess the Market Compensation Scenario - Scenario Summary page.
Use this page after you have run the Market-Based Pricing process. The process calls the Market Compensation process (WA_MC_SCEN), which populates the underlying fact table accessed by this page, the WA_MC_SCEN_FACT table.
The Market Compensation Scenario - Scenario Summary page provides you access to three additional pages in the Market Compensation Scenario component. On each page, the system displays the business unit and scenario ID that you selected to open the component. The system also displays the as of date, currency code, and approval status of the scenario.
Note. On pages such as these, you can apply row-level security at the scenario level. This means that if your implementation has scenario security and you don't have security access to view a scenario, you won't. The scenarios that you see on these pages can vary depending upon your level of security access.
Market Fit Versus Market Target
The chart and grid display information about the market fit and the market target for each job code and compensation code combination in the scenario.
|
Displays the calculated survey data percentile (or measure ID) that is closest to the current employee average compensation. The employee average base pay is calculated from the annual amount in the JOB table, while other compensations (cash and variable compensations) are calculated based on aggregation of the amounts in WA_COMP_HST_F00. To view market fit data on this page, you must have run the Market-Based Pricing process. |
|
|
Displays the specified target survey data percentile (or measure ID) from the Target Market Rates page. If you have not entered target market rates on the Target Market Rates page, then you may not see market target data on the Market Compensation Scenario - Scenario Summary page. Think of these target rates as pay guidelines, in support of your organization's overall pay strategy. |
When you first run the Market-Based Pricing process, use this page to evaluate the market fit, that is, determine the survey data percentile that best fits your organization's pay strategy. Then use the Target Market Rates page to make the chosen survey data percentile a target rate for your pay strategy. Run the MBP_FACT jobstream (which includes the WA_MC_SCEN process) to repopulate the WA_MC_SCEN_FACT table. After you have performed these steps, return to this page and view the market target data, allowing a side by side comparison of the market fit and the market target data. You can also use the other three pages in this component to navigate through the data to view monetary values, variances, and market compensation ranges for each job code and compensation code in the scenario.
Perform this process repeatedly, until you are satisfied that you have valid market compensation scenarios for your benchmark job codes. Then use the results in the WA_MKT_SCEN_TBL table to establish target market rates for your benchmark and non-benchmark jobs.
Reviewing Market Compensation Scenario Fit to Market DataAccess the Market Compensation Scenario - Fit to Market page (Workforce Analytics, Market Compensation, Analyze and Approve, Review Market Scenario, Market Compensation Scenario - Fit to Market).
|
Compensation Code |
Displays the compensation type associated with a specified job code. |
|
Measure ID |
Displays a percentile of the market rate used to calculate monetary amounts for employee average, variance, and employee total, for a given job code and compensation type. |
|
Measure Value |
Displays the calculated market rate value for a specified percentile of a market rate, and for a particular scenario and job code. This is the annual, monetary pay level that you compare against the compensation level for similar jobs in your organization. |
|
Employee Average |
Displays the average employee amount calculated for a specified market rate (measure ID) and compensation type. |
|
Variance |
Displays the variance, or difference, between the Measure Value and employee average for each type of compensation for each job code included in the scenario. |
|
Employee Total |
Displays the total compensation amount for all employees for each type of compensation for each job code included in the scenario. Note. You must run the Market-Based Pricing application engine process (WA_MBP) to correctly populate this field. |
Reviewing Market Compensation Scenario Gap to Target DataAccess the Market Compensation Scenario - Gap to Target page (Workforce Analytics, Market Compensation, Analyze and Approve, Review Market Scenario, Market Compensation Scenario - Gap to Target).
|
Compensation Code |
Displays the compensation type associated with a specified job code. |
|
Measure ID |
Displays the market rate used to calculate monetary amounts for employee average, variance, and employee total, for a given job code and compensation type. |
|
Measure Value |
Displays the actual monetary amount calculated for a specified market rate (measure ID) and compensation type. |
|
Employee Average |
Displays the average employee amount calculated for a specified market rate (measure ID) and compensation type. |
|
Variance |
Displays the variance, or difference, between the employee average amount and the employee total amount. |
|
Employee Total |
Displays the total compensation amount for all employees for each type of compensation for each job code included in the scenario. Note. You must run the Market-Based Pricing application engine process (WA_MBP) to correctly populate this field. |
Reviewing Market Compensation Scenario Market Rate Detail DataAccess the Market Compensation Scenario - Market Detail page (Workforce Analytics, Market Compensation, Analyze and Approve, Review Market Scenario, Market Compensation Scenario - Market Detail).
This page displays details about the range of monetary values as well as associated percentiles (or measure IDs) for each type of compensation for each job code included in the scenario.
|
Best Compensation Fit |
The system selects a check box to indicate the market compensation measure ID whose value is closest to the employee average. |
|
Benchmark |
The system selects a check box to indicate the market compensation measure ID that is closest to your existing target rate. Think of the target rate as a pay guideline, in support of your organization's overall pay strategy. |
Approving Compensation Target Rates
This section provides an overview of the compensation target rate approval process and discusses how to:
Establish target market rates.
Review market compensation details.
Establish market rates for non-benchmark jobs.
Review benchmark job details.
Review job code slotting results.
Approve market compensation target rates.
Understanding the Compensation Target Rate Approval ProcessIn the previous section, you determined that you have valid market compensation scenarios for your benchmark job codes, and you are satisfied with the results in the WA_MKT_SCEN_TBL table. Your next steps are to:
Establish the target rates that your organization wants to use for compensating workers in each of the benchmark jobs.
Establish the rates that your organization wants to use for compensating workers in your non-benchmark jobs.
Approve the results of your decisions.
Pages Used to Approve Compensation Target Rates|
Page Name |
Definition Name |
Navigation |
Usage |
|
Establish Target Market Rates |
WA_MKT_SCEN_VW |
Workforce Analytics, Market Compensation, Process, Establish Target Market Rates, Establish Target Market Rates |
Review the calculated market compensation data for all of the jobs in a particular scenario, and establish target market rates. |
|
Job Code Details |
WA_MKT_JOB_SPNL |
Click the Job Code Target Detail button on the Establish Target Market Rates page. |
Review the market compensation details for a particular job code in a scenario, and select the target rates. |
|
Calculate Jobcode Slotting |
WA_MC_SLOT_DFN |
Workforce Analytics, Market Compensation, Process, Calculate Jobcode Slotting, Calculate Jobcode Slotting |
Establish market rates for non-benchmark jobs, based on available data for benchmark jobs within a scenario. |
|
Benchmark Details |
WA_MC_BNCH_SEC |
Click the View Details link on the Calculate Jobcode Slotting page. |
Review the market compensation rate details for a benchmark job selected on the Calculate Jobcode Slotting page. |
|
Job Code Slotting Results |
WA_MC_SLOT_RSLT |
Click the View Slotting Results link on the Calculate Jobcode Slotting page. |
Review job code slotting results, calculated from criteria selected on the Calculate Jobcode Slotting page. |
|
Market Scenario Approval |
WA_MKT_SCEN_APROVE |
Workforce Analytics, Market Compensation, Analyze and Approve, Approve Market Scenario, Market Scenario Approval |
Review the calculated market compensation data for the jobs in a particular scenario, and review and approve the selected target rates. |
Establishing Target Market RatesAccess the Establish Target Market Rates page (Workforce Analytics, Market Compensation, Process, Establish Target Market Rates, Establish Target Market Rates).
Use this page to:
Select provisional target rates from market compensation data for benchmark jobs, after you have run a market compensation scenario for the first time.
This facilitates your comparison of market fit data versus market target data in the Market Compensation Scenario inquiry component.
Select target rates from market compensation data for benchmark jobs, to determine the final target rates that you want to approve and publish.
Select target rates from market compensation data that you developed for non-benchmark jobs on the Calculate Jobcode Slotting page, to determine final target rates that you want to approve and publish.
Think of these target rates as pay guidelines, in support of your organization's overall pay strategy.
Scenario Targets
When you first access the page, the system displays a row for each job code, compensation code description, and job description included in the scenario. This data is from the WA_MKT_SCEN_TBL table. For any particular row, access the market compensation details (measure IDs, measure values, currency code, and sample count) by clicking the Job Code Target Detail button, which accesses the Job Code Details page.
You have three options for setting target rates using these pages:
Select a default measure id for all rows on the Target Market Rates page. The system sets the selected measure as the target measure for the job code and compensation code combination. Then it enters the corresponding measure value (monetary amount). This assumes that you already know which target measure you want to select, and don't need to review the underlying market compensation data.
Select/update a measure ID for each row on the Target Market Rates page.
To view the underlying market compensation data before you select a target, click the Job Code Target Detail button to access the Job Code Details page where you can also select the target.
To store the changes that you make to the scenario in the WA_MKT_SCEN_TBL table, click Save.
Synchronizing With the Market Compensation Scenario Component
When you use the Target Market Rates page to set target rates for benchmark jobs, the system stores the results in the WA_MKT_SCEN_TBL table, meaning that the targets are added to the specified scenario. After you save the results on this page, the WA_MKT_SCEN_TBL table is out of synchronization with the WA_MC_SCEN_FACT and WA_MC_EMPL_FACT tables. This means that you cannot view the new data on the Market Compensation Scenario inquiry pages until you run the MBP_FACT jobstream (which includes the WA_MC_SCEN process) to update the Data Mart.
Reviewing Market Compensation DetailsAccess the Job Code Details page (Click the Job Code Target Detail button on the Establish Target Market Rates page.).
The system displays rows of data for each compensation code and measure ID for the selected job code, as well as the currency and sample count.
To adjust measure values by rounding:
Select a value in the Round to Nearest field.
Click the Round button.
To adjust measure values by percentages:
Enter a percentage value in the % to Adjust Rates (percentage to adjust rates) field.
Click the Adjust button.
|
Target |
Initially, this check box is available for entry for all rows. Select a particular row as the target rate by selecting the corresponding check box. The system hides all of the check boxes except for the one selected. Think of these target rates as pay guidelines, in support of your organization's overall pay strategy. |
|
Measure ID |
When you return to the Target Market Rates page, in the Measure ID field, the system enters the value selected from the Job Code Details page. |
|
OK |
Click this button or save the changes you make to the scenario, return to the Target Market Rates page. |
Establishing Market Rates for Non-Benchmark JobsAccess the Calculate Jobcode Slotting page (Workforce Analytics, Market Compensation, Process, Calculate Jobcode Slotting, Calculate Jobcode Slotting).
Note. On pages such as this one, you can apply row-level security at the scenario level. This means that if your implementation has scenario security and you don't have security access to view a scenario, you won't. The scenarios that you see on this page can vary, depending upon your level of security access.
The term slotting means determining the market rates for a non-benchmark job by estimating the job's value between two comparable benchmark jobs. While this is true, you can also determine the market rates for a non-benchmark job by direct comparison to a single benchmark job.
Enter an effective date, status, scenario ID, description, and notes (if appropriate).
Rule Definition
To define the rule:
Select a slotting job code in the Slotting Job Code field, for the non-benchmark job.
Values are from the WA_MC_NOBNCH_VW table.
Select a benchmark job code for the system to use when calculating the market rates for the non-benchmark job.
Values are from the WA_MC_BNCHJB_VW table, a view that limits your choices to jobs included in the scenario. Either select a single benchmark job for a direct estimation, or select two or more benchmark jobs for a more complex estimation.
Enter an estimated percent value for the benchmark job in the % of Benchmark (percentage of benchmark) field.
The rows for the Weight % (weight percentage) field must always add up to 100 percent.
|
View Details |
Click this link to review the market compensation data for a selected benchmark job. This link accesses the Benchmark Details page. The page also displays the newly calculated market rates for the non-benchmark job after the system has run the calculation. |
|
Calculate Market Data |
Click this button to calculate market compensation data for the non-benchmark job, based upon the selected benchmark jobs. |
|
View Slotting Results |
Click this link to review the calculated market compensation data for the non-benchmark job. This link accesses the Job Code Slotting Results page. The results are from the WA_MKT_SCEN_TBL table. |
Synchronizing With the Target Market Rates Page
When you use the Calculate Jobcode Slotting page to create market compensation data for non-benchmark jobs, the results are stored in the WA_MKT_SCEN_TBL table, meaning that the job and data are added to the specified scenario. After you save the results on this page, view the results in the Target Market Rates page. Then you must use that page to set targets for non-benchmark jobs.
Synchronizing With the Market Compensation Scenario Component
When you use the Calculate Jobcode Slotting page to create market compensation data for non-benchmark jobs, the results are stored in the WA_MKT_SCEN_TBL table, meaning that the job and data are added to the specified scenario. After you save the results on this page, the WA_MKT_SCEN_TBL table is out of synchronization with the WA_MC_SCEN_FACT and WA_MC_EMPL_FACT tables. This means that you cannot view the new data on the Market Compensation Scenario inquiry pages until you run the MBP_FACT jobstream (which includes the WA_MC_SCEN process) to update the Data Mart.
Reviewing Benchmark Job DetailsAccess the Benchmark Details page (Click the View Details link on the Calculate Jobcode Slotting page.).
Use this page to review the market compensation details for the benchmark job selected on the Calculate Jobcode Slotting page.
|
Measure ID and Measure Value |
For each compensation code included in the scenario for this job code, the system displays the measure IDs and measure values. The measure ID is a percentile of the market rate. The measure value is the calculated market rate value for a particular percentile of a market rate. This is the annual, monetary pay level that you use to compare against the compensation level for similar jobs in your organization. |
|
Calculate Market Data |
After you click this button on the Calculate Jobcode Slotting page, and the system calculates the market rates for the non-benchmark job, the system displays the new market rates in the Adjusted Value field. Compare the two values side-by-side. |
|
Return to Slotting Rule |
Click this link to return to the Calculate Jobcode Slotting page. |
Reviewing Job Code Slotting ResultsAccess the Job Code Slotting Results page (Click the View Slotting Results link on the Calculate Jobcode Slotting page.).
Use this page to review the calculated market compensation data for the non-benchmark job selected on the Calculate Jobcode Slotting page.
|
Compensation Code |
For each compensation code included in the scenario, the system displays the measure IDs and calculated measure values. |
|
Measure ID |
A percentile of the market rate. |
|
Measure Value |
The measure value is the calculated market rate value for a particular percentile of a market rate. This is the annual, monetary pay level that you use to compare against the compensation level for similar jobs in your organization. |
|
Benchmark Count |
The Benchmark Count column indicates the number of benchmark jobs used to calculate the non-benchmark data. |
Approving Market Compensation Target RatesAccess the Market Scenario Approval page (Workforce Analytics, Market Compensation, Analyze and Approve, Approve Market Scenario, Market Scenario Approval).
Note. In addition to PeopleTools page security, you can strictly limit access to scenarios for approval using scenario-level security. This means that if an operator doesn't have security access for a particular scenario, the operator cannot approve it. If you grant an operator access to a scenario approval page and a scenario, the operator has access to all scenario data within that scenario approval page, which enables the operator to view all of the data requiring approval.
Scenario Targets
|
Scenario Targets |
Use this group box to review the associated measures for each job code and compensation code combination in the scenario. Measure IDs are percentiles of a set of market rates for a job. They are associated with a statistical range of amount values, called Measure Values, which are centered around the mean market rate. They are calculated from the compensation survey samples that you selected for this scenario. |
|
Benchmark |
Review the measures that you have decided to use as your targets, which the system indicates by selecting a check box in the Benchmark column. |
Using Application Messaging
After you review the data and are satisfied with the results, approve your decision and publish the results of your decision.
|
Approve |
Click to approve the target rates for use in subsequent strategic compensation analyses in the Workforce Rewards system. The target rates are moved to the WA_MKT_RATE_TBL table, which, unlike the WA_MKT_SCEN_TBL table, is not keyed by scenario ID. After you approve the target rates, use them as strategic references in the Base Pay Structure, Retention Strategy, and Compensation Strategy modules in Workforce Rewards, or in any other PeopleSoft EPM application. |
|
Publish |
Click to use PeopleTools Application Messaging to publish the new target market rates from the WA_MKT_RATE_TBL table. |
Note. After you approve a market compensation scenario, do not run Market Compensation again for the approved scenario. To use the approved scenario settings a second time (meaning that you want to load new surveys in your model and rerun the Market-Based Pricing process), create a new scenario ID referencing the original model, and proceed from there.
Comparing Current Pay Structures With New Target Rates
This section provides an overview of the pay structure compare process and discusses how to:
View final market compensation scenario data.
View salary plan gap data.
Understanding the Pay Structure Compare ProcessAfter you approve and publish your new target market rates, and the results are stored in the WA_MKT_RATE_TBL table, compare the target market rates to your current base pay structure and workforce compensation. Determine whether your current base pay structure, or workforce compensation, is in alignment with your new targets, or whether they need to be adjusted. You can:
Review the new target rate data, using the Review New Market Rate page.
Compare the target rates to the midpoints of your current base pay structure, using the Salary Plan Gap page.
Pages Used to Compare Current Pay Structures With New Target Rates|
Page Name |
Definition Name |
Navigation |
Usage |
|
Review New Market Rate |
WA_MKT_RATE_VW |
Workforce Analytics, Market Compensation, Analyze and Approve, Review New Market Rate, Review New Market Rate |
View the new target rate data for a job code. |
|
Salary Plan Gap |
WA_MKT_STR_CUR_INQ |
Workforce Analytics, Market Compensation, Analyze and Approve, Review Salary Plan Gap, Salary Plan Gap |
View a comparison of the target market rates against the midpoint of the current pay range for all job codes in a particular salary administration plan. You see the variance expressed as an amount and a percentage. |
Viewing Final Market Compensation Scenario DataAccess the Review New Market Rate page (Workforce Analytics, Market Compensation, Analyze and Approve, Review New Market Rate, Review New Market Rate).
Use this page to view the compensation codes and associated measures and measure values for a particular scenario ID and job code.
|
Measure ID |
A percentile of the market rate. |
|
Measure Value |
The measure value is the calculated market rate value for a particular percentile of a market rate. This is the annual, monetary pay level that you use to compare against the compensation level for similar jobs in your organization. |
|
Target |
Any target rates that you selected on the Market Scenario Approval page appear, selected, on this page in the Target column. This visual cue helps you to see which pay targets you established for the various compensation types paid for a particular job. Think of these target rates as pay guidelines, in support of your organization's overall pay strategy. |
Viewing Salary Plan Gap Data
Access the Salary Plan Gap page (Workforce Analytics, Market Compensation, Analyze and Approve, Review Salary Plan Gap, Salary Plan Gap).
Use this page to view a comparison of the compensation target rates against the midpoint of the range for the current salary grade.
For a particular salary plan, view the grade midpoint and target value for each job code and grade. The variance of the grade midpoint from the target value appears as a percentage amount. A positive value indicates that the grade midpoint exceeds the target value. A negative value indicates that the grade midpoint is below the target value.