You can create custom curves to generate other earned value calculations such as forecast or EAC. You must create a BCWS entry before you can create a custom curve. This is applicable when the source is either cost sheet and schedule manager.
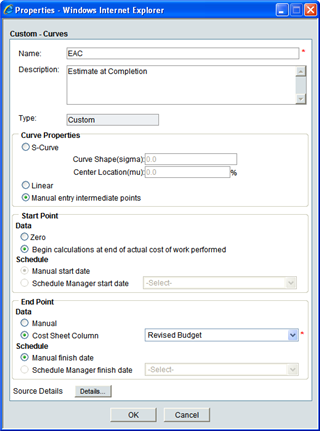
Follow the procedure "Define earned value settings" and choose Custom as the Type.
|
In this field |
Do this |
||||||||||||
|
Name |
Name must be unique |
||||||||||||
|
Description |
Enter an optional description |
||||||||||||
|
Type |
Type is Custom |
||||||||||||
|
Curve Properties |
This determines the shape of the curve that will be generated. Choose one of following options:
|
||||||||||||
|
Start Point |
This determines the start point of the curve. You define the starting value (Data), and when the curve should start (Schedule). Data: Choose an option:
Schedule: Choose an option:
|
||||||||||||
|
End Point |
This determines of the end point of the curve. You define the end value (Data) and when the curve should end (Schedule). Data: Choose an option:
Schedule: Choose an option:
|
||||||||||||
|
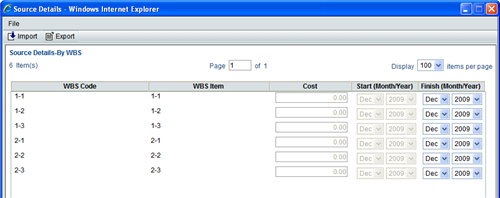
Source Details |
This allows you to enter any manual information required to generate the curve.
|
Data displayed on the window is based on several options chosen during setup of the sheet:
| • | The source chosen on the General tab (cost sheet or schedule sheet) |
| • | Cost Sheet: All WBS codes on the cost sheet are listed |
| • | Schedule Manager: Depending on which schedule sheet(s) are selected for BCWS calculation, and whether any schedule sheet is linked to a work package, the WBS codes may be filtered by the WBS codes on the work package |
| • | The budget option selected for BCWS entry |
| • | Options selected on the custom entry |
Fields on this sheet may be editable depending on the options you chose in the Properties window.
Note: Clicking the Details button on the Properties window will save the curve, even if you later click Cancel to cancel out of the Properties window.
|
Column |
Description |
|||||||||
|
WBS Code |
All WBS codes on the project/shell cost sheet are displayed, with one exception: If the schedule sheet(s) in the BCWS entry are associated with work packages, rather than the cost sheet, then only those WBS codes within those work packages will be displayed here. (Note that if at least one schedule sheet in the BCWS entry is associated with the cost sheet, this window will display all cost sheet WBS codes.) |
|||||||||
|
WBS Item |
The item, as defined on the cost sheet, displays for each code. |
|||||||||
|
Cost |
The behavior of this column depends on what you chose in the Properties window for End Point >Data:
|
|||||||||
|
Start |
This column depends on the Start Point settings in the Properties window:
|
|||||||||
|
Finish |
This column is based on the option chosen as the End Point Schedule:
|
To enter data in the Source Details window
| 1 | Open the custom curve Source Details window: |
For the earned value sheet, open the EV Properties window, Settings tab. Select a custom curve and click Modify, or create a new custom curve. In the custom curve Properties window, click the Details button.
| 2 | Depending on the options defined in the custom curve Properties window, the Cost, Start and/or Finish Date fields may be editable across the WBS codes. Add this information as needed. |
| • | Start is the starting date of the curve. |
| • | End is the end date of the curve. |
| • | If you enter a value in the Cost column, it will automatically display in the last column of the incremental view of the worksheet for the custom curve. You can then open the worksheet and distribute this cost amount across the other columns (and the other time periods) in the worksheet. (See "View and work with worksheets".) |
To import cost data into the Source Details window
| 1 | Open the custom curve Source Details window: |
For the earned value sheet, open the Properties window, Settings tab. Select a custom curve and click Modify, or create a new custom curve. In the custom curve Properties window, click the Details button.
| 2 | Click the Export button and download the CSV file. Save the file to your local drive or open the file directly. |
| 3 | Enter the cost or date information in editable Start, End and/or Cost fields as applicable, depending on the entry settings you specified in the custom curve Properties window. |
| 4 | Save the CSV file. |
| 5 | In the Source Details window, click Import, and import the CSV file. |
Oracle Corporation
Primavera Unifier 9.10 • Copyright © 1998, 2012, Oracle and/or its affiliates. All rights reserved.