 To create an overlay chart:
Run a simulation in Crystal Ball (or restore results).
For overlay charts, the simulation should have more than one forecast.
In the Choose Forecasts dialog, select two or more forecasts to include.
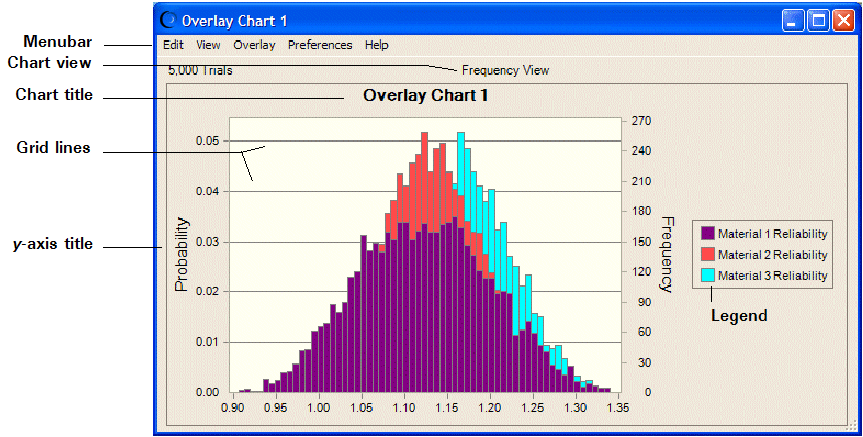
Click OK to create a new overlay chart with the selected forecasts (Figure 29, Overlay Chart for Selected Forecasts).
Optional: Follow the steps in Customizing Overlay Charts and Setting Chart Preferences to change a variety of chart features and highlight those of greatest interest.
Optional: Choose Overlay, and then Fit Probability Distributions to select and display the best fitting distribution for each forecast in the chart (Using Distribution Fitting with Overlay Charts).
You can copy overlay charts and paste them into other applications. For more information, see Copying and Pasting Charts to other Applications.
 .
.