|
|
|
Daily Catering Forecast (REP_EV_FORECAST.REP with REP_EV_FORECAST.FMX)
This is a very detailed catering forecast report that allows printing the forecast figures per day per event type, divided into the selected revenue types. Each event is listed separately with a summary for each event type. It a great tool for the catering department to project their expected revenues in minute detail at any time for any time into the future.
Note: When printing this Report help topic, we recommend printing with Landscape page orientation.
Note: This report requires that the user be granted the EVENT PRINT permission in the selected property to run the report. Also, the Property LOV in this report is further limited by the properties to which the user has the appropriate access granted.
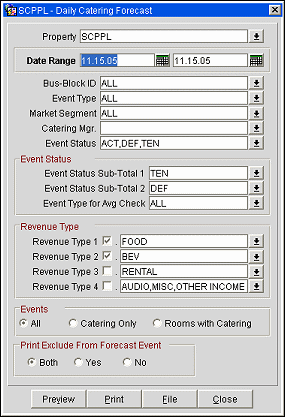
Property. Available when OPS_MHT2 license is active. Choose the property for which the report should be printed.
Date Range. This represents the event date range that the report should cover.
Bus-Block ID. It is possible to select a single business block or a range of business blocks for which to run the forecast report.
Note: When selecting a Master Block ID in the Bus.Block filter, Opera will also include the Sub Block IDs linked to that Master. The report will then print all Events linked to the Master and its Sub Blocks. If a Sub Block ID is selected, only Events linked to that Sub Block will be printed.
Note: If no Account is connected to a Business Block, the Business Block Name will print in the Account field on this report. Also, the Agent Name will print if no Company is attached and the Source Name will print if no Company or Agent is attached.
Event Type. Allows the selection of the event types that should be included or excluded.
Note: Alternate Events are excluded from all catering calculations on this report.
Catering Manager. It is possible to only print event for a specific catering manager or a range of catering managers. The report will rely on the catering manager initials that have been selected on the booking catering tab for this filter.
Event Status. Allows the selection of the event statuses that should be included or excluded. Typically lost or cancelled events would not be included in the forecast. Alternatively it is also possible through this report to ONLY select lost and cancelled events to get an idea of the revenue that was lost from those cancellations over the selected date range.
Event Status Sub-Total 1 and 2. Allows the sub-totaling of different statuses. This could be used to get a sub-total for production statuses as one and another sub-total for return-to- inventory statuses as the other. This would allow to print the report as forecast and lost/cancelled overview without having to print it twice. Or it could be used to group non- deduct statuses into one sub-total and deduct inventory statuses into the other sub-total.
Event Type for Avg Check. Allows selection of the event types that should be included into the average check calculation. If the average check is used for F&B purposes this would typically only be those event types that include food and beverage servings (e.g., Lunch, Dinner,) and not event types like SETUP that generate generally only function space revenue if at all.
Revenue Type 1-4. Up to 4 revenue types or groupings of revenue types can be included to print on the report at any one time. These will be represented as separate revenue columns on the report body and described in the report footer. The check box in front of each revenue type determines if the revenue of this type(s) ( if checked) should be included in the average check calculation. Again, average checks could be based solely on F&B revenue types and events, or alternatively could be calculated for any catering revenue that gets generated.
Note: When the application parameter Use Forecast Value Only is set to Y and an Event has an F&B Minimum Rate Code attached, forecasted revenue will not be reported or recorded for the Revenue Types that are configured to contribute to the F&B Minimum. If the Rate Code is changed to one that does not require a minimum and expected revenue has not been added to those revenue types, the forecasted revenue for revenue types configured to contribute to the F&B Minimum will be reported.
Note: Currency values in this report can be represented by an abbreviation when the application setting General>Currency Divisor Value is configured. For example, if values recorded in this report are too long to accurately display in the allotted space, such as 354,000, the currency divisor value set to K for 1000 can change that display to 354K so that all values over 1000 will display shortened and without decimals. The divisor value can also be set to M, which will shorten all amounts over 1 million by 5 digits and print them without decimals.
Events - All/Catering Only/Rooms with Catering. These options allow you to decided which types of events to view in the results.
Print Exclude from Forecast Event - Both/Yes/No. Select this option to either include or exclude certain events. When Both is selected all qualifying events will print. When Yes is selected, only events that have had the Exclude from Forecast Reports flag checked will print (the Exclude from Forecast Reports flag is accessible on the Events Screen Details tab). When No is selected only events that have NOT been marked as Exclude from Forecast Reports will print.
Preview. Use the preview option to view the generated output of this report in PDF format.
Print. Use the Print button to print the report to the selected output.
File. Prints the generated report output to an *.rtf file.
Close. Closes this report screen.
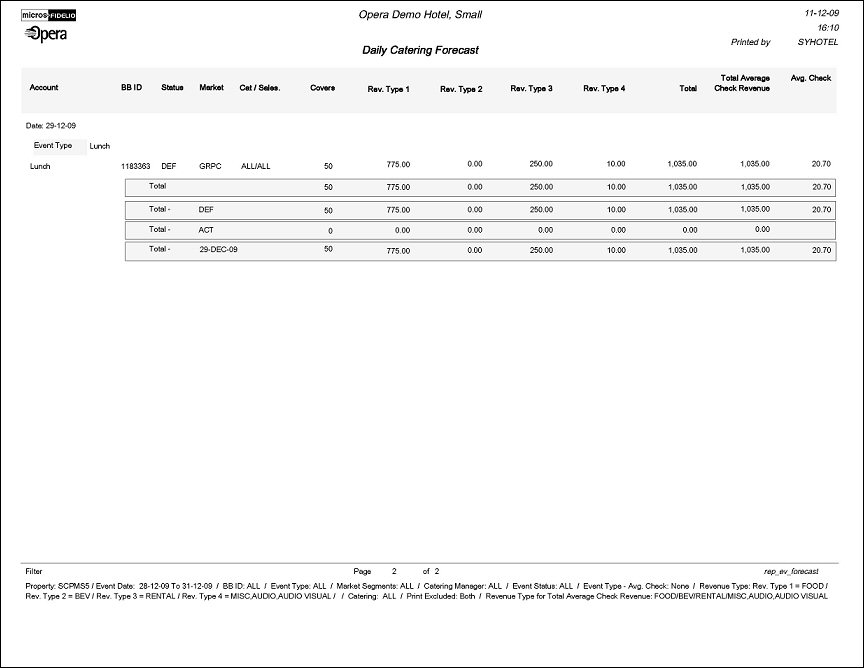
The report is sorted in date order starting with first date selected in the date range filter. Within each date, the events are grouped by event type. For each event the following columns are displayed in the report. Account name, booking ID, booking status, catering owner initials, rooms owner initials, number of covers, revenues in four columns as selected per type on the filter form, total revenue, total average check revenue (this only show the revenue of those event types and revenue types that have been selected for calculation of the average check on the filter form) and the average check value. This is calculated by dividing the average check revenue by number of covers of those event types that have been selected for average check calculation.
Revenues are calculated in the following sequence by revenue type by event. If billed revenue exist, show billed revenue. If no billed revenue exists, show actual revenue. If no actual revenue exists, show guaranteed revenue. If no guaranteed revenue exists, show expected revenue. If no expected revenue exists, show forecasted revenue. If no forecasted revenue exists, show zero.
For each day, revenues are subtotaled per event type. As a summary for each day, the sub- totals for selected statuses are printed (if so selected on the filter form) followed by a total for the day.