|
|
|
Market Forecast Report (REP_MARKET_FORECAST.REP with REP_MARKET_FORECAST.FMX)
The Market Forecast report is used to display event production by market segment. This data can be further filtered by event status and revenue type.
Note: When printing this Report help topic, we recommend printing with Landscape page orientation.
Note: This report requires that the user be granted the EVENT PRINT permission in the selected property to run the report. Also, the Property LOV in this report is further limited by the properties to which the user has the appropriate access granted.
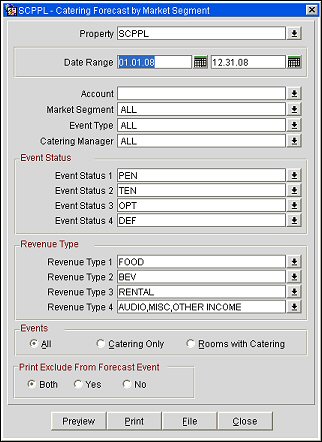
Property. Available when OPS_MHT2 license is active. Choose the property for which the report should be printed.
Date Range. Select a To and From date range for events.
Account. Select one, multiple or all available accounts from the list of values.
Market Segment. Select one, multiple or all available market segments from the list of values.
Event Type. Select one, multiple, or all available event types from the list of values.
Catering Manager. Select one, multiple or all available catering managers from the list of values.
Event Status 1 - 4. For each field select at least one event status from the available list of values.
Revenue Type 1 - 4. For each field, select at least one revenue type from the available list of values.
Note: When the application parameter Use Forecast Value Only is set to Y and an Event has an F&B Minimum Rate Code attached, forecasted revenue will not be reported or recorded for the Revenue Types that are configured to contribute to the F&B Minimum. If the Rate Code is changed to one that does not require a minimum and expected revenue has not been added to those revenue types, the forecasted revenue for revenue types configured to contribute to the F&B Minimum will be reported.
Events - All/Catering Only/Rooms with Catering. These options allow you to decided which types of events to view in the results.
Print Exclude from Forecast Event - Both/Yes/No. Select this option to either include or exclude certain events. When Both is selected all qualifying events will print. When Yes is selected, only events that have had the Exclude from Forecast Reports flag checked will print (the Exclude from Forecast Reports flag is accessible on the Events Screen Details tab). When No is selected only events that have NOT been marked as Exclude from Forecast Reports will print.
Preview. Use the preview option to view the generated output of this report in PDF format.
Print. Use the Print button to print the report to the selected output.
File. Prints the generated report output to an *.rtf file.
Close. Closes this report screen.
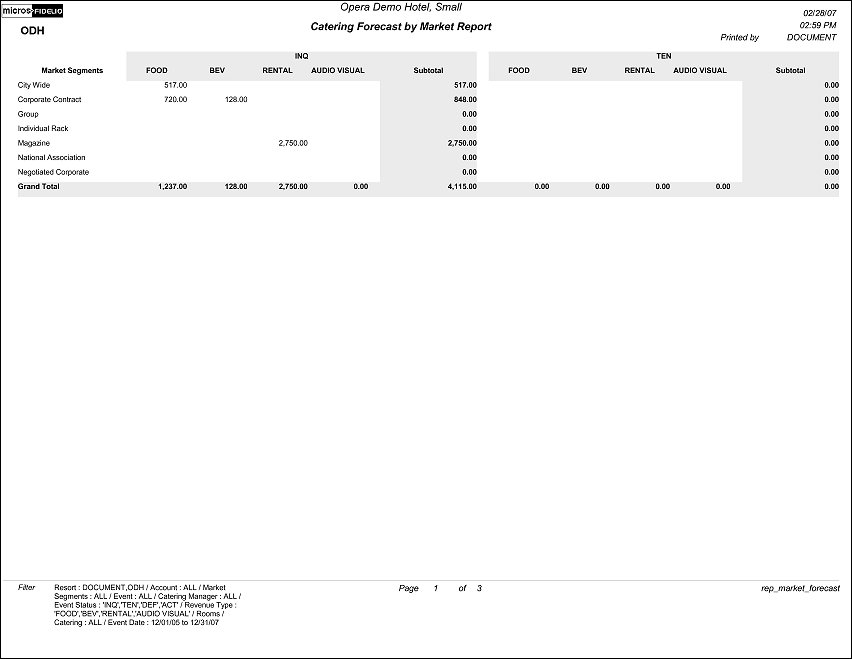
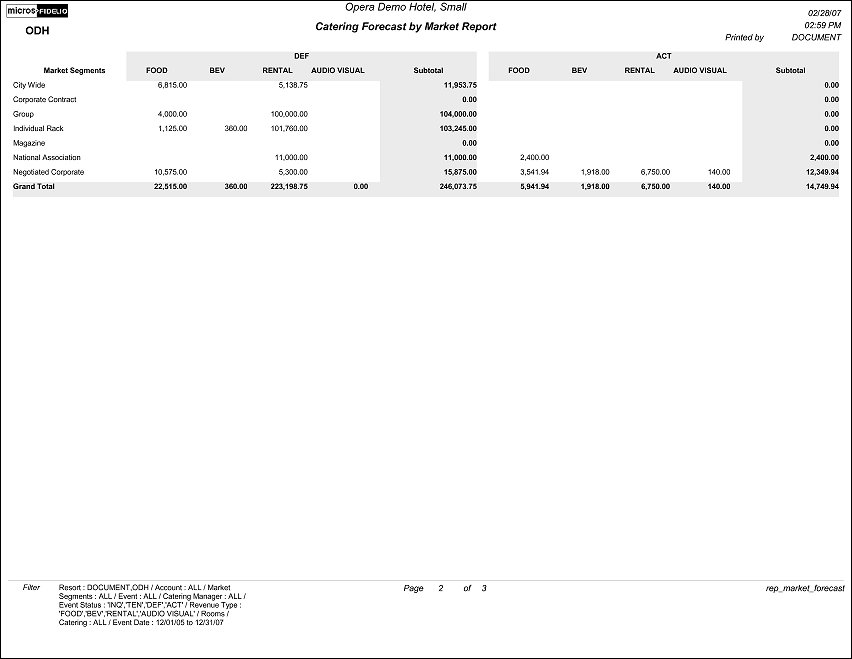
The report contains two tables per page (depending on the number of event statuses selected in the report form) each containing all market/event data per event status. Each Table will contain a number of rows and columns that directly corresponds with the number of market segments and revenue types selected on the report form. The last column of each event status table will contain a subtotal by market segment for each of the selected revenue types. The last row of the event status table will contain grand totals for all columns.
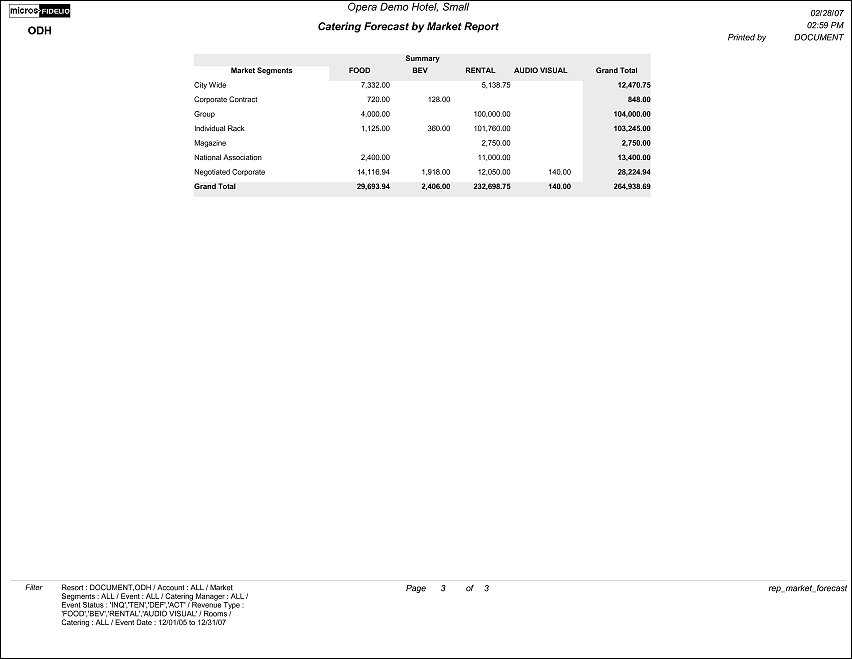
Note: Depending on the number of filters selected prior to generating this report, there will always be at least two pages as the last page contains a summary with calculated grand totals for all selected filters.