11 Accessing Recovery Appliance Reports
This chapter explains how to access the pre-created Oracle Business Intelligence (BI) Publisher reports in Oracle Enterprise Manager Cloud Control (Cloud Control). To learn how to access the Backup Reports page for a protected database in Cloud Control, see Zero Data Loss Recovery Appliance Protected Database Configuration Guide.
This chapter contains the following topics:
11.1 About Recovery Appliance Reports
This section contains the following topics:
See Also:
"Protection Policies" for an architectural overview
11.1.1 Purpose of Recovery Appliance Reports
A principal task for a Recovery Appliance administrator is storage capacity planning. Through BI Publisher, Recovery Appliance provides pre-created BI Publisher reports that enable you to meet the following goals:
-
Ensure that the Recovery Appliance has sufficient storage space for its needs
By using the capacity reports, you can plan for additional storage, reduce the number of new protected databases added to the Recovery Appliance, or adjust protection policies so that the aggregate recovery window space decreases.
-
Ensure that the network is not overloaded
The capacity reports also indicate whether the Recovery Appliance has maximized network capacity. In some cases, you can reduce network load by redistributing network traffic more evenly throughout the day. If network traffic is not distributed, and if network peaks are close to maximizing network bandwidth, then you may need to adjust the backup window times of some protected databases.
-
Provide a good view of system performance and activity for service requests
-
Obtain a brief or highly detailed status report for any protected database, which can sometimes be useful for troubleshooting databases that are not meeting recovery window goals
11.1.2 Overview of Recovery Appliance Reports
BI Publisher is an enterprise reporting solution for authoring, managing, and delivering reports and other documents.
11.1.2.1 Pre-Created BI Publisher Reports
Recovery Appliance provides the following pre-created BI Publisher reports:
-
This report provides an overview of storage for the Recovery Appliance so you can forecast when it will run out of capacity. Of special usefulness is the summary table, which provides a quick view of the number of days until capacity is exceeded. The network capacity planning summary provides a view of the aggregated network traffic over various time periods. This view shows both average and maximum rates, which are based on network samples.
-
This report provides a finer granularity of information about capacity planning. It provides information on storage capacity, network throughput, CPU utilization for each protected database host, and disk and flash storage I/O throughput over time. Unlike the capacity planning summary, the detailed report also has memory and IOPS summary information, and detailed daily data.
-
Recovery Window Summary
This report lists protected databases that are not meeting their recovery window goal or are exceeding their unprotected window threshold (see
unprotected_windowin "CREATE_PROTECTION_POLICY"). You can use this report as a quick view of recovery window and unprotected data window issues for a Recovery Appliance, and then follow up on individual protected databases using the Protected Database Details report. -
This report contains extensive status information about a protected database, including summaries of the following:
-
The reserved space, which is the minimum amount of disk space in the Recovery Appliance reserved for the database to meet its disk recovery window goal
-
The status of real-time redo transport, which eliminates data loss
-
Data sent and received over time for backup, copy-to-tape, and Recovery Appliance replication operations, which gives a good overview of the traffic coming to and from the protected database to the Recovery Appliance
-
Top 10 Protected Databases by Data Transfer
This report ranks the top 10 protected databases according to the amount of backup data transferred to or from the Recovery Appliance. The report aggregates data by hour or by day. Specifically, the report measures the following amounts:
-
Backup data sent to the Recovery Appliance
-
Replication data sent by the Recovery Appliance
-
Copy-to-tape data sent by the Recovery Appliance
This report does not correlate directly to how much space is being used by backups of the ranked databases.
-
The preceding reports are only accessible through BI publisher. Also, the BI Publisher software included with Cloud Control can only access data in the Enterprise Manager Repository, not data in the Recovery Appliance schema.
Note:
Although performance data is accessible through SQL queries of V$ and recovery catalog views, Oracle highly recommends that you use the BI Publisher reports instead. Recovery Appliance has finite CPU and other resources, so if users run frequent or expensive SQL queries, then overall Recovery Appliance performance can suffer.
See Also:
-
Recovery Appliance View Reference for a complete list of all the Recovery Appliance views
-
Oracle Enterprise Manager Licensing Information
11.1.2.2 BI Publisher Report Scheduling
Oracle recommends that you configure BI Publisher to generate reports automatically on a regular schedule (for example, every week), and to send the reports by email to the backup management team. You can also generate reports as needed using the techniques described in this chapter.
See Also:
Oracle Fusion Middleware User's Guide for Oracle Business Intelligence Publisher to learn how to schedule reports using BI Publisher
11.1.3 Accessing the Recovery Appliance Reports Page in Cloud Control
This section explains how to access the Recovery Appliance Reports page, which links to all pre-created BI Publisher reports.
To access the Recovery Appliance Reports page:
-
Access the Recovery Appliance Home page, as described in "Accessing the Recovery Appliance Home Page".
-
From the Enterprise menu, select Reports, and then BI Publisher Enterprise Reports.
The BI Publisher Enterprise Reports page appears.
-
Expand the Enterprise Manager Cloud Control folder, and then expand the Recovery Appliance Reports subfolder.
Links to the pre-created reports are shown.
See Also:
Cloud Control online help to learn how to view reports in BI Publisher
11.1.4 Basic Tasks for Accessing Recovery Appliance Reports
This section explains the basic tasks involved in managing reports. Figure 11-1 shows the overall workflow described in Recovery Appliance Workflow, with the reporting tasks highlighted.
Figure 11-1 Reporting Tasks in the Recovery Appliance Workflow

Description of "Figure 11-1 Reporting Tasks in the Recovery Appliance Workflow"
Typically, you perform reporting tasks in the following sequence:
-
During the planning phase, familiarize yourself with the monitoring and reporting tools available through Cloud Control.
"Planning for Recovery Appliance" describes these tasks.
-
During the ongoing maintenance phase (see "Maintenance Tasks for Recovery Appliance"), review the reports as needed. Typical tasks include:
-
Review the Storage Capacity Planning Summary every week, using the Capacity Planning Details to get more detailed information.
"Accessing the Storage Capacity Reports" describes this task.
-
Review the protected database reports as needed:
-
"Accessing the Recovery Window Summary Report" describes this task.
-
"Accessing the Protected Database Details Report from the Recovery Appliance Reports Page" describes this task.
-
"Accessing the Protected Database Data Transfer Report" describes this task.
-
-
11.2 Accessing the Storage Capacity Reports
This tutorial explains how to view the storage capacity reports for a Recovery Appliance.
Assumptions
Assume that the following statements are true of your Recovery Appliance environment:
-
The Recovery Appliance named
ZDLRA Londonwas set up over two weeks ago. -
20 protected databases back up to
ZDLRA London.
To review reports on storage capacity:
-
Go to the pre-created reports page, as described in "Accessing the Recovery Appliance Reports Page in Cloud Control".
-
Click Capacity Planning Summary.
The BI Publisher Enterprise page appears.
-
Enter your BI Publisher credentials, and then click Sign In.
The Capacity Planning Summary page appears.
-
In Recovery Appliance, select a Recovery Appliance, and then click Apply.
For example, select ZDLRA London.
-
Review the Storage Capacity Planning Summary section to determine the storage growth rate and days until capacity is exceeded.
For example, the following graphic shows the summary for ZDLRA London:
The key metric is the 6.85 days until capacity is exceeded. Within a week, the Recovery Appliance will either purge backups or reject incoming backups, depending on the protection policy settings (see "Guaranteed Copy").
-
View the historical storage trends.
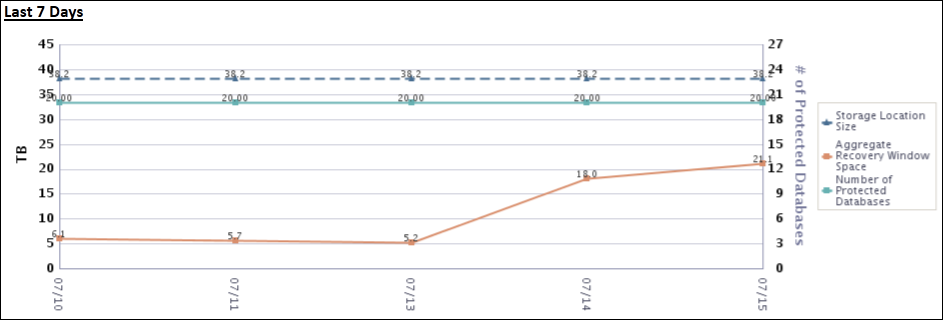
For example, examine the trends for the past week:
The preceding chart shows that over the last two days, the total space needed to satisfy the recovery window goals for all protected databases has increased from 5.2 TB to 21 TB. The number of protected databases has been steady at 20.
-
In the Network Capacity Planning Summary, check the network throughput.
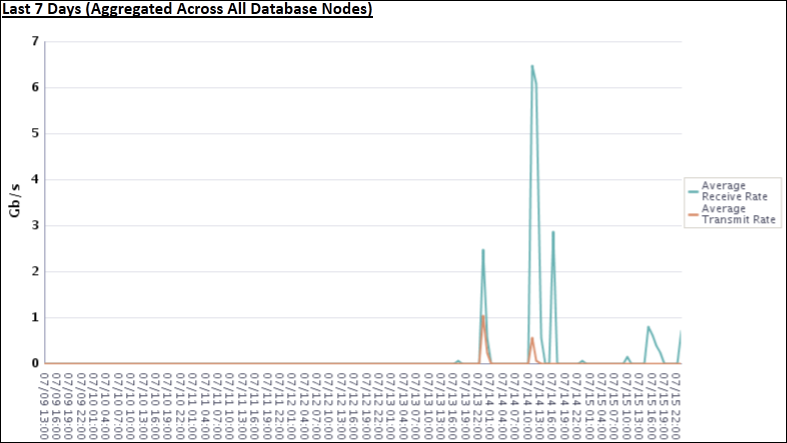
For example, examine the network throughput for the past week:
The preceding chart shows that the receive rate spiked during the last two days.
The network capacity planning summary provides a view of the aggregated network traffic over various time periods (24 hours, 7 days, and 30 days).
-
Return to the pre-created reports page.
-
Click Capacity Planning Details.
The Recovery Appliance: Capacity Planning - Details page appears.
This report provides an even finer granularity of information than the capacity planning summary. Unlike the capacity planning report, the detailed report also has memory and IOPS information.
-
If the desired Recovery Appliance is not already selected in Recovery Appliance, then select it and click Apply.
-
At the beginning of the report, click Storage Capacity Planning Details to jump to this section.
-
Scroll down to the Cell Disk IO subsection of the IO Historical Data section.
For example, for each storage server, the following table shows the IOPS and throughput at 15 minute intervals:
11.3 Accessing the Recovery Window Summary Report
This tutorial explains how to view the recovery window summary of the databases protected by your Recovery Appliance.
Assumptions
Assume that the following statements are true of your environment:
-
The Recovery Appliance named
ZDLRA Montrealprotects 13 databases. -
You want to determine whether any database has not been meeting its recovery window.
To review the recovery window summary report:
-
Go to the pre-created reports page, as described in "Accessing the Recovery Appliance Reports Page in Cloud Control".
-
Click Recovery Window Summary.
The Recovery Appliance: Recovery Window Summary page appears.
-
Enter your BI Publisher credentials, and then click Sign In.
The Recovery Appliance: Recovery Window Summary page appears.
-
In Recovery Appliance, select a Recovery Appliance, and then click Apply.
For example, select ZDLRA Montreal.
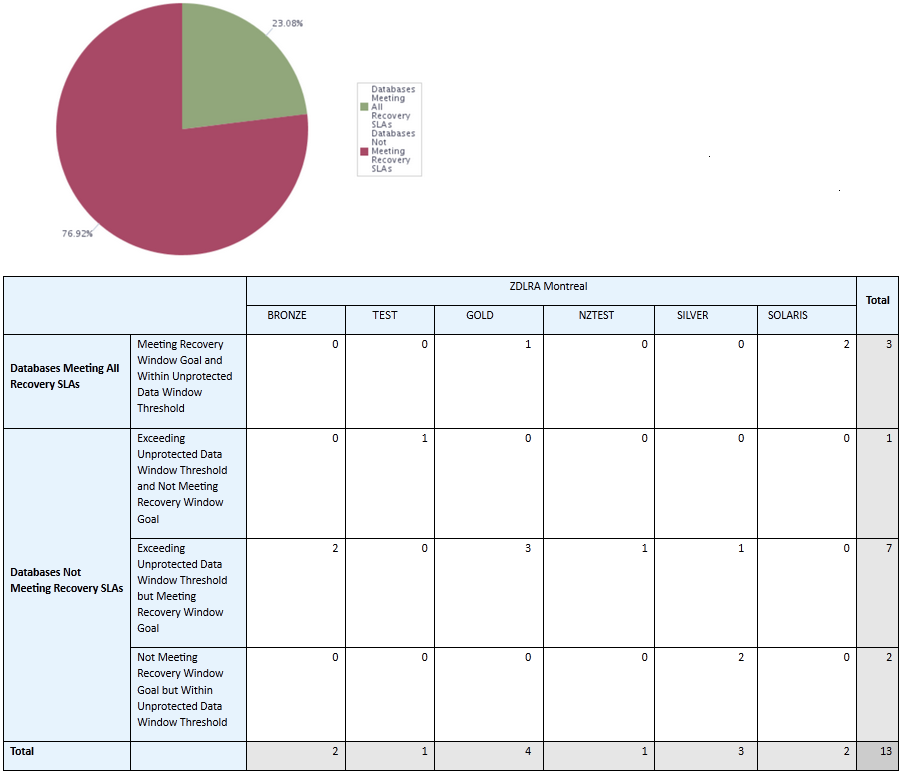
The page refreshes, displaying the summary at the top, as in the following example:
The pie chart shows that over 75% of the databases are not meeting their service level agreements. The table shows that out of 13 total databases, 3 databases are not meeting their recovery window goal. Also, 8 databases are not within their unprotected data threshold.
-
Scroll down to charts showing the databases not meeting their recovery window goals.
The following example shows two sample reports:
The preceding example shows that databases
DB1116andDB1123both have recovery window goals of 1 day, but have recovery windows that are many hours short of this goal.DB11242also has a goal of 1 day, but has an actual recovery window of less than an hour.
11.4 Accessing the Protected Database Details Report
You can access the Protected Database Details report either from the Recovery Appliance Reports page or the Protected Database page.
11.4.1 Accessing the Details Report from the Protected Databases Page
This access path is an alternative to using the Enterprise menu to go to the Recovery Appliance Reports page.
To access the Protected Database Details page:
-
Access the Recovery Appliance Home page, as described in "Accessing the Recovery Appliance Home Page".
For example, access the home page for
ZDLRA Montreal. -
From the Recovery Appliance menu, select Protected Databases.
The Protected Databases page appears.
-
In the Protected Databases table, select a database.
For example, select DB1124.
At the bottom of the page, the Protected Database Detail section is refreshed.
-
In the Protected Database Detail section, select Status.
The Status subpage is displayed, as shown in the following example:
-
Click Protected Database Report.
The BI Publisher page appears.
-
Enter your BI Publisher credentials, and then click Sign In.
The Recovery Appliance: Protected Database Details page appears (see Step 4 in "Accessing the Protected Database Details Report from the Recovery Appliance Reports Page").
11.4.2 Accessing the Protected Database Details Report from the Recovery Appliance Reports Page
This tutorial explains how to access detailed reports for protected databases.
Assumptions
Assume that Recovery Appliance named ZDLRA Philadelphia protects 12 databases.
To review reports on protected databases:
-
Go to the pre-created reports page, as described in "Accessing the Recovery Appliance Reports Page in Cloud Control".
-
Click Protected Database Details.
The Recovery Appliance: Protected Database Details page appears.
Note:
You can also access this report directly from the Protected Databases page, as explained in "Accessing the Details Report from the Protected Databases Page".
-
In Recovery Appliance, select a Recovery Appliance.
For example, select ZDLRA Philadelphia.
-
In Protected Database, select a database, and then click Apply.
For example, select DB1124.
The Recovery Appliance: Protected Database Details page appears.
-
Scroll down to the Backup/Recovery section.
For example, the following graphic shows the statistics for the DB1124 database:
The preceding statistics indicate that the database needs 182.83 GB to meet its recovery window goal.
-
Examine the backup history.
For example, the following chart shows the data sent and received over the past week by DB1124:
The preceding chart shows that the daily backup data was between 31 and 49 GB every day except 8/25, when it was 305.1 GB. On every day, the amount of replication data sent was slightly less than the backup data received.
-
Repeat the preceding two steps as needed to investigate the backup activity of all the protected databases.
11.5 Accessing the Protected Database Data Transfer Report
This tutorial explains how to view the data transfer reports for a Recovery Appliance.
Assumptions
Assume that the following statements are true of your environment:
-
The Recovery Appliance named
ZDLRA Montrealprotects 10 databases. -
The Recovery Appliance replicates backups for some databases, but does not archive to tape.
-
You want to determine which database has been transferring the most data over the past week.
To review the data transfer report:
-
Go to the pre-created reports page, as described in "Accessing the Recovery Appliance Reports Page in Cloud Control".
-
Click Top 10 Protected Databases by Data Transfer.
The BI Publisher Enterprise page appears.
-
Enter your BI Publisher credentials, and then click Sign In.
The Top 10 Protected Databases by Data Transfer page appears.
-
In Recovery Appliance, select a Recovery Appliance, and then click Apply.
For example, select ZDLRA Montreal.
-
Click Top 10 Databases by Backup Data.
The Backup Data section is shown.
-
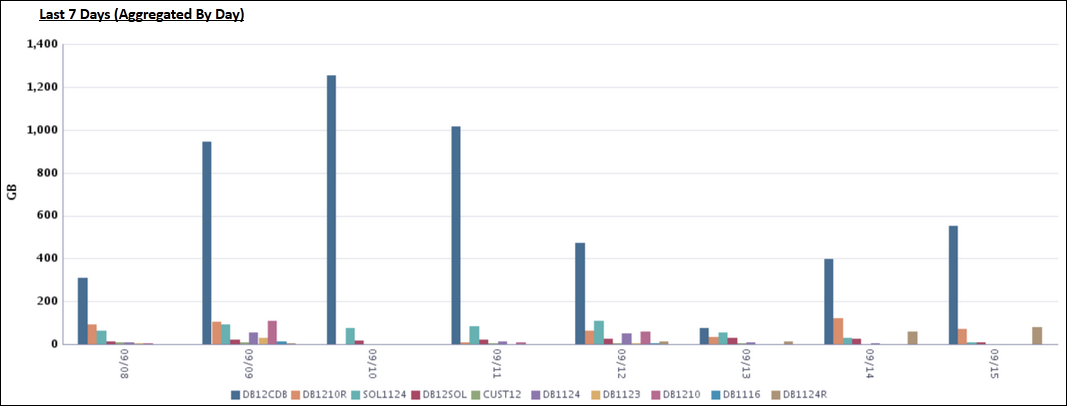
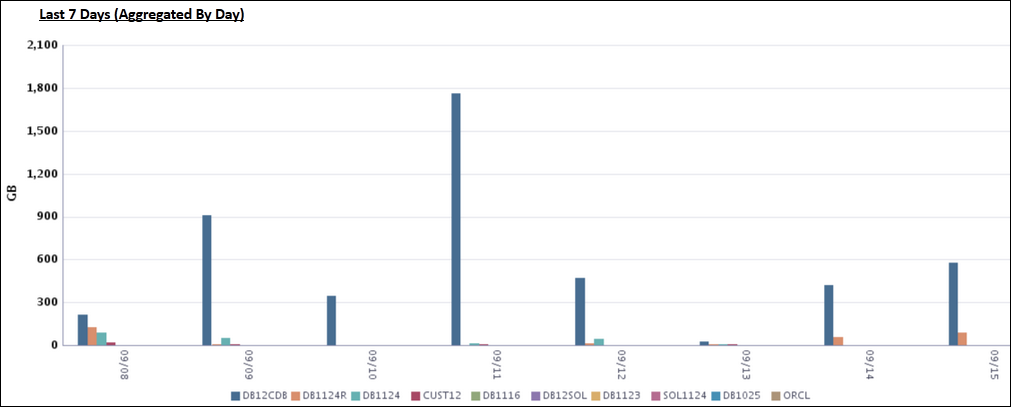
Scroll down to the Last 7 Days (Aggregated By Day) section.
For example, the period from 09/08 to 09/15 shows the following data:
According to the preceding chart, database
DB12CDBbacked up the most data every day. The peak transfer was on 09/09, with about 1.25 TB. -
Return to the top of the report, and then click Top 10 Databases by Replication Data.
The Replication Data section is shown.
-
Scroll down to the Last 7 Days (Aggregated By Day) section.
For example, the period from 09/08 to 09/15 shows the following data:
According to the preceding chart, database
DB12CDBreplicated the most data every day. The peak transfer was on 09/11, with around 1.7 TB.

