Performance Analyzer New Features
This section summarizes the new features in this release of the Performance Analyzer and related tools. For more information, see the Help in Performance Analyzer.
-
Simplified Hardware Counter Profiling
-
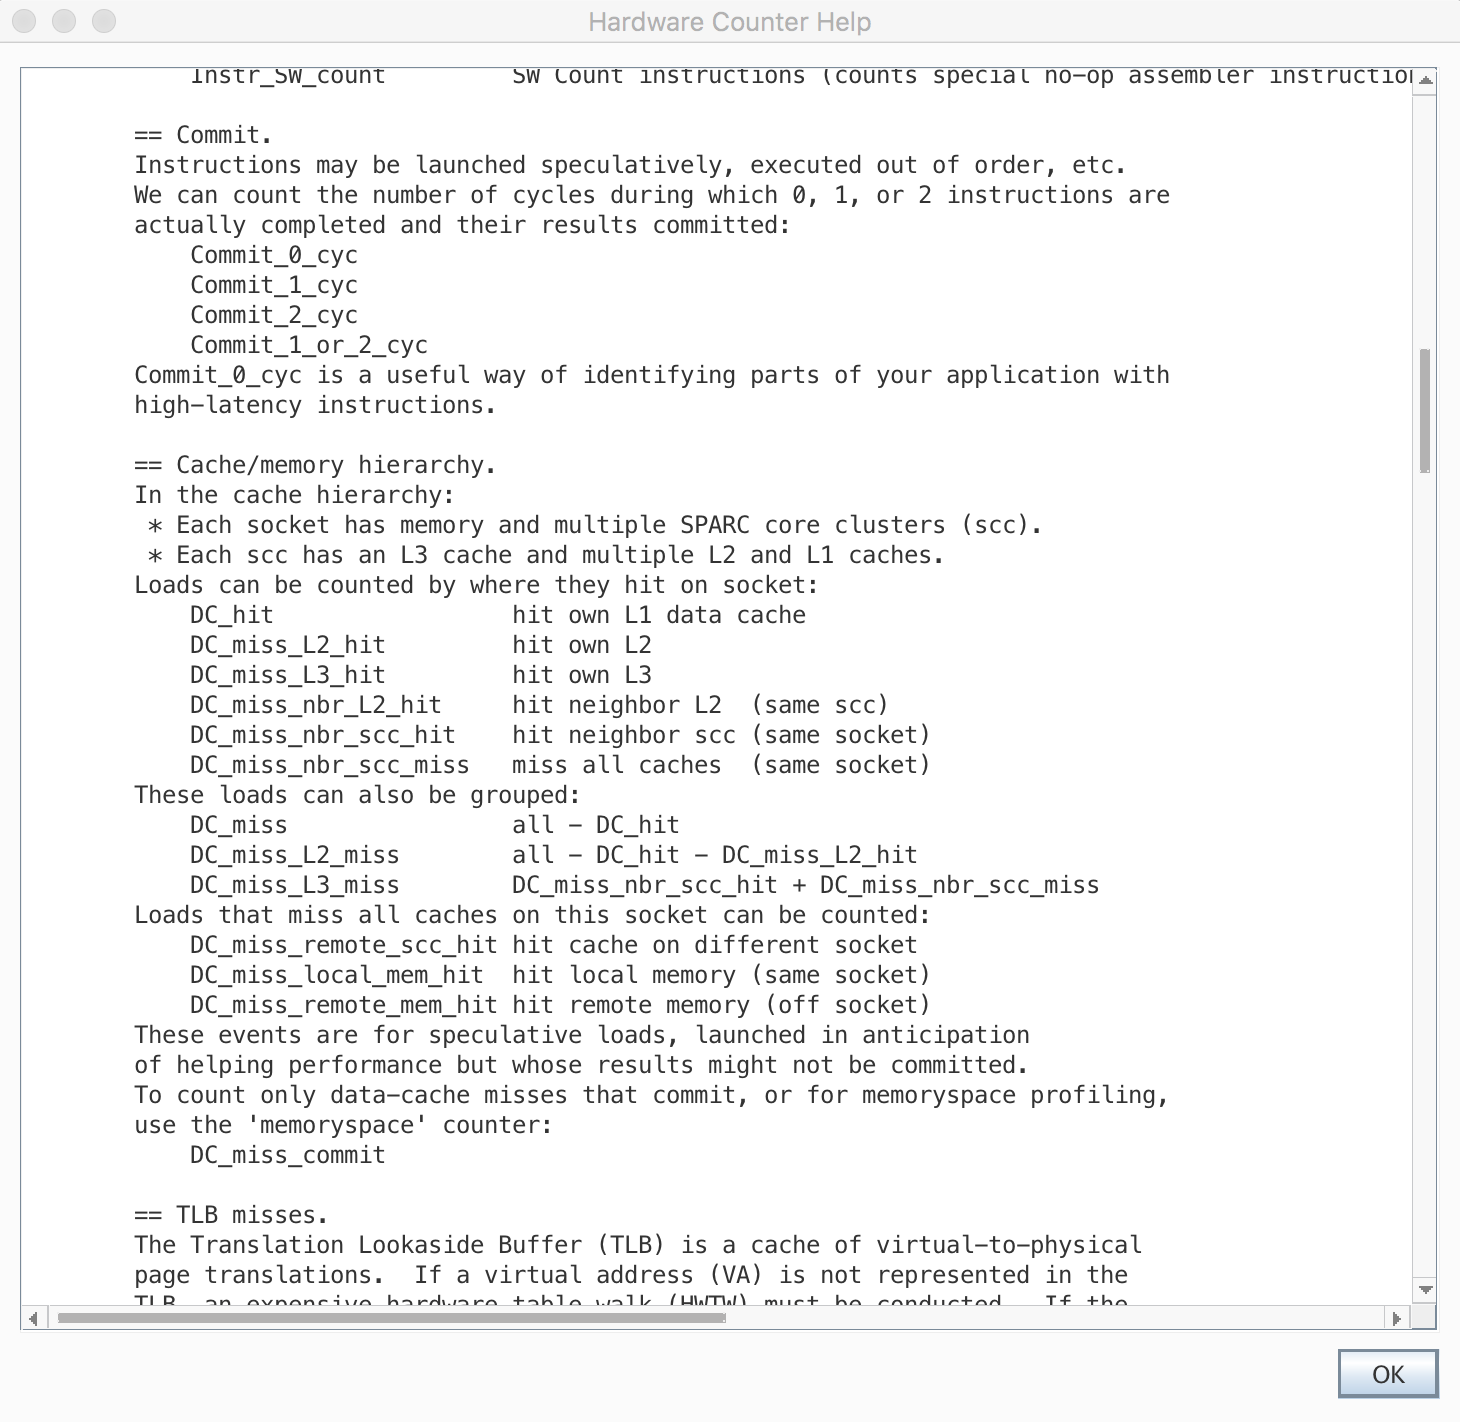
New, processor-specific help provides overviews of key hardware counters (SPARC only)
-
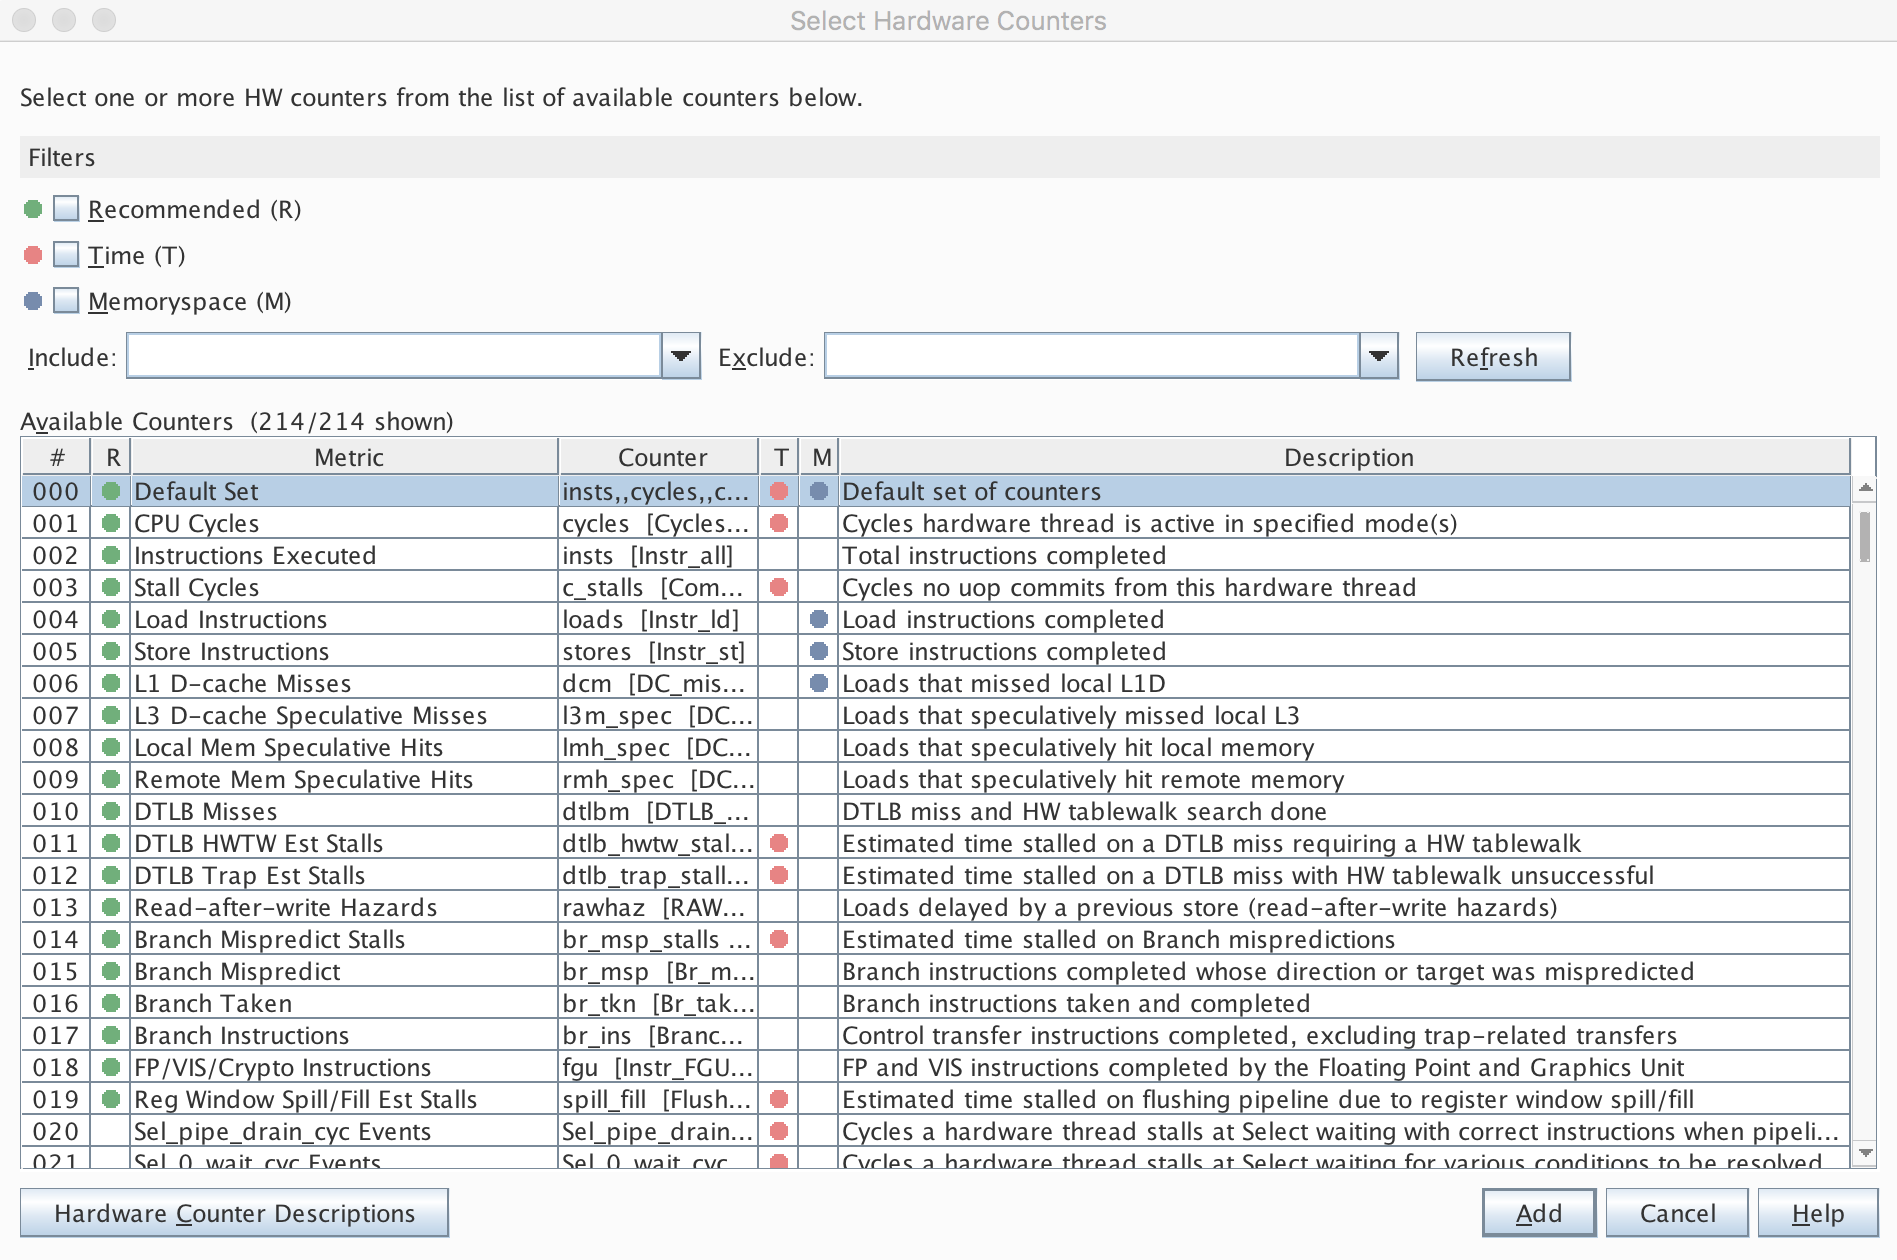
New dialog box Select Hardware Counters describes counters in more detail. Additionally, it enables you to filter counters and to add counters more simply.
-
New auto option to automatically select appropriate profile rates.
-
Updated default hardware counter sets for supported hardware.
-
Updated views for memoryspace profiling for supported platforms. (On x86 systems, memoryspace profiling requires at least Oracle Solaris 11.3)
-
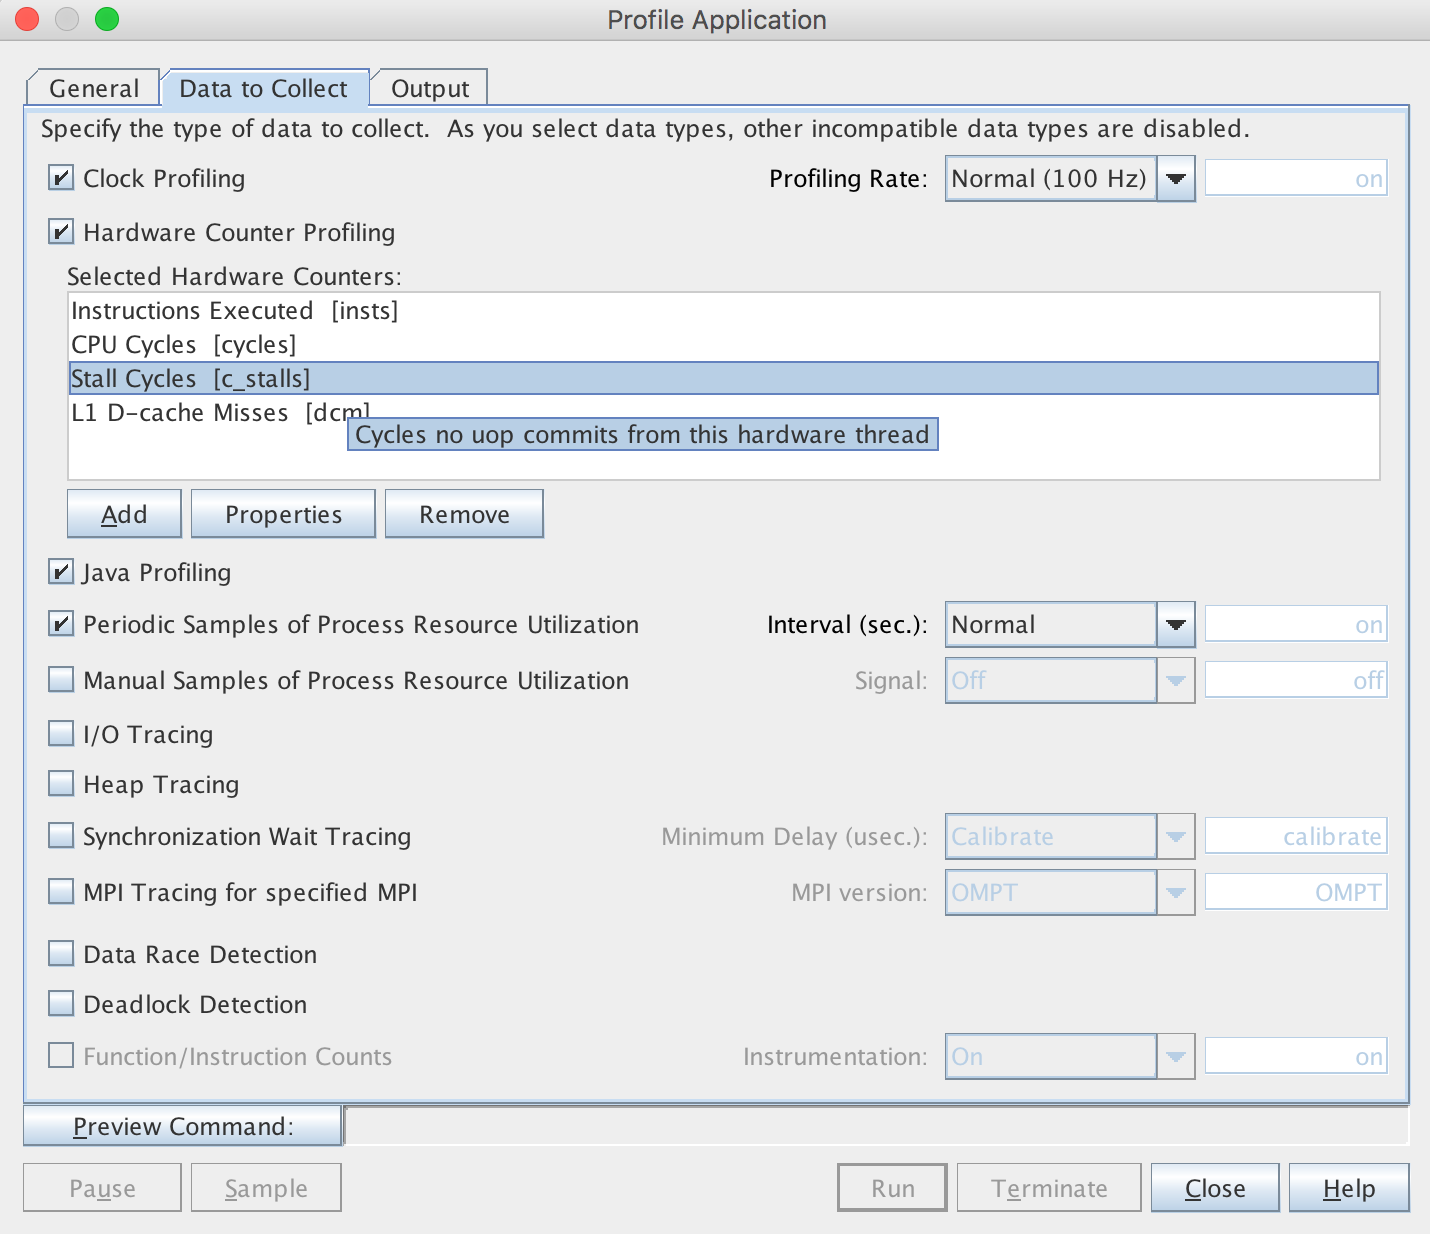
Simplified workflow for selecting hardware counters
-
-
Java Profiling Enhancements
-
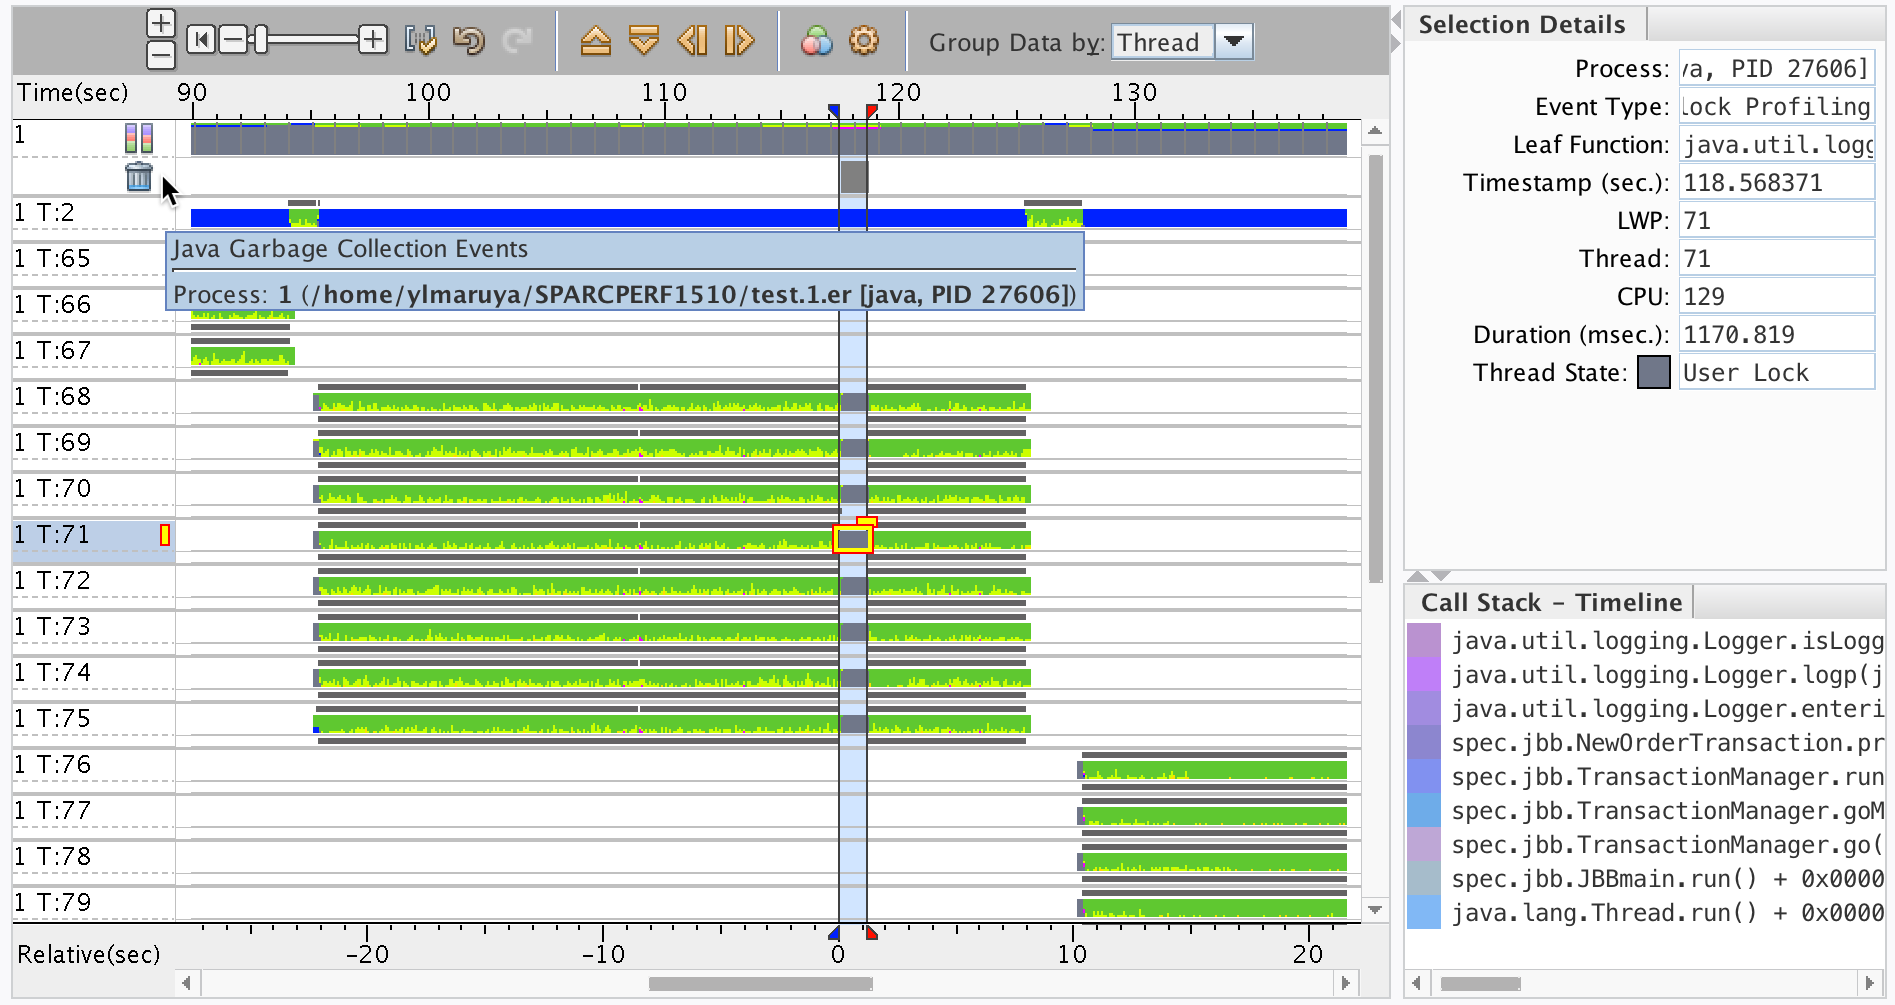
Information about Java garbage collector events is now shown on the Overview and in Timeline.
-
Improved attribution of performance metrics to functions, source, bytecode, and machine code.
-
-
Metric Presentation Enhancements
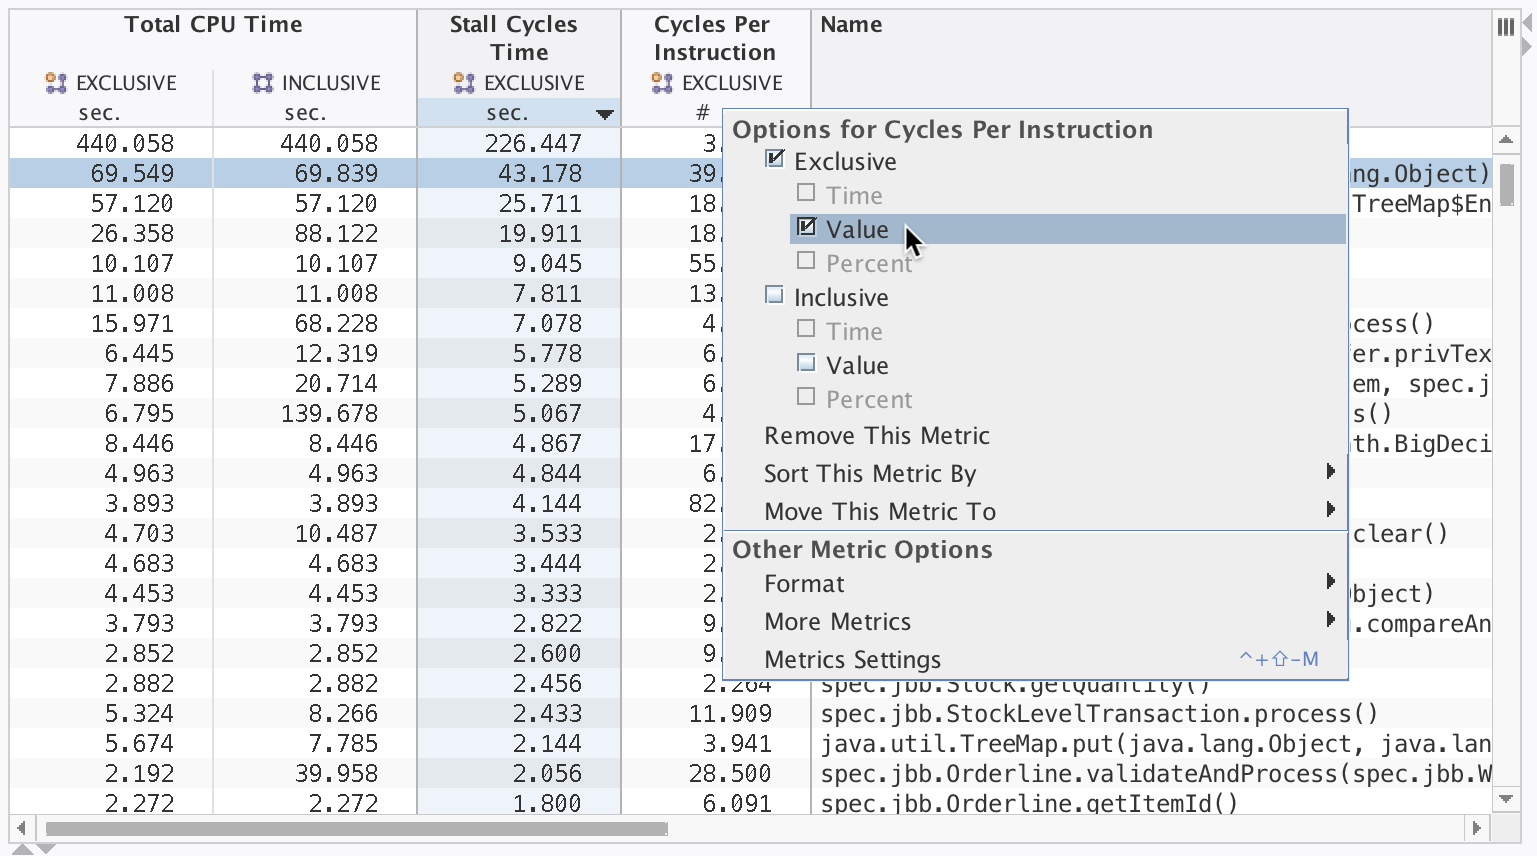
Most data views have improved presentation of metrics and enable you to more conveniently control how data is displayed:
-
Data columns are grouped to better show inclusive and exclusive metrics.
-
Column headings provide controls in the top corners that you can click to configure the metrics or delete them altogether from the view.
-
The controls for selecting time or percent for displaying metrics that were previously located in the Overview screen are now available in the column heading controls.
-
-
Timeline Enhancements
-
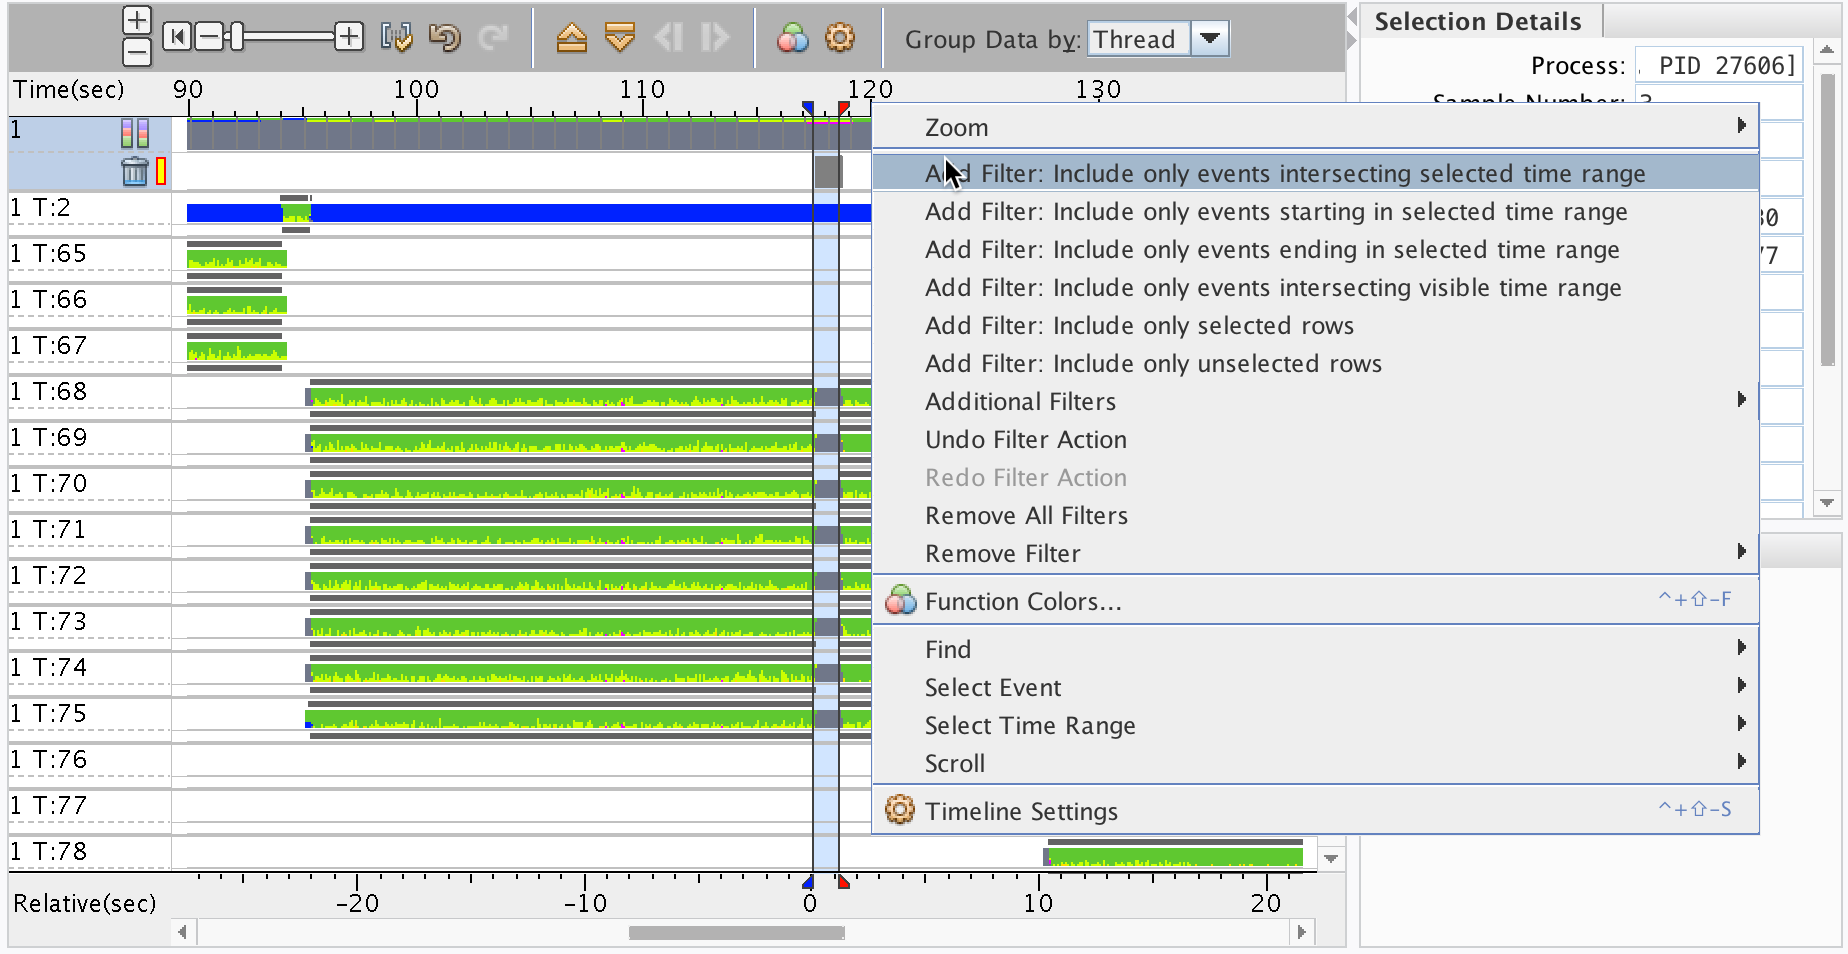
Selection of a time range can now be made from the rulers.
-
Filtering by time or row is now accessible from context menus in the rulers.
-
-
Comparing Experiments Enhancements
A new Compare panel on the Performance Analyzer main window enables you to switch between viewing the compared data in absolute, delta, and ratio modes using buttons.
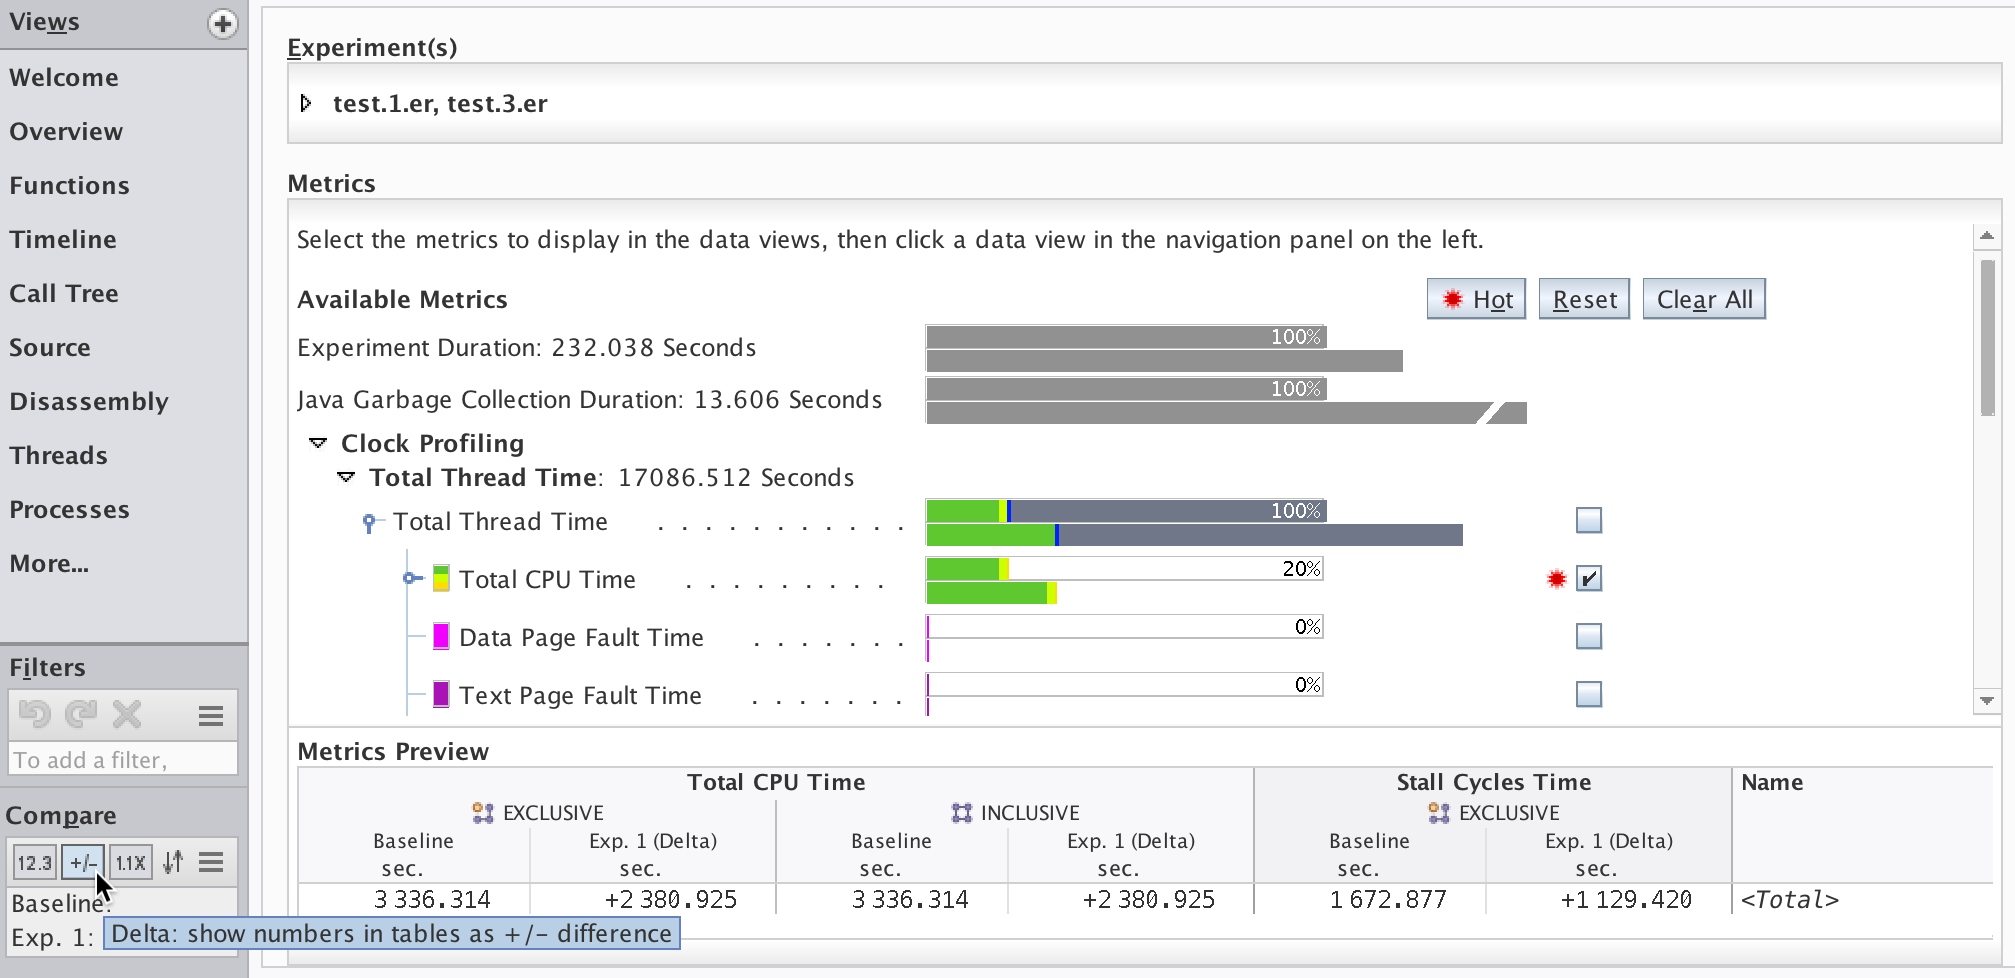
See Comparing experiments for more information.
-
Call Tree Enhancements
Call Tree view has new Copy All option that copies the calltree in text form, which you can paste into a text file.
-
Remote Analyzer Enhancements
-
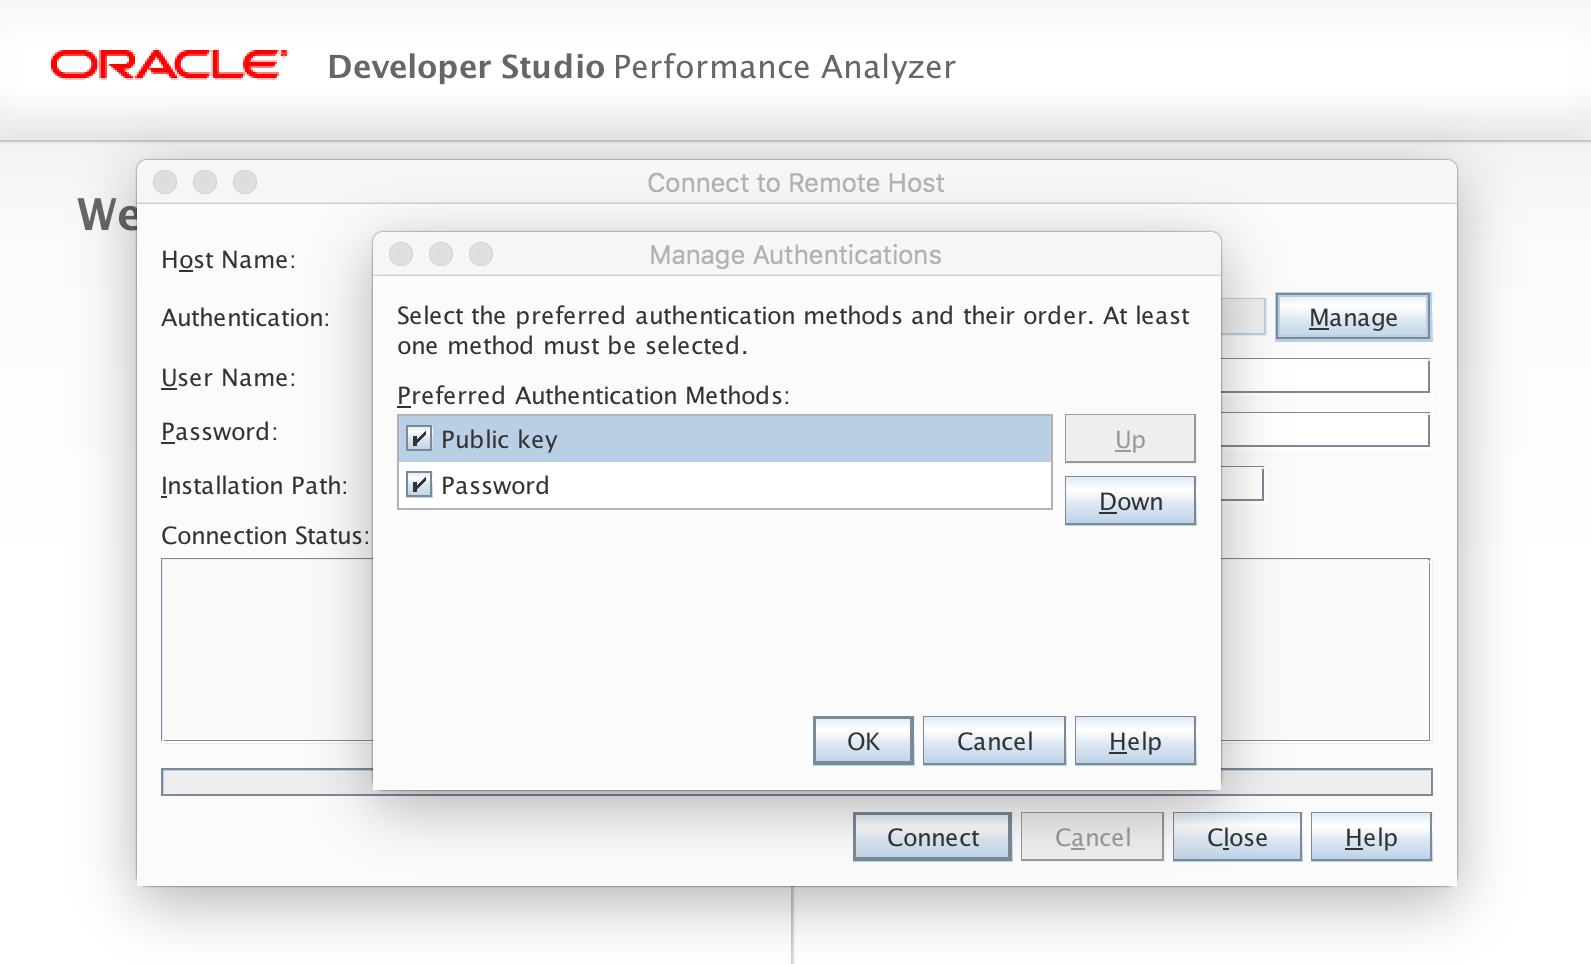
The Remote Analyzer now supports multiple authentication methods.
-
Remote Analyzer provides better error messages, and has improved performance.
-