Tools for Debugging Applications
Oracle Developer Studio includes the dbx debugger to help you detect errors in your applications.
dbx is an interactive, source-level, command-line debugging tool. You can use it to run a C, C++, or Fortran program in a controlled manner and to inspect the state of a stopped program. dbx gives you complete control of the dynamic execution of a program, including collecting performance and memory usage data, monitoring memory access, and detecting memory leaks.
-
Examine a core file from a program that has crashed
-
Set breakpoints
-
Step through your program
-
Examine the call stack
-
Evaluate variables and expressions
-
Use runtime checking to find memory access problems and memory leaks
-
Use fix-and-continue to modify and recompile a source file and continue executing without rebuilding the entire program
dbx enables you to perform the following tasks:
You can use the dbx debugger on the command line, graphically through Oracle Developer Studio IDE, or through a separate graphical interface called dbxtool.
For more information about using dbx in the different user interfaces, see the following sections:
dbx on the Command Line
The basic syntax of the dbx command to start dbx is:
dbx [options] [program-name|-] [process-ID]
To start a dbx session and load the program test to be debugged:
% dbx test
To start a dbx session and attach it to a program that is already running with the process ID 832:
% dbx - 832
When your dbx session starts, dbx loads the program information for the program you are debugging. Then dbx waits in a ready state visiting the main block of the program such as the main() function in a C or C++ program. The (dbx) command prompt is displayed.
You can type commands at the (dbx) prompt. Typically, you first set a breakpoint by typing a command such as stop in main and then type a run command to run your program:
(dbx) stop in main
(4) stop in main
(dbx) run
Running: quote_1
(process id 5685)
(dbx)
When execution stops at the breakpoint, you can type commands such as step and next to single-step through your code, and print and display to evaluate expressions and variables.
For information about the command-line options for the dbx utility, see the dbx(1) man page.
For complete information about using dbx including a command reference section, see Oracle Developer Studio 12.5: Debugging a Program with dbx. You can also learn about the dbx commands and other topics by typing help at the (dbx) command line.
For a list of the new and changed features, see What’s New in the Oracle Developer Studio 12.5 Release.
For known problems, limitations, and incompatibilities in the current release of dbx, see Oracle Developer Studio 12.5: Release Notes.
dbx in the IDE
You can use dbx in Oracle Developer Studio IDE by opening your project, creating breakpoints in the source, and clicking the Debug button. The IDE enables you to use menu options and buttons to step through your program, and provides a complete set of debugging windows.
As with building your application, the IDE debugs your application as a project. You can also use the IDE to debug executables that are not associated with an IDE project.
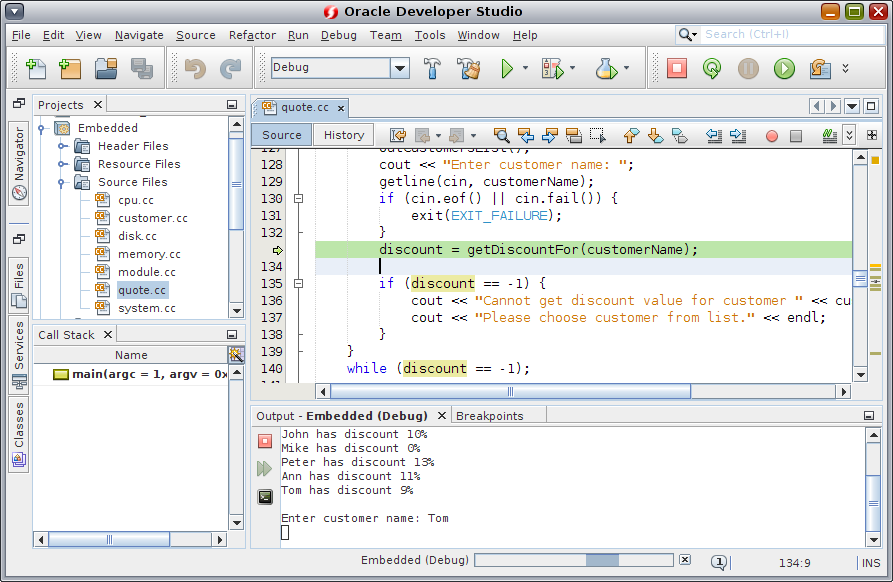
In the following screen capture, one of the IDE sample projects is running in dbx. You can use commands in the Debug menu or the buttons at the top right in the IDE window to control the debugger. As you use the Debug commands and buttons, the IDE issues commands to dbx and displays output in the various debugging windows.

In the figure , the debugger is stopped at a breakpoint and the Output window shows the program interaction. Some debugger windows such as Variables and Breakpoints are also shown but not selected. You can open more debugging windows by selecting from the Window → Debugging menu. One of the debugging windows is the Debugger Console window, which displays the interaction with dbx. You can also type commands at the (dbx) prompt in the Debugger Console window.
For more information about using dbx in the IDE, see the integrated help in the IDE and Oracle Developer Studio 12.5: IDE Quick Start Tutorial.
dbx in dbxtool
You can also use dbx through dbxtool, a graphical tool separate from the IDE, but includes similar debugging windows and an editor. Unlike the IDE, dbxtool does not use projects, and you can use it to debug any C, C++, or Fortran executable or core file.
To start dbxtool, type:
% dbxtool executable-name
You can also omit the executable name and specify it from within dbxtool instead.
As with the IDE, you can issue commands to dbx by clicking toolbar buttons or using Debug menu options in dbxtool. You can also type commands at the (dbx) prompt in the Debugger Console window.
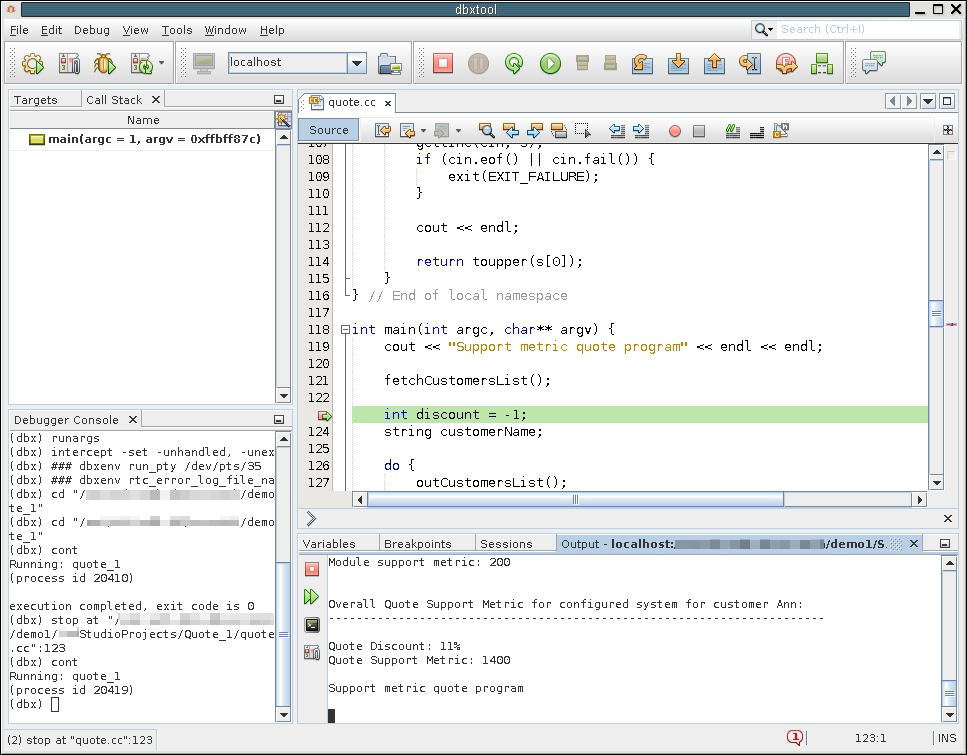
In the following figure, dbx is running in dbxtool on the quote_1 program. The Debugger Console window is selected and you can see the (dbx) prompt and commands that have been entered by dbxtool in response to the user's selections.

For information about using dbxtool, see the dbxtool(1) man page and the integrated help in dbxtool. The Oracle Developer Studio 12.5: dbxtool Tutorial shows how to use dbxtool.