Contents
- API Gateway logs and events
- Configure audit logs per domain
- Configure transaction audit log destinations
- Configure transaction audit logs per filter
- Configure transaction event logs per API Gateway
- Configure transaction access logs per path
- Manage API Gateway events and alerts
- Configure dynamic trace and log settings
- Further information
You can use the Logs and Events view in the API Gateway Manager web console to view and search API Gateway log and event files. You can configure API Gateway log and event settings in the Server Settings in Policy Studio. The Settings > Dynamic tab in API Gateway Manager also enable you to configure log settings at runtime.
This section first provides an overview of the different types of logs and events that are displayed in API Gateway Manager. This topic then explains how to configure the different types of logs and events, and shows where to find more detailed information.
The Logs view displays the following API Gateway logs for domain management and runtime diagnostics:
-
Domain Audit: Displays management changes at the API Gateway domain level (for example, updates to API Gateway configuration, topology, login, or deployment). The domain audit log is configured by default. For more details, see the section called “Configure audit logs per domain”.
-
Trace: Records detailed diagnostic and debugging information on API Gateway instance execution (for example, services starting or stopping, and messages sent through the API Gateway). The trace log is configured by default. You should submit trace log files when raising issues with Oracle Support. For more details, see Configure API Gateway diagnostic trace.
The Logs view also displays the following API Gateway logs for message transactions:
-
Transaction Audit: Records policy-level message transaction log entries generated by each filter as the message passes through the filter. You can define the transaction audit log output for each filter in Policy Studio (for example, success, failure, or abort), and configure different log output destinations. For more details, see the section called “Configure transaction audit log destinations”.
-
Transaction Access: Provides a summary of HTTP request and response message transactions in Apache HTTP Server format. You can configure the access log per API Gateway path. For more details, see the section called “Configure transaction access logs per path”.
The Events view displays in-memory events for transaction audit logs, system alerts, and SLA alerts. For more details, see the section called “Manage API Gateway events and alerts”.
The domain audit log captures management changes in the API Gateway domain that are written by the Admin Node Manager and by API Gateway instances. This includes details such as API Gateway configuration changes, log in/log out, deployments, user, or topology changes. For example, user Joe deployed a new configuration, admin user created a new group, or user Jane has read deployment data. The domain audit log is enabled by default. However, you can configure filtering options such as the number of events displayed, time interval, and event type.
For example, the displayed event types include the following:
-
Configuration
-
Service
-
Application
-
Topology
-
User store
-
Key Property Store (KPS)
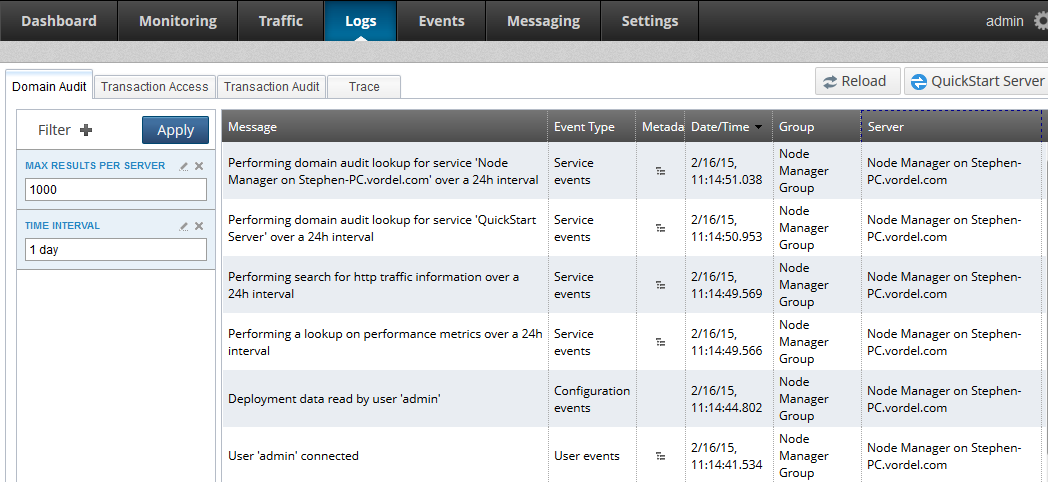
To view domain audit log events in the API Gateway Manager web console, perform the following steps:
-
In the API Gateway Manager, select Logs > Domain Audit.
-
Configure the number of events displayed in the Max results per server field on the left. Defaults to
1000. -
Configure the Time Interval for events. Defaults to
1 day. -
Click the Filter button to add more viewing options (Event Type or Groups and Servers).
-
Click Apply when finished.
Alternatively, you can view contents of the domain audit log file. For example, the following shows the file for the Admin Node Manager:
<install-dir>/apigateway/logs/audit.logFor example:
{"timestamp":1397724538713,"message":"User 'admin' connected with 3 defined user roles",
   "eventId":107,"metadata":{"userID":"admin"}}
{"timestamp":1397724539638,"message":"Deployment data read by user 'admin'","eventId":1037,
   "metadata":{}}
{"timestamp":1397726232992,"message":"Performing domain audit lookup for service
   'Node Manager on cayote.acme.com' over a 24h interval","eventId":9,"metadata":
   {"userID":"admin","serviceID":"nodemanager-1"}}
{"timestamp":1397726235233,"message":"Performing domain audit lookup for service
   'Node Manager on cayote.acme.com' over a 24h interval","eventId":9,"metadata":
   {"userID":"admin","serviceID":"nodemanager-1"}}
The default maximum size for the audit log file is 1 MB. A new file is created when the
server instance restarts. The maximum of files stored in the logs directory
is 50. When this maximum number of log files is reached, the files roll over,
and the oldest files are deleted.
You can also customize and redact the contents of the output in the logs/audit.log file.
For example, for security purposes, you can redact sensitive information, such as specific query
parameters that contain customer details, passwords, or credit card information. Alternatively, you
can prevent the file from becoming flooded with specific messages, such as GET API calls
for metrics.
You can use the following file to customize the output of the domain audit log file:
<install-dir>/apigateway/conf/apiaudit.xmlThis file enables you to specify rules to filter out sensitive details or noisy API calls. The default file contains some predefined rules (for example, filtering out metrics). You can use this file to specify whether an entry is made to the domain audit log file, and to specify the contents of the text in the output message.
For example, the following entry specifies an outputMessage for all GET
messages on the ops/setserviceconfig path:
<apiauditrule>
   <method>GET</method>
   <path>^ops/getserviceconfig$</path>
   <pathMatch>MATCHES</pathMatch>
     <queryArgs>*</queryArgs>
     <outputMessage>Update configuration for service '${serviceName}':
        ${queryArgs}</outputMessage>
</apiauditrule>
The following example specifies no outputMessage for GET messages on the
api/monitoring/metrics path:
<apiauditrule>
   <method>GET</method>
   <path>api/monitoring/metrics</path>
   <pathMatch>BEGINS_WITH</pathMatch>
</apiauditrule>
The rules in the apiaudit.xml file analyze the traffic passing through the API Gateway router
service, and control the entries in the domain audit log. These rules are checked in the order specified
in the file. The method, path and pathMatch elements determine
whether a rule is triggered. If a rule is triggered, all subsequent rules are ignored. You should specify
all rules in order of priority (for example, most sensitive or noisy first).
The domain audit rule elements are described as follows:
| Element | Description |
|---|---|
method |
Required comma-separated list of HTTP methods (GET, PUT,
and so on). Use the * wildcard to specify all methods.
|
path |
Required regular expression that specifies a URL path (for example,
^api/domainaudit/search$). Use the *
wildcard to specify all paths.
|
pathMatch |
Required path matching statement (one of the following: MATCHES,
BEGINS_WITH, ENDS_WITH, CONTAINS,
DOES_NOT_CONTAIN, IS, IS_NOT,
DOES_NOT_MATCH).
|
queryArgs |
Option to specify query string arguments output in the log. To redact certain arguments, you must explicitly list only the arguments you wish to show in a comma-separated list. Leaving this blank or omitting the element specifies that no query arguments are displayed. The * wildcard specifies that all query arguments are available for printing. |
outputMessage |
Option to specify the message output printed in the log. Leaving this blank or omitting the element means that no entry is made in the domain audit log for this rule. |
For more details and example rules, see the contents of the conf/apiaudit.xml file.
The API Gateway provides detailed transaction audit logging for specific message filters (for example, the request, time of the request, where the request was routed to, and response returned to the client). You can configure transaction logging output to a number of different destinations:
-
Text file
-
XML file
-
Database
-
Local syslog
-
Remote syslog
-
System console
Transaction audit logging is not configured by default. To configure where transaction audit log information is sent, perform the following steps:
-
In the Policy Studio tree, select Server Settings > Logging > Transaction Audit Log.
-
Specify the required settings on the appropriate tabs (for example, Text File, Database, and XML File).
-
When finished, click Apply Changes at the bottom right.
-
Click the Deploy button in the toolbar to deploy your settings to the API Gateway.
When a transaction audit log Text File destination is enabled, a text log file is written and displayed in API Gateway Manager in the Logs -> Transaction Audit view. For details on configuring all available options, see Transaction audit log settings.
You can configure the transaction audit log level and log message for a specific filter as follows:
-
In the Policy Studio tree, click any policy to display it in the canvas on the right (for example, QuickStart > Virtualized Services > REST > GetProducts.
-
Double-click a filter on the canvas to edit (for example, Connect to Heroes REST Service).
-
Click Next to display the Transaction Audit Logging Level and Message window.
-
Select Override Logging Level for this filter.
-
Select the log levels required for troubleshooting (for example, Fatal and Failure).
-
Enter any non-default log messages if required.
-
Click Finish.
-
Click the Deploy button in the toolbar to deploy your settings to the API Gateway.
You can also enable logging of the message payload in the transaction using a Log Message Payload filter in your policy, or by enabling dynamic payload logging in API Gateway Manager (see the section called “Configure dynamic trace and log settings”). When message payload logging is enabled, the transaction payload is logged to the transaction audit log destinations that are configured.
For more details on transaction audit logging for specific message filters, see the following in the API Gateway Policy Developer Guide:
-
Transaction Audit Logging Level and Message monitoring in each filter
-
Log Message Payload filter
The transaction event log provides a summary of each API Gateway transaction. These logs are persisted, and when configured, are used to generate metrics on the Monitoring tab in API Gateway Analytics.
Transaction event logging is enabled by default. To configure the transaction event log output, perform the following steps:
-
In the Policy Studio tree, select Server Settings > Logging > Transaction Event Log.
-
Specify the required settings (for example, enable API method or client monitoring).
-
When finished, click Apply Changes at the bottom right.
-
Click Deploy in the toolbar to deploy your settings to the API Gateway.
For details on configuring all the available options, see Transaction event log settings.
The access log provides summary of the HTTP request and response messages that are written to an access log file in the format used by Apache HTTP Server. For example, this includes details such as the remote hostname, user login name, and authenticated user name.
Access logging is not configured by default. To configure the access log output, perform the following steps:
-
In the Policy Studio tree, select the Server Settings > Logging > Transaction Access Log.
-
Specify the required settings (for example, file name, directory name, max files, and so on).
-
When finished, click Apply Changes at the bottom right.
-
You must also configure the access log at the service level on a specific relative path. In the Policy Studio tree, select the relative path, right-click it in the Resolvers pane, and select Edit.
-
Click the Logging Settings tab, and select Include in server access log records.
-
Click the Deploy button in the toolbar to deploy your settings to the API Gateway.
For details on configuring all the available options, see Transaction access log settings.
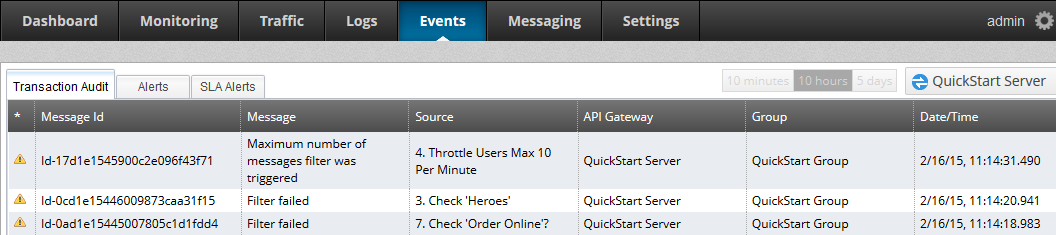
The Events view in API Gateway Manager enables you to view and search the contents of the following in-memory API Gateway events and alerts:
-
Transaction Audit: When policy-level transaction audit logging is configured in API Gateway filters, this displays an in-memory list of transaction audit log events. A transaction audit log destination does not need to be enabled for the in-memory list of events to be updated. For more details, see the section called “Configure transaction audit logs per filter”.
-
Alerts: When system Alert filters are configured in your policies, this displays an in-memory list of alert events. An alert destination does not need to be enabled for in-memory list of events to be updated. For more details, see the API Gateway Policy Developer Guide.
-
SLA Alerts: When SLA Alert filters are configured in your policies, this displays an in-memory list of Service Level Agreement (SLA) alert events. An alert destination does not need to be enabled for in-memory list of events to be updated. For more details, see the API Gateway Policy Developer Guide.
The following example shows some Transaction Audit events:
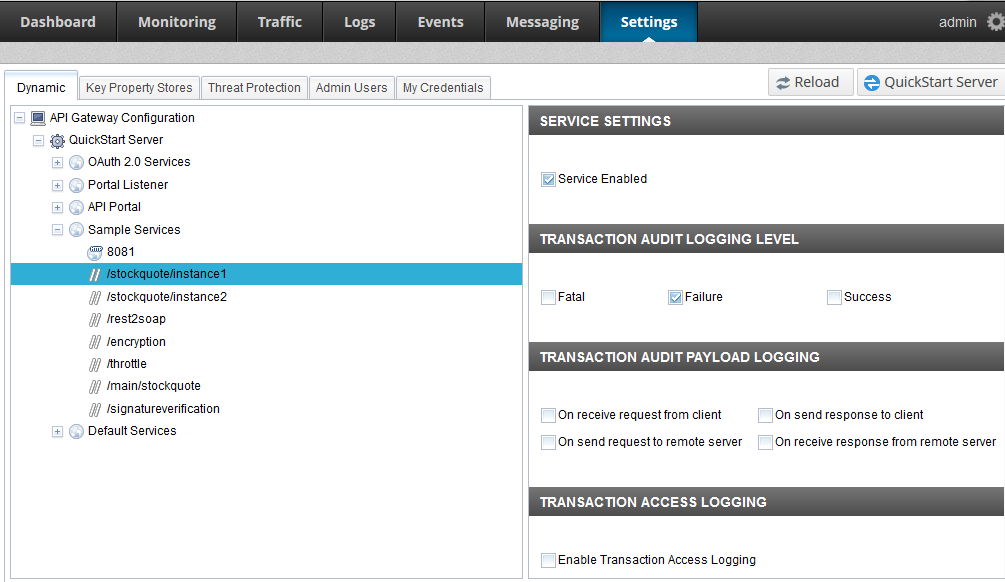
You can click the Settings > Dynamic tab in API Gateway Manager to configure dynamic trace, logging, and monitoring settings on-the-fly at runtime. These settings are dynamic because you do not need to refresh or deploy updates to the API Gateway. You can specify these settings for an API Gateway system, instance, service, interface, or path.
For example, the top-level SYSTEM SETTINGS allow you to configure logging of inbound and outbound transactions, policy paths, and message trace. You can select an HTTP interface in the tree on the left to configure the INTERFACE SETTINGS, TRAFFIC MONITORING SETTINGS, and Trace level. You can select the API Gateway instance in the tree to configure its trace level.
You can also select a relative path or service in the tree, and configure the following options:
-
SERVICE SETTINGS: Select whether the service is enabled.
-
TRANSACTION AUDIT LOGGING LEVEL: You can select from Fatal, Failure, and Success. See the Transaction Audit Logging Level and Message monitoring setting in the API Gateway Policy Developer Guide.
-
TRANSACTION AUDIT PAYLOAD LOGGING: Disabled by default. See the Log Message Payload filter in the API Gateway Policy Developer Guide.
-
TRANSACTION ACCESS LOGGING: See Transaction access log settings.
When finished, click Apply Changes at the bottom of the page.
The following example shows the dynamic settings available for a service:
For more details on real-time monitoring and traffic monitoring, see Monitor services in API Gateway Manager.
