Contents
API Gateway Analytics monitors, records, and reports on the history of message traffic between API Gateway instances and various services, remote hosts, and clients running in an API Gateway domain. You can use API Gateway Analytics to monitor traffic and perform root cause analysis at the level of the domain, API Gateway instance, service, remote host, and client. You can also filter the display based on any selected time period. For example, this defaults to the last 7 days, but you can specify any date range.
![[Note]](../common_oracle/images/admon/note.png) |
Note |
|---|---|
| This topic describes how to use the API Gateway Analytics web-based interface to monitor your domain. The Node Manager on each host must be configured to write metrics data to the same database that API Gateway Analytics reads from. The API Gateway can write to the same database for transaction audit logging if required. This topic assumes that you have already performed the steps in Configure API Gateway for API Gateway Analytics. |
To launch API Gateway Analytics, perform the following steps:
-
Start the API Gateway Analytics server using the
oaganalyticsscript in the/bindirectory of your API Gateway Analytics installation. -
Using the default port, connect to the API Gateway Analytics interface in a browser at the following URL:
http://HOST:8040/
where
HOSTpoints to the IP address or hostname of the machine on which API Gateway Analytics is installed. -
Log in using the default
adminuser with a password ofchangeme.
|
Note |
|---|---|
|
You should change the default credentials by editing your API Gateway Analytics configuration in Policy Studio under the Users and Groups tree node.
The default |
The API Gateway Analytics System view includes the following tabs:
-
Systems
-
System Resources
On the Systems tab, click a panel in the SYSTEMS section at the top to display graph for the selected system-level metrics below. For example, the available metrics include the following:
-
Successes: The number of successful messages processed in the domain (that generated a success in an API Gateway policy).
-
Failures: The number of failed messages processed in the domain (that generated a failure in an API Gateway policy).
-
Exceptions: The number of messages in the domain that generated an exception in an API Gateway policy.
-
Active: The uptime of API Gateway instances.
-
SLA breaches: The number of Service Level Agreement (SLA) breaches in the domain.
The following example shows messages successfully sent displayed in a simple domain with a single API Gateway instance:
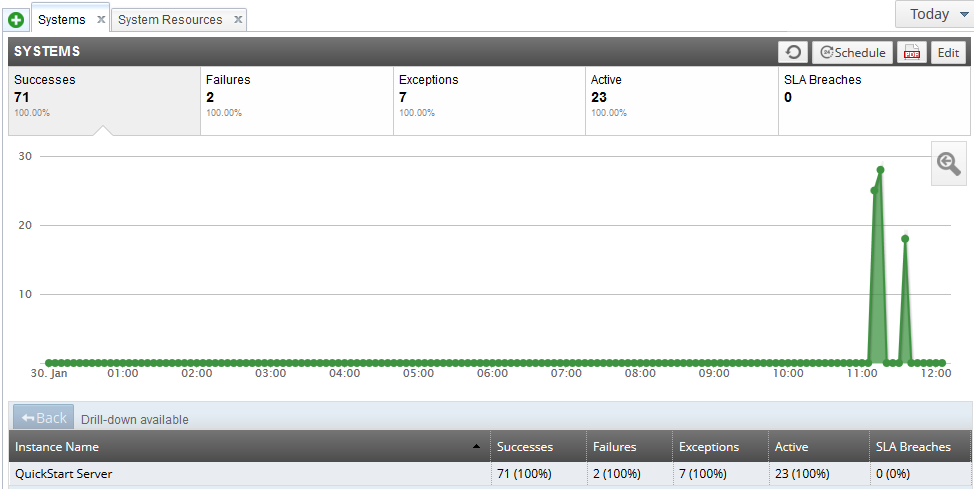
The table at the bottom shows all the API Gateway instances that are sending monitored traffic to protected services, clients, and remote hosts in your domain. You can click an API Gateway instance in the table to drill down and view graphs for the selected instance. Click Back on the left to return to the ALL SYSTEMS view.
On the System Resources tab, click a panel in the SYSTEM RESOURCES section at the top to display graph for the selected system resource metrics below. For example, the available metrics include the following:
-
Instance CPU (Avg %): Average amount of CPU used by the API Gateway instance.
-
System CPU (Avg %): Average amount of CPU used on the host machine running the API Gateway.
-
Instance Memory Used (Avg MB): Average amount of memory used by the API Gateway instance.
-
System Memory (Max MB): Maximum amount of memory used on the machine hosting the API Gateway. This includes memory used by the API Gateway and all other processes running on the machine.
-
System Memory Total (Max MB): Total amount of available memory on the machine hosting the API Gateway.
The following example shows the average system CPU displayed in a simple domain with one API Gateway instance:
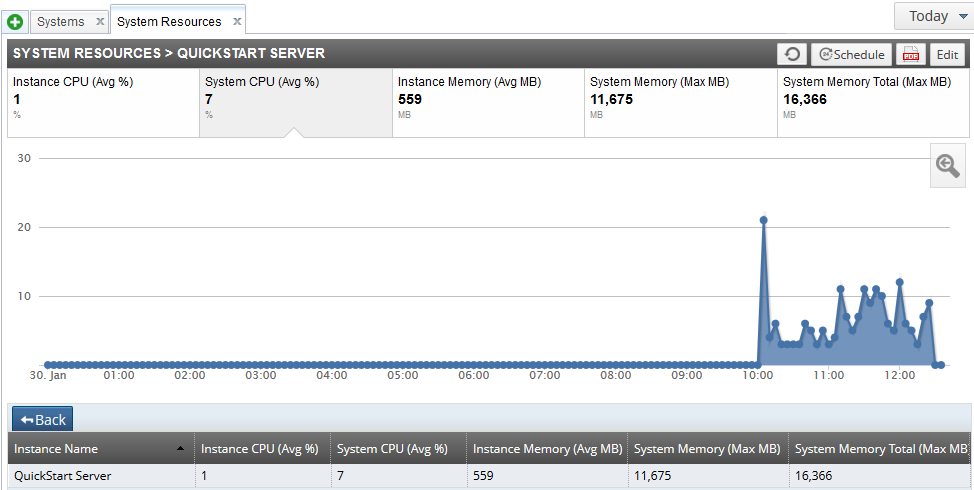
The table at the bottom shows all API Gateway instances that are sending monitored traffic to protected services, clients, and remote hosts in your domain. You can click an API Gateway instance in the table to drill down and view graphs for the selected instance. Click Back on the left to return to the SYSTEM RESOURCES view.
The API Services view shows metrics for services that are virtualized by API Gateway instances in your domain. For more details on virtualizing services, see the API Gateway Policy Developer Guide.
The API Services view includes the following tabs:
-
Load Balance: Metrics for the number of messages and processing times.
-
Clients (Service of): Metrics for the number of messages, successes, and failures.
-
Clients: Metrics for the number of messages, successes, failures, and exceptions.
-
API Services (Methods of): Metrics for the number of messages, successes, failures, and exceptions.
-
API Services (Clients of): Metrics for the number of messages, successes, failures, and exceptions.
-
API Services: Metrics for the number of messages, successes, failures, and exceptions.
-
API Service Performance: Metrics for number of messages, successes, failures, and exceptions.
For example, In the API Services > API Service Performance tab, click a panel in the API SERVICE PERFORMANCE section at the top to display a graph for the selected service-level metric below. For example, the available metrics include the following:
-
Messages: The number of API service messages processed in the API Gateway domain.
-
Processing Time (Min ms): The minimum time taken to process a message, including all calls to remote servers.
-
Processing Time (Max ms): The maximum time taken to process a message, including all calls to remote servers.
-
Processing Time (Avg ms): The average time taken to process a message, including all calls to remote servers.
The following example shows the maximum processing time in a simple domain with multiple API services:
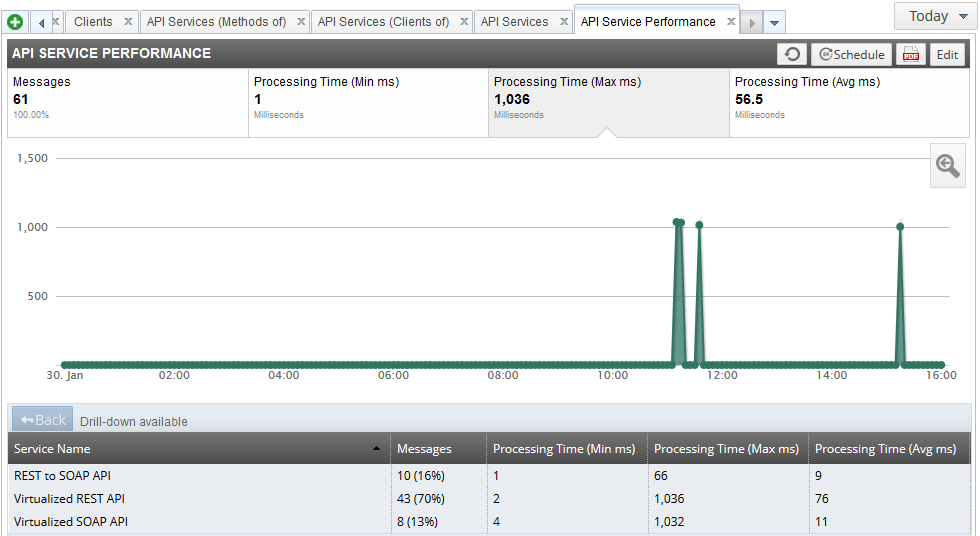
The table at the bottom shows all services protected by API Gateway instances in your domain. You can click a service in the table to drill down and view graphs for the selected service. Click Back on the left to return to the API SERVICE PERFORMANCE view.
|
Note |
|---|---|
|
A service must first have been sent a message before it is displayed in the API Services view. |
The Remote Hosts view displays metrics for all the remote hosts that have been configured in your domain. It shows details such as the number of message transactions that have been sent to this remote host, together with the total number of bytes sent to and received from this host.
In the Remote Hosts view, click a panel in the REMOTE HOSTS section at the top to display graph for the selected remote host metric below. For example, the available metrics include the following:
-
Transactions: The number of message transactions to remote hosts.
-
Volume Bytes (In): The total number of bytes sent to remote hosts.
-
Volume Bytes (Out): The total number of bytes received from remote hosts.
-
Response Time (Avg ms): The average response time to remote hosts.
The following example shows the total number of bytes sent to remote hosts:
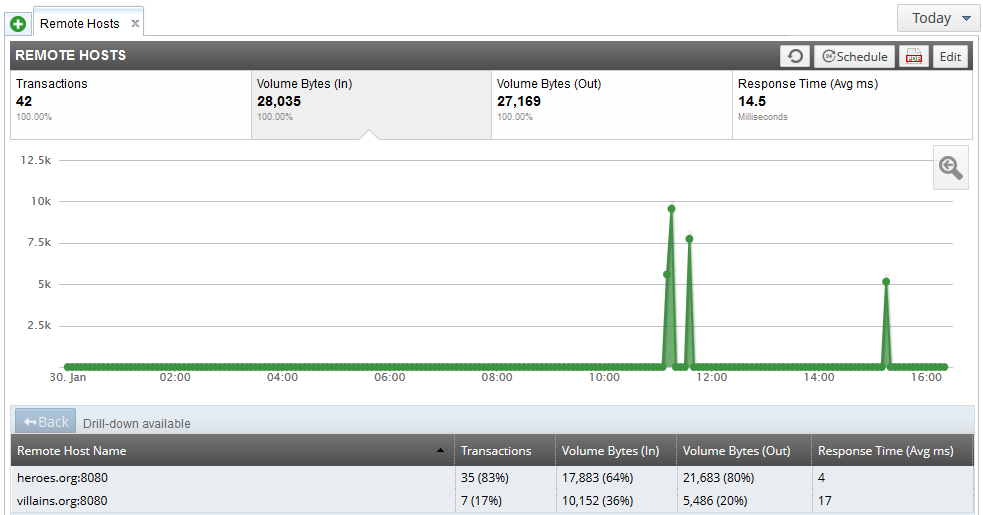
The table at the bottom shows all the remote hosts connected to by API Gateway instances in your domain. You can click a remote host in the table to drill down and view graphs for the selected remote host. Click Back on the left to return to the REMOTE HOSTS view.
The Protocols view enables you to monitor the different message protocols in your domain (for example, HTTP, Websocket, JMS, File Transfer, and so on). Click a panel in the INBOUND PROTOCOLS section at the top to display graph for the selected protocol metrics below. For example, the available metrics include the following:
-
Successes: The number of successful messages that are processed in the domain.
-
Failures: The number of failed messages that are processed in the domain.
-
Exceptions: The number of messages that generated an exception in an API Gateway policy.
The following example shows the number of HTTP messages that generated an exception in the domain:
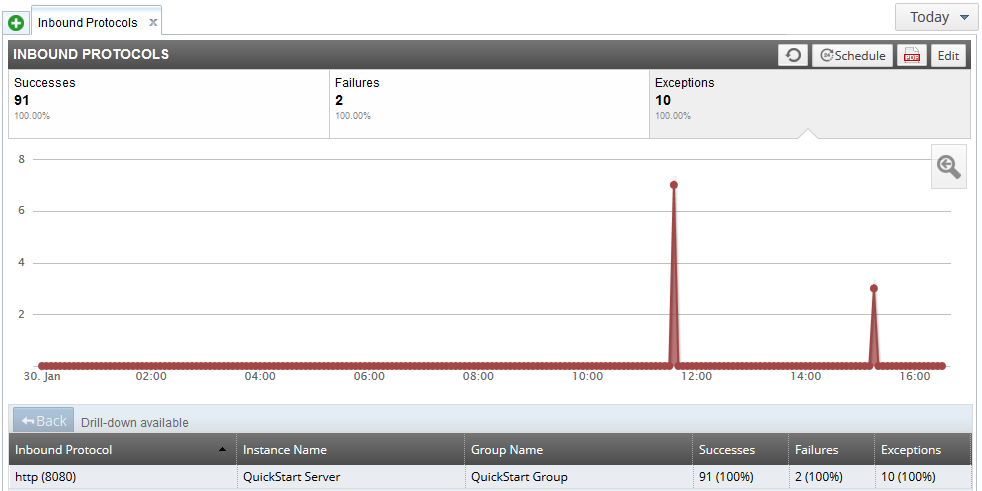
The table at the bottom shows all the protocols used by API Gateway instances in your domain. You can click a protocol in the table to drill down and view graphs for the selected protocol (for example, http 8080). Click Back on the left to return to the INBOUND PROTOCOLS view.
The Transaction Audit Log view enables you to filter the transaction audit log messages messages generated by API Gateway instances in your domain. For example:
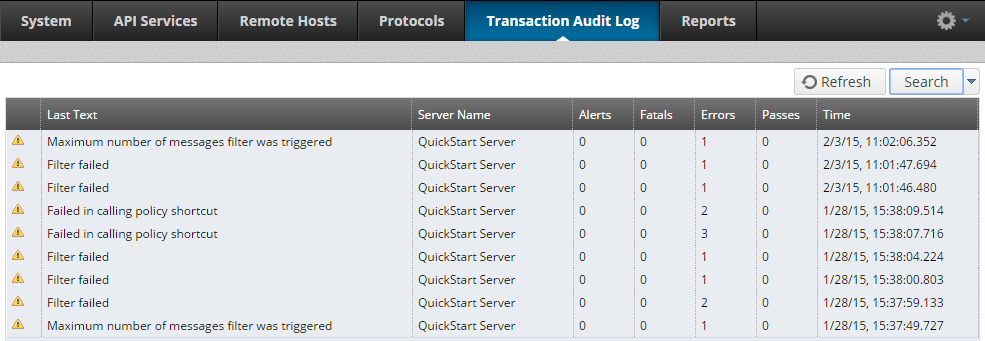
You can filter the log messages by clicking the Search button on the right in the toolbar. The Query Editor dialog enables you to create a query to filter log messages by details such as time period, severity level, filter type or name, and message text. When you have added your search criteria, click Search at the bottom to run the query. You can also save the query for later use.
When you click Search, the log messages that match the search criteria specified in the query are displayed in the table. For example, the details displayed in the table include the log message text, API Gateway name, alerts, and time. You can also double-click an item in the list for more details (for example, transaction ID, filter category, and filter name).
![[Important]](../common_oracle/images/admon/important.png) |
Important |
|---|---|
| To view data in the Transaction Audit Log tab, you must configure the API Gateway to write to the metrics database. In the Policy Studio tree, select Server Settings > Logging > Transaction Audit Log > Database. For more details, see Transaction audit log settings |
API Gateway Analytics uses message metrics stored in a centralized metrics database by the Node Managers running in your domain. The Node Managers store metrics for the virtualized services exposed by the local API Gateway instances, and for the services, clients, and remote host connections that they protect.
API Gateway Analytics can generate usage reports and charts based on the stored metrics data, and enables you to configure custom reports to suit the needs of your environment. This includes viewing available metrics for each target report type, grouping and filtering metrics, and what to display on drill through.
In the System, API Services, Remote Hosts, and Protocols views, you can create reports by clicking Schedule on the right in the toolbar. For example, to generate reports on API Service clients, perform the following steps:
-
Click the API Services > Clients view.
-
Click Edit on the right in the toolbar to specify the report settings:
-
Name: Defaults to the tab name (for example, Clients).
-
Group by: Select how the report is displayed (for example, by Client Name, Instance Name, and so on). You can also select the metrics that are displayed (for example, Messages, Successes, and so on).
-
Filter by: Select condition options to filter the display (for example, only show entries with a specific Client Name).
-
Enable drill-down: Select this to use the value of the Group by columns to provide an additional drill-down report. You can choose to group by additional fields. This is enabled by default.
These filtering and grouping mechanisms enable you to answer questions such as what clients used an API Service, or which API services were used by a client. For example, to show clients that used
Service1, you can create a custom report that groups by Client Name and filters where Service Name isService1.Note The group-by mechanism only applies to the data table below the report chart. The chart remains the same. -
-
Click Save in the toolbar.
-
Click Schedule in the toolbar.
-
You can also click the PDF button in the toolbar to generate a PDF version of the report.
You can follow a similar sequence of steps to generate reports in the System, Remote Hosts, and Protocols views.
Alternatively, you can create a report in the Reports view. Perform the following steps:
-
Click New report on the left in the toolbar.
-
Enter the report Name in the dialog.
-
Select the report Type, and click OK.
-
Configure the schedule and output options on the right as appropriate. Defaults to PDF output daily at 9am, starting from today.
-
Click Apply to save your settings.
-
Click Create to create the report.
The following example shows a custom report grouped by Service Name:
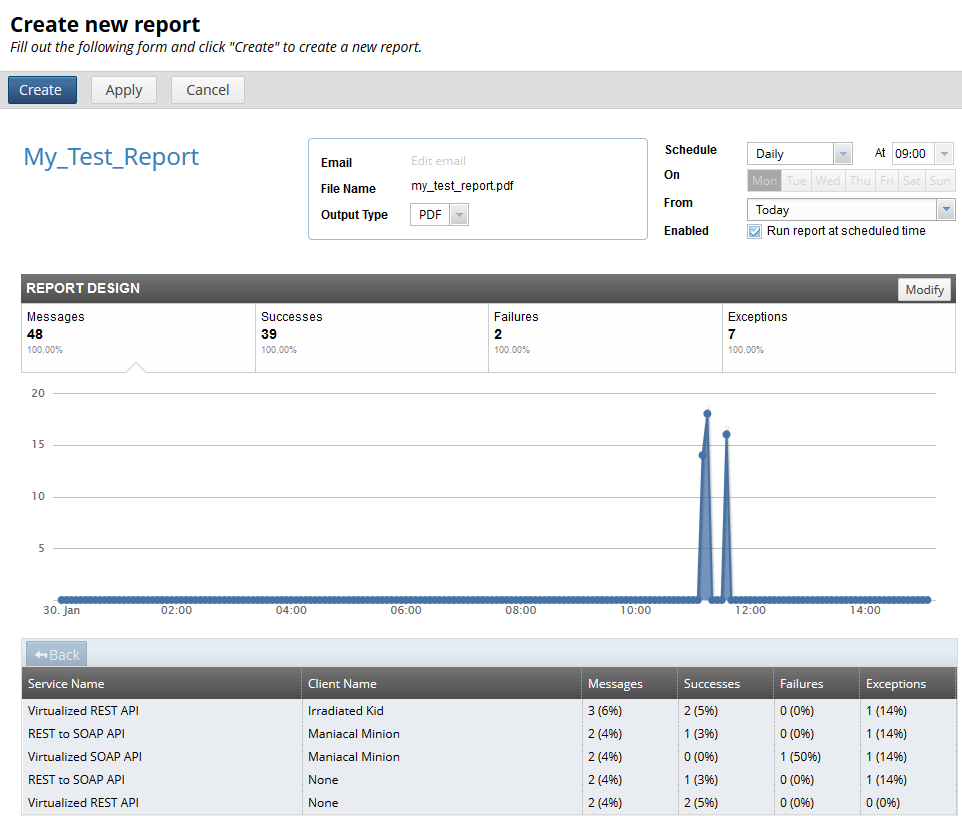
When you have created a report, you can select it in list on the Managing Reports page, and click Generate now. Alternatively, click Delete to remove the report from the list.
For more details, see the following:
-
API Gateway Installation Guide
