This section discusses the relationship between the amount of RAM, the Dgraph process's use of virtual memory, the Dgraph cache, the working set size (WSS), and the resident set size (RSS) for the Dgraph process and their effect on performance.
In general, storing information on disk, instead of in memory, increases disk activity, which slows down the server. Although all the information the MDEX Engine may need is stored on disk, the running MDEX Engine attempts to store in memory as many as possible of the structures that it currently needs.
The decisions on what to keep in memory at any given time are based on which parts of the Dgraph are most frequently used. This affects the resident set size and the working set size of the running Dgraph, which, as they increase, lead to the increase of RAM being consumed.
Related links
The Dgraph performs best when the working set of its process fits in RAM without swapping memory pages to disk.
The working set of the Dgraph process is a collection of pages in the virtual address space of the process that is resident in physical memory. The pages in the working set have been most recently and frequently referenced. In other words, the Dgraph working set is the amount of memory a Dgraph process is consuming now. This is the amount of memory that is needed to avoid paging.
In general, depending on the query load, the virtual memory process size of the Dgraph fluctuates. In some cases, it can exceed physical memory to a degree without affecting performance.
The section “Dgraph virtual memory vs. RAM: use cases” illustrates these statements.
Many factors affect the amount of memory needed by the Dgraph process. The number of records in the source data and their complexity are the most important factors, but the use of almost any feature will cause some increase in RAM use.
The amount of memory needed for the Dgraph process also depends on other aspects of the query mix, such as which of the items that typically constitute Guided Navigation are being used and requested (records, dimensions, refinements, or other), and their particular use in the query mix.
Use the following recommendations to measure memory and optimize its use for best performance.
Periodically measure the virtual memory process size of the MDEX Engine and its resident set size. The goal for these tests is to check whether the working set size (WSS) of the MDEX Engine starts to significantly exceed physical memory (it may exceed physical memory to a degree). The WSS cannot be computed, although it is always less than or equal to the amount of virtual process size for the MDEX Engine.
Determine the WSS experimentally: if you notice that increasing RSS (by adding RAM or subtracting competing processes) improves performance of the MDEX Engine, this means that the WSS was previously larger than the RSS. This was likely the cause of the performance degradation.
If the size of the WSS grows too close to the amount of RAM, or starts to exceed it, paging to disk begins and you will notice rapid decreases in performance.
The most noticeable symptom of paging is a large increase in Dgraph query latency. For a list of tools commonly used for measuring the amount of paging, see “Useful Third-Party Tools” in this guide.
While the amount of virtual memory consumed by the Dgraph process may grow and even exceed RAM at times, it is important for performance reasons that the working set size of the Dgraph process not exceed RAM.
The following diagram illustrates this relationship:
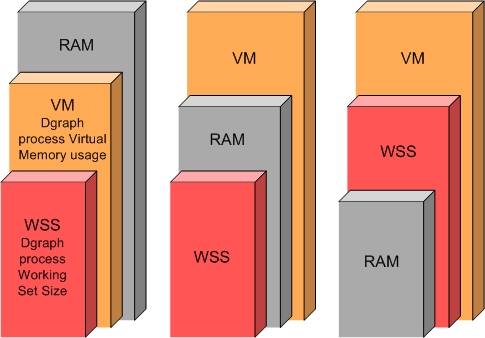
In this diagram:
The diagram illustrates three distinct use cases:
Typical operation with normal memory saturation. The graph on the left side illustrates the case where the amount of virtual memory used by the Dgraph process completely fits into RAM and thus the working set size of the Dgraph process also fits into RAM. This is a standard situation under which the Dgraph maintains its best performance.
Typical operation in an out-of-memory situation. The graph in the middle illustrates the case where, while the amount of virtual memory exceeds RAM, the working set size of the Dgraph process fits into RAM. In this case, the Dgraph also maintains its optimal performance.
Potentially I/O bound operation with poor performance where WSS starts to exceed RAM. The graph on the right side illustrates a situation that you should avoid. In this case, both the amount of virtual memory consumed by the Dgraph and the working set size of the Dgraph exceed RAM. Two situations are possible in this scenario that are of particular interest to you: the WSS can start to exceed RAM mildly or significantly. Subsequently, the degradation in I/O performance can also be mild or significant. Identify the level of I/O performance that is acceptable to your implementation. Depending on the acceptable I/O performance, you can decide whether you need to address the situation with WSS exceeding RAM. In general, if WSS starts to considerably exceed RAM, this causes Dgraph performance to drop dramatically.
This section describes several ways to correct paging or out-of-memory problems with the Dgraph process.
Add more RAM to the server hosting a single Dgraph or multiple Dgraphs. This is the simplest solution to paging issues with the Dgraph. If multiple Dgraphs are sharing a machine, you can spread them out over a larger number of machines, thus giving each Dgraph a larger share of RAM. This solution has limits based on your hardware capabilities.
In addition, you can take a conservative approach, and add additional RAM in cases where the Dgraph memory consumption (WSS) approaches the amount of RAM available for the Dgraph, but does not exceed it yet. In such cases, while additional RAM may not be necessary to create an environment free of I/O contention, it provides a buffer and ensures that memory is available when needed.
Defragment the file system periodically. This can alleviate performance problems.
Consider tuning the
read_ahead_kbkernel parameter on Linux. For example, a large data scale implementation that is operating out of memory can be a candidate for tuning this parameter.Explore how you use features such as wildcard search, multi-assign for dimensions, and others.
Related links
The MDEX Engine cache (or the Dgraph cache) is a storage area in memory that the Dgraph uses to dynamically save potentially useful data structures, such as partial and complete results of processing queries.
Since the Dgraph has direct access to the structures that it needs, it does not need to repeat the computational work previously done. The structures that are chosen for storing enable the Dgraph to answer queries faster by using fewer server resources.
The Dgraph cache is unified and adaptive:
Dgraph uses a single cache, which stores data structures of all types. All threads share this cache.
The cache evicts data structures that it finds no longer useful. Its eviction algorithm rates the usefulness of each cache object based on your current data and your visitors’ current queries. When this information changes, the Dgraph cache detects the change and adjusts, but you do not have to retune it.
The default Dgraph cache size (specified by the
--cmem flag) is 1024MB (1GB).
The Dgraph cache improves both throughput and latency by taking advantage of similarities between processed queries. When a query is processed, the Dgraph checks to see whether processing time can be saved by looking up the results of some or all of the query computation from an earlier query.
The Dgraph cache is used to dynamically cache query results as well as partial or intermediate results. For example, if you perform a text search query the result is stored, if it was not already, in the cache. If you then refine the results by selecting a dimension value, your original text search query is augmented with a refinement. It is likely that the Dgraph can take advantage of the cached text search result from your original query and avoid recomputing that result. If the navigation refinement result is also in the cache, the Engine does not need to do that work either.
To a large extent, the contents of the Dgraph cache are self-adjusting: what information is saved there and how long it is kept is decided automatically.
However, when deploying a Dgraph you need to decide how much memory to allocate for the Dgraph cache.
Allocating more memory to the cache improves performance by increasing the amount of information that can be stored in it. Thus, this information does not have to be recomputed.
Your MDEX Engine is well-tuned only when the Dgraph cache and the file system cache are well-balanced; therefore you need to understand them both.
The file system (FS) cache is a mechanism that the operating system use to speed up read and write to disk operations.
FS caching is beneficial to the MDEX Engine, and it is important to tune the file system cache and the Dgraph cache on the server that runs the Dgraph.
For example, read acceleration is the aspect of the FS cache that has the greatest influence on the performance of the MDEX Engine. The FS cache speeds up reads by holding recently accessed information in RAM (because your process will need this data again), and by proactively reading ahead beyond the area recently accessed and holding that information in RAM too (because your process will probably ask for that data next).
Related links
In some cases, you will not have enough memory to maximize both the FS cache and the Dgraph cache – for example, when you are operating at large data scale. In such cases, you must allocate memory between internal Dgraph cache and FS cache, because you do not have enough memory to maximize both. No general rule for allocating memory in these cases exists, however; you must determine the best way to allocate it experimentally.
Use the following practices for optimizing the Dgraph and the file system caches for best performance:
Examine the Cache tab of the MDEX Engine Stats page, especially if you need to tune the cache. In particular, pay attention to these columns in the Cache tab:
“Number of rejections”. Examining this column is useful if you want to see whether you need to increase the amount of disk space used for the MDEX cache. Counts greater than zero in the "Number of rejections" column indicate that the cache is undersized and you may want to increase it.
“Number of reinsertions”. Examining this column is useful if you want to examine your queries for similarities and improve performance by considering the redesign of the front-end application. Large counts in the "Number of reinsertions" column indicate that simultaneous queries are computing the same values, and it may be possible to improve performance by sequencing queries, if the application design permits.
"Total reinsertion time". Examining this column is useful for quantifying the overall performance impact of queries that contribute to the "Number of reinsertions" column. This column represents the aggregated time that has been spent calculating identical results in parallel with other queries. This is the amount of compute time that potentially can be saved by sequencing queries in a re-design of the front-end application.
Experiment and increase the size of the Dgraph cache as your hardware allows. However, do not set the Dgraph cache to use all the free memory available on your server, because you also need to allocate memory for the file system cache and query working memory.
Use the Dgraph
--cmemflag to tune the Dgraph cache experimentally. It specifies the size of the cache in megabytes of RAM, and is the major mechanism for tuning the Dgraph cache. By default, if--cmemis not specified, the size of the cache is 1024MB (1GB) for the Dgraph.If you have unused physical memory, you can try improving the performance of the MDEX engine by increasing cache size. When the MDEX Engine obtains extra memory for its cache, the cache algorithm identifies the best strategy for storing the most useful data structures and for evicting those structures that are less likely to be needed frequently.
For a specific MDEX Engine on any server, find the point of best performance experimentally:
Gradually increase the size of the Dgraph cache until it no longer improves performance. When performance stops improving and starts degrading, you have increased cache too much.
Back off the Dgraph cache setting by a fair amount (such as 500MB). The right answer depends on both raw data size and some subtle characteristics of the workload (such as, how much disk-backed information the average query needs, and how similar or different queries are from each other).
Review your query mix to see if it exhibits a high degree of similarity between queries (either because of a highly constrained user interface or a highly homogeneous user base). This is one of the cases where performance improvements from a larger Dgraph cache may not be noticeable. If all your queries are similar, a large Dgraph cache is unlikely to be valuable.
Find the right balance between the Dgraph cache and the FS cache. When tuning the size of the Dgraph cache, ensure that you do not accidentally displace the amount of memory allocated to the FS cache.
In general, the Dgraph cache may contain a slightly larger number of objects useful to the Dgraph than the FS cache. This is often beneficial to Dgraph performance. However, this causes a significant performance degradation when information that is not in the FS cache is needed. This is because real disk access (not just access to the FS cache reads from RAM) will be needed more often, and disk reads are significantly slower than reads from the FS cache.
Be aware of the paging situation when you experimentally determine the best strategy for allocating RAM to the Dgraph internal cache and the file system cache.
If you increase the Dgraph cache size in large increments between experiments, the Dgraph process memory (including the Dgraph cache) may no longer not fit into physical RAM. In this situation not only there is not enough room for the FS cache, but the Dgraph process starts paging and its performance degrades significantly.
As your hardware permits, experiment with increasing the FS cache, along with the Dgraph cache. In general, performance gains from using the FS cache vary depending on the processes that you are running and what they are doing with the disk.
For information on the file system caching mechanism, refer to the online sources of information that are specific to your operating system and the file system that you use.
You can improve the performance of a Dgraph by warming the
internal Dgraph cache after an update has been processed. To warm the cache,
you specify the
--warmupseconds <seconds> flag to the Dgraph.
The
--warmupseconds flag instructs the Dgraph to store a
sample of client queries, and after an update is processed, the Dgraph
internally re-runs a sample of those queries to warm the cache before
processing external queries using the updated data. The warming queries run for
the
<seconds> value that you specify.
During the period of time that the cache is warming, the Dgraph
continues to serve incoming queries against the current data set. The Dgraph
begins using the updated data as soon as the warming period is over. In other
words, the amount of time needed to process an update is increased by the
number of seconds you specify for
--warmupseconds.
In the Dgraph request log, all warming query URLs are tagged with the
additional parameter
&log=warming as a convenience to identify the log
entries produced by warming queries.
The amount of memory allocated to the Dgraph cache directly affects the virtual process size of the Dgraph. An example in this topic shows how to adjust the Dgraph cache.
Furthermore, since the cache is accessed frequently, the amount of virtual memory allocated to it affects the working set size of the Dgraph. This may cause virtual memory paging, which can adversely affect throughput and especially the maximum latency. Whether this is a problem depends on your deployment scenario.
Consider a scenario where a single Dgraph runs on a machine with 8GB of physical memory:
If the virtual process size of the Dgraph is 6GB with a default (1GB) Dgraph cache, and the machine is not being used for any other processes, it makes sense to experiment with increasing the Dgraph cache size to 2.5GB to improve performance. The resulting 8.5GB virtual process size will not cause undue memory pressure.
If the virtual process size of the Dgraph is 9GB, this exceeds the amount of RAM (8GB) and creates significant memory pressure. However, it may still make sense to increase the Dgraph cache size above the default, if the increase is not aggressive. Although in such a situation, increasing the cache size further will slow down those queries that are not assisted by the Dgraph cache, that may be acceptable if the effect of speeding up queries by providing a larger cache is greater than the effect of slowing down queries by causing virtual memory paging.
To make the right trade-off in this situation, increase the cache size while watching throughput, average latency, and maximum latency. At some point you will see that throughput is improving but average latency has gotten worse. Whether you are willing to trade latency degradation for throughput improvement will depend on the specific performance numbers, on your application, and on the expectations of your users.
This topic provides recommendations for estimating the requirements for physical memory for an Oracle Commerce Guided Search 6.1.x system given the anticipated growth of your data set.
The size of the Dgraph process is impacted by:
Each of these areas is discussed below in a separate section.
Use
--cmem to identify (or change) the Dgraph cache, and
take it into account when estimating the projected amount of RAM needed for the
MDEX Engine operations in view of the projected growth of the data set.
Partial updates can have a significant impact on RSS and WSS. The precise details of the generation merging strategy are complex and proprietary. However, the rough pattern of memory usage that you can expect to see from a Dgraph running with partial updates is as follows:
Expect a jump in address space usage each time a partial update is applied. The size of the jump depends on the size of the update. Each partial update causes one or more index generation files to be created.
When merges of partial update generations occur, the MDEX Engine allocates space for a new generation file and merges two or more existing generations into that new generation file. This allocation causes a spike in the address space usage. Since some of the merged operations may cancel each other (for example, adding a record in generation file N is canceled by the deletion of that record in generation file N+1), the new total generation size may be smaller after the partial merge.
Additionally, when full generation merges occur, all existing generations are merged into a single new generation file. Since the new generation file is roughly the same size as the sum of all pre-existing generation files (minus any canceled operations), the WSS roughly doubles during this period.
While a full merge may cause the WSS to increase significantly, the effects on WSS are muted by the paging behavior of the operating system. Based on Oracle's recommendations, it is unnecessary for an MDEX Engine server to have a quantity of RAM equal to twice the generation file sizes when partial or full merge is occurring.
It is fairly easy to detect the occurrence of a full merge. Watch the generations directory, found in
<dgidx_output>/, and notice when the number of generation files drops to 1.<dataset_prefix>_indexes/generationsDuring this testing, push enough of partial updates through the system to trigger the full merge. This will provide you with a good enough estimate of how much RAM you need for handling partial updates.
Note
Beginning with version 6.1.4 of the MDEX Engine, you can set the partial updates merges to use a balanced or aggressive merge strategy. For details on the merge policy, see the MDEX Engine Partial Updates Guide.
When measuring WSS, account for the sorting strategies used by the MDEX Engine. To ensure that you measure the full "eventual" WSS of the Dgraph in 6.1.x, include a wide range of queries in your testing logs, ensuring that a portion of your queries utilizes sorting strategies, including precomputed sorts.
Note
You can confirm whether your sorting queries utilize precomputed
sort by checking whether any of your properties is configured in Developer
Studio so that it can be used for record sort, or by checking the
<RECORD_SORT_CONFIG> element in your
application's XML configuration files. This element lists properties that are
configured to use precomputed sort. Precomputed sort techniques may be used by
the MDEX Engine in the default sort queries. Therefore, to verify whether any
of your sorting queries use precomputed sort, you can check the
Index Preparation Tab of the Stats page that
contains
Precomputed Sorts statistics. This metric
displays how much time the Dgraph has spent computing sorts, including
computing sorts and incremental sort updates.
In addition to the types of impact that are already listed in this topic, other factors, such as in-flight processing and data can have an effect on WSS. These factors cannot be measured directly, but you should be aware of their effect.
To estimate projected requirements for physical memory for an Endeca 6.1.x system, use the following recommendations:
Measure RSS. Perform evaluations of your average resident set size for your indexes, and peak resident set size, while noting the record set size on disk. For example, you may find it useful to identify various ratios between average record size on disk, average resident set size of your indexes, and peak resident set size. For testing these numbers, employ tests with varying levels of request activity sent to the Dgraph. For example, send a considerable number of requests to the 6.1.x MDEX Engine with periodic cache flushes to force the Dgraph to go to memory or disk as needed to fulfill some of the requests (this is true if you replay request logs for your test).
If your implementation uses partial updates, account for this fact in your MDEX Engine testing. Include in your tests large enough files that contain records which will be updated through partial updates. For more information, see the section in this topic on Impact of partial updates on RSS.
Similarly, account for the size of the Dgraph cache, for sorting queries that utilize precomputed sorts, and for the size of in-flight data (see sections in this topic on each of these aspects of the RSS).
Identify the ratio of the RSS to on-disk representation of the record set, and confirm that with different tests this ratio remains the same.
Based on these evaluations, draw conclusions and identify the following numbers:
The average on-disk record set size and the largest on-disk record set size.
The peak resident set size observed with the current record set.
Note
If you are not using partial updates, this number could be roughly equivalent to the on-disk representation of the MDEX Engine data plus the size of the cache for each of your Dgraphs, the size of the in-flight processing and data, and the fact whether precomputed sort is being used. If you are using partial updates, see a section in this topic for their impact on WSS and RSS.
Using these recommendations, you can identify the following numbers for the MDEX Engine 6.1.x:
Predict the growth of the RSS that you will need. You can do so based on the projected growth of the on-disk representation of the data set and the numbers that you obtain for the peak resident size, peak virtual memory usage and their ratios to your data set size.
Once you predict the growth of the resident set size, you can estimate memory requirements for your Guided Search implementation. This will make it possible to provision enough hardware to support the MDEX Engines with the projected data set growth.
