10 Monitoring Operations Support Systems
This chapter describes how to monitor the Oracle Communications operations support systems (OSS) by using the home pages provided by Oracle Application Management Pack for Oracle Communications.
About Monitoring Operations Support Systems
Operations support systems include Oracle Communications Order and Service Management (OSM), Oracle Communications Unified Inventory Management (UIM), and Oracle Communications ASAP.
Application Management Pack for Oracle Communications enables monitoring OSS targets using Oracle Enterprise Manager Cloud Control. A Management Agent monitors targets for collection items and metrics and sends the data to the Management Server for presentation.
You must install and deploy the Application Management Pack for Oracle Communications plug-in on both your Management Server and host agents before monitoring OSS targets.
You can monitor the following operations support system target types:
-
Communications suite: The home pages for communications suite targets display information about all of the applications that make up the suite. See "About the Monitoring Home Page for Communications Suite Targets".
-
OSM System: The home pages for OSM System targets display information about all of the OSM nodes that make up the system. See "About the Monitoring Home Page for OSM System Targets".
-
The following OSS application target types:
-
OSM Node: The home pages for OSM node targets display information about the individual OSM nodes.
-
UIM: The home pages for UIM targets display information about the individual UIM nodes.
-
ASAP: The home pages for ASAP targets display information about the individual ASAP nodes.
See "About the Monitoring Home Page for OSS Application Targets".
-
See the following chapters for information about setting up Oracle Communications application monitoring with Enterprise Manager Cloud Control:
About the Monitoring Home Page for Communications Suite Targets
The home page for a communications suite target displays metrics data that you can use to monitor the health of your suite and identify problems. See "Viewing Home Pages" for information about accessing communications suite home pages. You can also view the suite's configuration topology as described in "Viewing Topology".
Table 10-1 describes the regions on the home page for communications suite targets.
Table 10-1 Regions on the Communications Suite Home Page
| Region | Description |
|---|---|
|
General |
Lists the managed servers for OSM, ASAP, and UIM. |
|
Suite Availability |
Displays the percentage of managed servers that are available. |
|
Suite Managed Servers |
Displays information about each managed server representing a node in the suite. Information includes the target name, the server status, the host, port, and server name, the number of alerts for the node, and links to the node home page and external application page. |
|
Metric Alerts |
Displays any metrics alerts for the targets in the suite. |
|
Quick Links |
Provides links to related Enterprise Manager Cloud Control pages. |
|
Host Performance Data |
Displays performance information including CPU and memory usage. |
|
Order Metrics |
Displays information about order throughput, states, size, and the number of order failures. This region is identical to the Order Metrics region on the OSM system home page. See "About the Order Metrics Region". |
Configuring Monitoring Credentials for Displaying Host Performance Data
If the graph for a host in the Host Performance region of the Comms Suite target home page displays an error message, you may need to configure the monitoring credentials for that host.
To configure the monitoring credentials:
-
Log in to the Enterprise Manager Cloud Control administration console as a privileged user.
-
Click Targets, and then All Targets.
-
In the Target Type tree, select the OSM node, ASAP, or UIM target type.
-
In the list of targets, right-click the OSM, ASAP, or UIM target deployed on the host for which the error message is displayed.
-
From the context menu, select Target Setup, and then Monitoring Configuration.
-
In the Hostname field, do one of the following:
-
If the field contains an IP address, such as 192.0.2.1, but the name of the Comms Suite target contains a host name, such as osshost1.example.com, replace the IP address with the name of the host on which the OSM, ASAP, or UIM target is deployed, such as osshost2.example.com.
-
If the field contains a host name, such as osshost2.example.com, but the name of the Comms Suite target contains an IP address, such as 192.0.2.1, replace the host name with the IP address of the host on which the OSM, ASAP, or UIM target is deployed, such as 192.0.2.2.
-
-
Click OK.
-
Navigate to the Comms Suite target home page and confirm that the host performance information appears.
About the Monitoring Home Page for OSM System Targets
The home page for an OSM system displays metrics data that you can use to monitor the health of your entire OSM system and identify the source of problems. See "Viewing Home Pages" for information about accessing OSM system home pages. You can also view the system's configuration topology as described in "Viewing Topology".
Use the Dashboard tab to get an overall view of the system. See "About the Dashboard Tab" for a description of the regions on the Dashboard tab and examples of how to use these regions to identify the source problems.
Use the Metrics by Server, Metrics by Order Type, and Metrics by Cartridge tabs to see the metrics as they pertain to individual servers, order types, and cartridges. Categorizing the metrics helps you identify whether problems are restricted to a particular server, order type, or cartridge. See "About the Metrics by Server, Order Type, and Cartridge Tabs" for descriptions of the regions on these tabs.
Application Management Pack for Oracle Communications includes the OSM Order Metrics Manager feature, which provides the metrics displayed on the home page for OSM systems. If you see an error on the OSM home page in Enterprise Manager Cloud Control stating that the metrics are not available, you will need to manually install the metrics rules files that Order Metrics Manager uses. See the discussion of manually loading metric rules files in Oracle Communications Order and Service Management Installation Guide for more information.
About the Dashboard Tab
The Dashboard tab displays summary information for the entire OSM system. It is divided into the regions described in this section.
About the Order Metrics Region
The Order Metrics region helps you assess how well your system is processing orders.
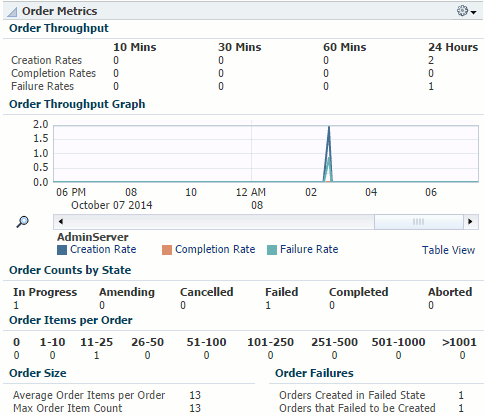
This region, shown in Figure 10-1, displays the following information:
-
The rates at which orders are created, completed, and failed. Compare these rates to identify order backlogs. A higher number of created or failed orders compared to a low number of completed orders can indicate a problem.
-
The number of orders in different states. Use these numbers to monitor order state transitions. A high number of orders in the Failed, Amending, or Aborted states can indicate a problem.
-
The size of orders based on order items. Use these numbers to identify performance problems. If a high number of large orders negatively impacts performance, you may need to tune your system differently.
-
The number of orders failing on creation. Use these numbers to identify order creation and recognition issues.
Figure 10-1 Order Metrics Region of the Dashboard Tab
Description of ''Figure 10-1 Order Metrics Region of the Dashboard Tab''
About the Task Metrics Region
The Task Metrics region helps you assess how well your system is completing tasks and identify particular tasks that may be causing problems.
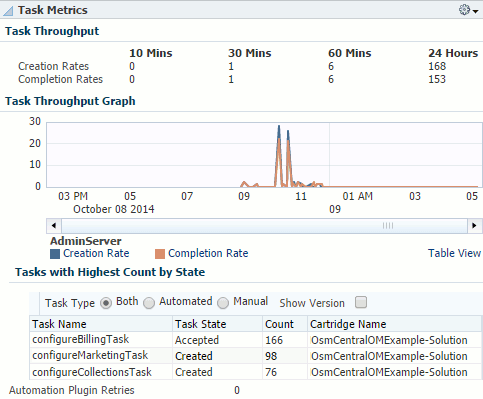
This region, shown in Figure 10-2, displays the following information:
-
The rates at which tasks are created and completed. Compare these rates to identify task backlogs. A higher number of created tasks than completed tasks can indicate a problem.
-
The name and number of tasks in a given state. Use these numbers to identify whether a particular task is causing problems.
Figure 10-2 Task Metrics Region of the Dashboard Tab
Description of ''Figure 10-2 Task Metrics Region of the Dashboard Tab''
You can use this region in conjunction with the Order Metrics region. For example, if you see a high number of failed orders in the Order Metrics region, and the Task Metrics region shows a high number of a particular task in the Failed state, that task is likely causing the order failure. You can investigate and resolve the task in the OSM Task Web client. See Oracle Communications Order and Service Management Task Web Client User's Guide for information about using the Task Web client.
About the Order Lifecycle Times Region
The Order Lifecycle Times region helps you identify performance issues and assess how long your system is taking to process orders.
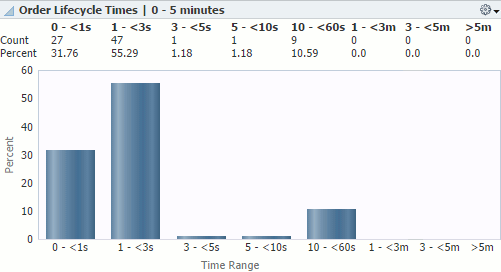
This region, shown in Figure 10-3, displays the number of orders completed within a range of time periods and the percent of the total orders that each time period represents. A significant change in order lifecycle times can indicate a problem.
By default, this region shows orders completed in 0 to 5 minutes. You can add regions to display orders completed in 5 minutes to 7 days, or in 7 days to 90 days. Add regions using the Personalize Page button as described in the discussion of personalizing a Cloud Control page in Oracle Enterprise Manager Cloud Control Administrator's Guide.
Figure 10-3 Order Lifecycle Times Region of the Dashboard Tab
Description of ''Figure 10-3 Order Lifecycle Times Region of the Dashboard Tab''
You can use this region in conjunction with the Order Metrics region. For example, if the Order Metrics region shows that most of your orders have very few order items, but the Order Lifecycle Times region shows that majority of your orders are taking a long time to complete, your system may have a performance issue. See Oracle Communications Order and Service Management System Administrator's Guide for information about improving OSM performance.
About the Quick Links Region
The Quick Links region provides the following links:
-
OSM Information Center: Opens the My Oracle Support page for the OSM information center. You can see news and announcements, knowledge articles, and information about how to use, troubleshoot, maintain, patch, install, configure, and certify OSM.
-
Oracle Communications Documentation: Opens the Oracle Technology Network page for Oracle Communications documentation. You can see the documentation for all Oracle Communications products.
-
Performance Metrics: Opens the performance dashboard for the OSM system target. You can see information about the OSM system's server performance.
-
WebLogic Domain Dashboard: Opens the home page for the WebLogic Server domain on which the OSM system is deployed. You can see information about the servers on the domain.
-
WebLogic Server Performance Summary: Opens the performance summary page for the first managed server in the cluster on which the OSM system is deployed. You can see graphs of the performance information.
-
WebLogic Server Topology: Opens the Configuration Topology Viewer for the first managed server in the cluster on which the OSM system is deployed. You can see relationships between the various middleware and application nodes.
-
Database Dashboard: Opens the home page for the OSM database. You can see information about the database. This link appears if you registered the database target when discovering and promoting the OSM target.
About the System Availability Region
The System Availability region helps you identify problems with individual servers and assess the overall health of your system.
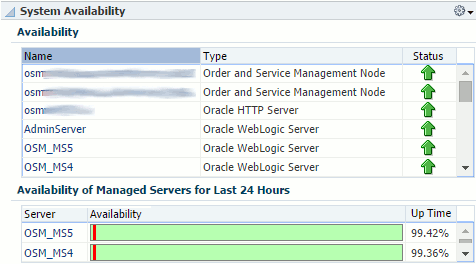
This region, shown in Figure 10-4, displays the following information:
-
The current status of the servers in the system, including OSM nodes, HTTP servers, the administration server, managed servers, database instances, hosts, and Management Agents.
-
The availability of the managed servers for the last 24 hours.
Figure 10-4 System Availability Region of the Dashboard Tab
Description of ''Figure 10-4 System Availability Region of the Dashboard Tab''
You can use this region in conjunction with the other regions of the Dashboard tab. For example, if the Order Metrics region shows that order throughput decreased at a certain point in time, you can check if any of the managed servers were down at that same time. If several servers were down or unreachable, the servers that were up could have been overloaded, causing the decreased order throughput.
About the Infrastructure Region
The Infrastructure region helps you assess the health and performance of your system's infrastructure components.
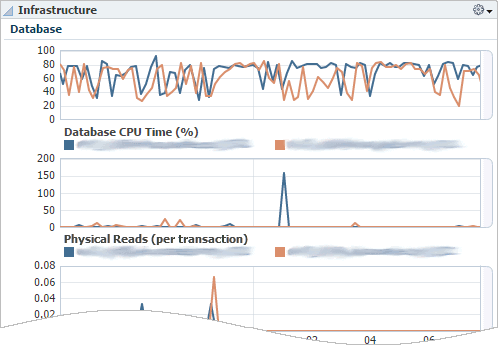
This region, as shown in part in Figure 10-5, displays the following information:
-
The JVM heap usage and number of garbage collector invocations over time.
-
The host CPU and memory usage over time.
-
The database CPU usage, the number of times the database is queried for each transaction, the number of rollbacks over time, tablespace allocated and tablespace used. These graphs will also show any associated Oracle Real Application Clusters databases that you have discovered.
Figure 10-5 Infrastructure Region of the Dashboard Tab
Description of ''Figure 10-5 Infrastructure Region of the Dashboard Tab''
You can use this region to identify whether the JVM, host, or database is causing performance issues. For example, high numbers of physical database reads can indicate problems with your execution plan, such as the database performing full table scans, and high numbers of rollbacks can indicate high numbers of transaction failures.
About the Associate RAC Database to OSM Target Region
This region lets you associate an Oracle Real Application Clusters (Oracle RAC) database to the OSM system target for viewing on the topology page.
You associate the Oracle RAC database with the OSM system target by clicking the Associate RAC Database button. If the OSM system target does not use an Oracle RAC database or you have already associated the Oracle RAC database with the target, nothing happens when you click the button.
See "Associating Oracle RAC Database Targets with BRM and OSM Targets" for information about the tasks required to associate an Oracle RAC database with an OSM system target.
About the Metrics by Server, Order Type, and Cartridge Tabs
The Metrics by Server, Metrics by Order Type, and Metrics by Cartridge tabs display information pertaining to managed servers, order types, and cartridges respectively. All three tabs include the following regions that show the information for each managed server, order type, or cartridge:
-
Order Throughput: Shows the number of created, completed, and failed orders and a graph of the order creation rates.
-
Task Throughput: Shows the number of created, completed, and failed tasks and a graph of the task creation rates.
-
Order Metrics: Shows the number of orders in various states, the average and maximum number of order items per order, the number of orders created in the failed state, and the number of orders that failed on creation.
-
Order Lifecycle Times: Shows the number and percentage of orders with lifecycle times ranging from 0 seconds to 90 days.
The Metrics by Server tab includes the following additional regions:
-
JVM: Identical to the JVM area of the Infrastructure region on the Dashboard tab. See "About the Infrastructure Region".
-
Availability: Identical to the Availability of Managed Servers for Last 24 Hours area of the System Availability region on the Dashboard tab. See "About the System Availability Region".
The Metrics by Order Type tab includes the following additional region:
-
Order Items per Order: For each order type, shows the number of order items in ranges from 0 to greater than 5000.
You can use these tabs to assess the throughput and health of individual servers, order types, and cartridges, and identify whether a particular server, order type, or cartridge is causing problems.
About the Monitoring Home Page for OSS Application Targets
You can monitor the health and performance of OSS application targets on the target home page. OSS application targets include UIM, ASAP, and OSM nodes.
The home page for an OSS application target provides metric data that you can use to monitor availability, alerts, and performance. See "Viewing Home Pages" for information about accessing home pages. You can access the target's configuration topology from the home page as described in "Viewing Topology".
Table 10-2 describes the regions on the home page for OSS application targets.
Table 10-2 Common Regions on OSS Application Home Pages
| Region | Description |
|---|---|
|
Summary |
Displays summary information about the target, including paths to Middleware and domain homes, the installation location, and the server, host, and system target to which the application is deployed. |
|
Incidents/Violations |
Displays the number of critical, warning, and escalated metrics alerts. |
|
Metric Alerts |
Displays details about metrics alerts affecting the target. |
|
Quick Links |
Provides links to related Enterprise Manager Cloud Control pages, such as performance data, WebLogic Server and domain pages, and database pages. See "About the Quick Links Region" for descriptions of each link on OSM node and system pages. |
|
Most Requested Web Modules |
Displays information about the most requested web modules over the last 24 hours, including the number and processing time of requests and the number of times the module was reloaded, since startup and by the minute. |
|
System Availability |
Displays information about the availability of servers related to the target, currently and over the last 24 hours. |
|
Compliance Summary |
Displays displays a summary of compliance evaluations, violations, and scores for the OSM node. Only appears for OSM nodes. See "Managing Compliance" for more information about managing OSM compliance and using the Enterprise Manager Cloud Control compliance tools. |
|
EJB Module |
Displays summary information about Enterprise JavaBeans, including their use and access, and their transaction commits, rollbacks, and timeouts. |
|
J2EE Performance Dashboard |
Displays graphs showing J2EE performance by the number and processing time of requests, the number of active sessions, heap usage, and active threads. |
About Viewing Collection Items and Metrics
You can view a list of all metrics collected for an OSS target and view details about individual metrics, including values, severity, and alerts that are triggered for that metric. See "Viewing Target Metrics".
Application Management Pack for Oracle Communications provides default thresholds for critical collection items and metrics. You can customize the thresholds and add thresholds and alerts for collection items and metrics that have no default thresholds. See "Configuring Metric Monitoring Thresholds and Alerts" for more information about configuring thresholds.