4 Filtering Data
STA enables you to filter the records displayed in pivot and list view tables. Filters allow you to focus on a subset of information by displaying just the records that meet specific criteria.
This chapter includes the following sections:
About Filters
You can filter table data by any table attribute, whether or not that attribute is currently displayed on the table. You can specify filter criteria for any number of attributes, and you can choose whether any or all of the criteria must be met. See "Applying a Filter" for complete details.
Once you apply a filter, the criteria are displayed in the Applied Filter area of the table. This allows you to verify which filter criteria have been applied to the current table view. If no criteria have been applied, this area is blank.
Note:
Filter descriptions longer than 250 characters are truncated. You can hover the cursor over the text to display a tooltip containing the full description.Filter Application
Some screens on the Drives and Media tabs are paired with one another. For these pairings, any filter applied on one screen is automatically applied to its partner. The screen pairings are as follows:
-
Drives – Overview and Drives – Analysis
-
Media – Overview and Media – Analysis
-
All Messages – Overview and All Messages – Analysis
With the exception of these pairings, a filter applies only to the screen on which you apply it. Following are examples:
-
If you apply a filter to the Drives – Overview screen, the same filter is automatically applied to the Drives – Analysis screen, but not to Drives – Cleaning Activities nor any other STA screen.
-
If you apply a filter to the Libraries – Overview screen (a screen with no "partner"), the filter applies to that screen only.
Filter Duration
Once you have applied a filter to a screen, it remains in effect for the duration of your login session. If you navigate away from the screen and then return to it later in the session, the filter will still be in effect. To change or remove a filter, you must take one of the following actions:
-
Apply a new filter. See "Applying a Filter" for details.
-
Remove the filter. See "Clear the Current Filter" for details.
-
Apply a template; the filter criteria in a template overrides any existing criteria. See "Apply a Template" for details.
-
Log out of STA. See "Log Out of STA" for details.
Applying a Filter
You can apply a filter in any of the following ways:
-
By completing the Filter Data dialog box for a pivot or list view table. See "Filter Data Dialog Box" for details.
-
By clicking an aggregate count link in a pivot table. See "Filtering Using Aggregate Count Links" for details.
-
By applying a template. See "Filtering by Applying a Template" for details.
-
By clicking a section of a bar chart or pie chart on the Dashboard. See "Filtering Using Dashboard Graphics" for details.
Filter Data Dialog Box
The Filter Data dialog box appears when you click the Filter Data icon. ![]() A sample dialog box is shown below.
A sample dialog box is shown below.
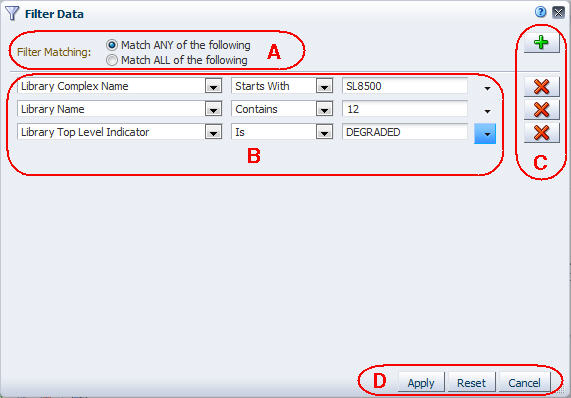
Description of the illustration ''if_filterdataparts.jpg''
| Item | Name | Description |
|---|---|---|
| A | Filter Matching field | Allows you to specify the type of match you want to perform. Select one of the following options:
|
| B | Filter criteria rows | Each row specifies filter criteria to apply to the table. You can add as many rows as you want. On each row, you specify the criteria through the following menu selections:
See "Filter Operators by Attribute Type" for descriptions of the filter operators and attribute values. |
| C | Filter criteria buttons | Buttons allow you to add new filter criteria rows or remove the associated row. |
| D | Buttons | Click one of the following buttons:
|
Filter Operators by Attribute Type
This section describes the operators used in creating selection criteria. The available operators vary depending on the type of attribute.
- Text attribute operators
-
Examples of text attributes include Drive Health Indicator, Volume Serial Number and Drive WWNN.
-
Is – Selects records with attribute values that match the specified string exactly.
-
Isn't – Selects records with attribute values that do not match the specified string exactly.
-
Is Blank – Selects records with blank or null attribute values. This is useful for selecting records that have not had an particular attribute value set in STA. For example, the criteria "% Drive Utilization (30 Days) Is Blank" would select all drives that have not been used in the last 30 days.
-
Starts With – Selects records with attribute values that start with the specified string.
-
Contains – Selects records that contain the specified string anywhere within the attribute value.
-
Doesn't Contain – Selects records that do not contain the specified string anywhere within the attribute value.
-
Ends With – Selects records with attribute values that end with the specified string.
Text entries are not case-sensitive. For example, "ABC" matches "abc" or "Abc".
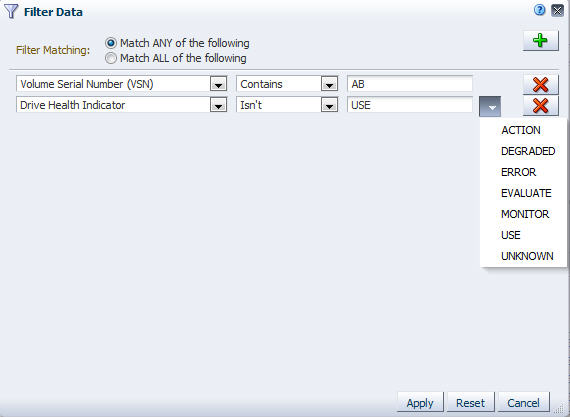
Some text attributes are free-form, in which case, you enter the string in the associated text entry field.
Other text attributes are predefined, in which case you select the value from a menu of possible values. The values listed do not necessarily reflect currently applied filters or the current removed drives and media display settings for your STA username. For example, the "Drive Health Indicator" drop-down menu may include health values that are not currently included in any monitored libraries
-
- Logical group operators
-
When filtering by logical group, you can use the same operators as when filtering by other text attributes; however, because drives and media can be assigned to multiple logical groups, the "Is" and "Isn't" operators, which perform exclusive matches, may not produce expected results with logical groups. The "Contains" and "Doesn't Contain" operators are usually more appropriate when filtering by logical group.
When used to filter by logical group, these operators produce the following results:
-
Is – Selects drives and media assigned only to the specified logical group and not assigned to any others.
-
Isn't – Selects all drives and media, except those assigned only to the specified logical group and not assigned to any others.
-
Contains – Selects drives and media assigned to the specified logical group and any others.
-
Doesn't Contain – Selects drives and media not assigned to the specified group but assigned to others.
See "Filtering by Logical Group" for additional details.
-
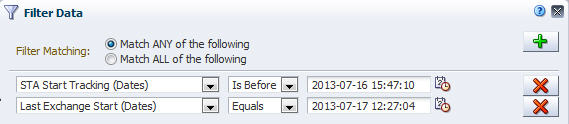
- Date and time stamp operators
-
Examples of time stamp attributes include STA Start Tracking (Dates) and Last Exchange Start (Dates).
-
Equals – Selects entries with attribute dates and times equal to the one you specify.
-
Isn't – Selects entries with attribute dates and times not equal to the one you specify.
-
Is Before – Selects entries with attribute dates and times before the one you specify.
-
Is After – Selects entries with attribute dates and times after the one you specify
-
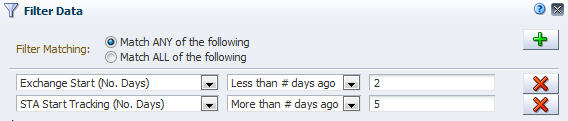
- "Number of days" operators
-
Examples of "number of days" attributes include STA Start Tracking (No. Days) and Last Exchange Start (No. Days)
-
Less than # days ago – Selects entries that occurred less than (<) the specified number of days ago.
-
More than # days ago – Selects entries that occurred more than (>) the specified number of days ago.
Type the value in the associated text entry field.
These operators are especially useful if you want to include a time-related filter in a saved template. By selecting records based on age rather than a specific date and time stamp, the filter is useful now and in the future.
-
- Numeric operators
-
Examples of numeric attributes include Media Length in Meters and Exchange Elapsed Time.
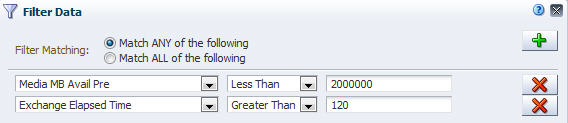
-
Is – Selects records with attribute values equal to the specified value.
-
Isn't – Selects records with attribute values not equal to the specified value.
-
Less Than – Selects records with attribute values less than (<) the specified value.
-
Greater Than – Selects records with attribute values greater than (>) the specified value.
Type the value in the associated text entry field. Do not include units of measure, such as MB, in your entry. Decimals are allowed.
-
- Boolean operators
-
Examples of Boolean attributes include Cleaning Media and Exchange Write Inefficient
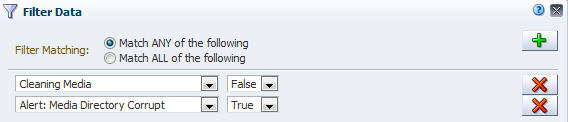
-
True – Selects records for which the condition is true.
-
False – Selects records for which the condition is not true.
-
Filtering Using Aggregate Count Links
The cells within pivot tables contain aggregate counts of resources or events that meet specific criteria. A filter is therefore intrinsic to each aggregate count and is based on selection criteria represented by the pivot table edges. See the STA Screen Basics Guide for details on pivot table layers and filters.
For example, in the following Drives – Analysis pivot table, the "5" in the MONITOR column indicates that there are a total of five drives with a health status of "Monitor".
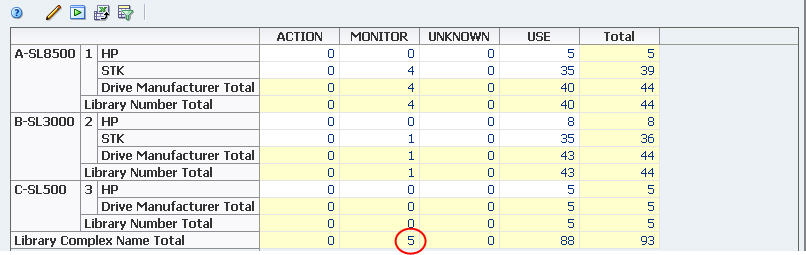
Description of the illustration ''if_filterimplicitlink.jpg''
Clicking on this link takes you to the Drives – Overview screen and applies an appropriate filter based on the table edges The filter criteria are indicated in the Applied Filter area of the table.
Note:
The filter based on the table edges overrides any filter already applied to the Analysis or Overview screens.Note:
Filter descriptions longer than 250 characters are truncated. You can hover the cursor over the text to display a tooltip containing the full description.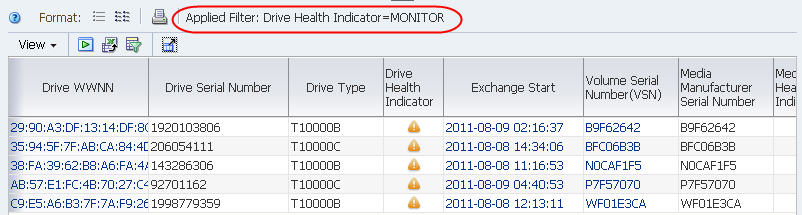
Description of the illustration ''if_filteraggrctresult.jpg''
See "Use an Aggregate Count Link to Apply a Filter" for detailed instructions.
Filtering by Applying a Template
Applying a template automatically applies any filter criteria that are included in the template definition. These criteria override any filter that may already be in effect.
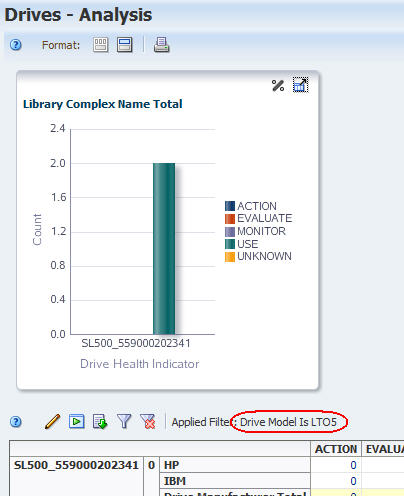
For example, the following Drives – Analysis pivot table has an applied filter, "Drive Health Indicator=USE".
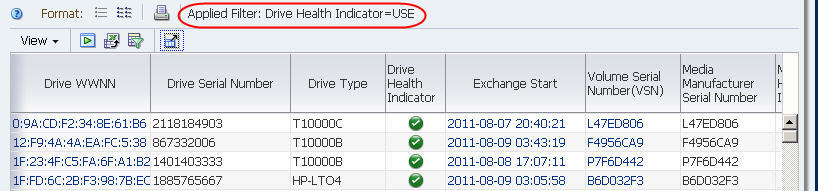
Description of the illustration ''if_filterdriveuse.jpg''
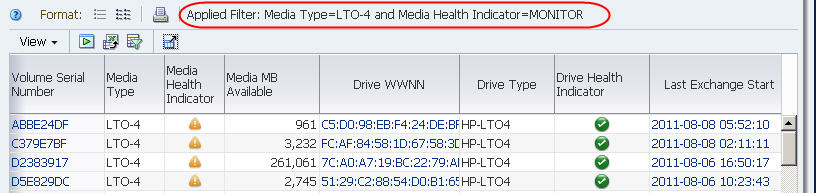
Applying a template that includes a different filter, in this case "Drive Health Indicator=MONITOR", changes the table display and causes the original filter to be overridden.
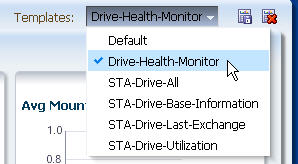
Description of the illustration ''if_filternewtemplate.jpg''
The new filter criteria are indicated in the Applied Filter area of the table.
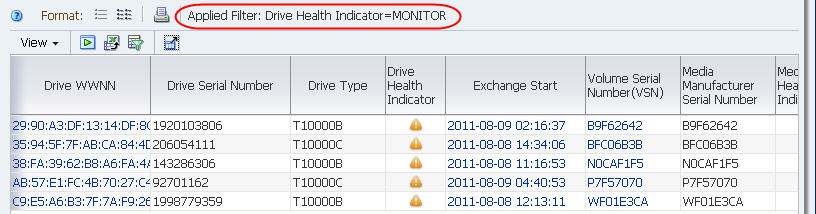
Description of the illustration ''if_filterdrivemonitor.jpg''
Filtering Using Dashboard Graphics
Bar, pie, and area charts on the Dashboard display aggregate data for resources or events that meet specific criteria. A filter is therefore intrinsic to each section of these Dashboard charts.
For example, in the following "Health by Media Type" graph, the selected section of the LTO-4 bar represents 34 drives with a health status of "Monitor".
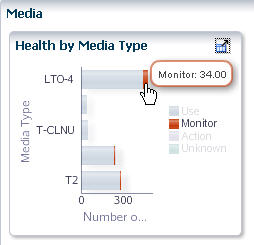
Description of the illustration ''if_dashmediaheath.jpg''
Clicking this section of the bar takes you to the Media – Overview screen and applies the intrinsic filter. The filter criteria are indicated in the Applied Filter area of the table.
Description of the illustration ''if_dashbarclickresult.jpg''
Filtering Tasks
Use the Filter Data Dialog Box to Change a Table Filter
Note:
This procedure applies to both pivot and list view tables.Use this procedure to apply new filter criteria to the current table. You can filter by one or more record attributes, and you can remove selected filter criteria.
For screens that are paired with a "partner", the filter applied to one screen is automatically applied to its partner. See "Filter Application" for details.
-
Click Filter Data in the Table Toolbar.
Description of the illustration ''if_filterdata.jpg''
The Filter Data dialog box appears. If a filter has already been applied, the criteria are displayed in the dialog box, as in the example below.
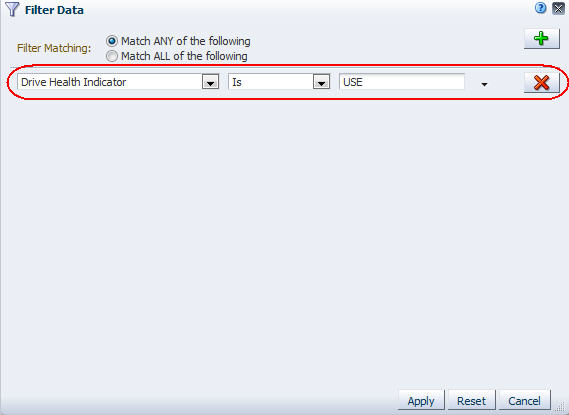
Description of the illustration ''if_filterdatabef.jpg''
-
Specify the filter criteria in the dialog box, as follows:
-
In the Filter Matching field, select one of the options to indicate whether you want to match any or all of the criteria you specify. See "Filter Matching field" for details.
-
Click Add New Filter Criteria to add a new, blank filter criteria row to the dialog box.
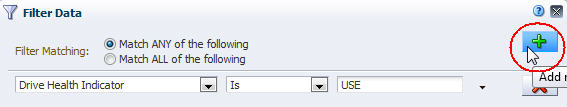
Description of the illustration ''if_filteradd.jpg''
-
Specify the filter criteria using the menus and text field on the row. See "Filter Operators by Attribute Type" for details on filling out each row.
Note:
When selecting an attribute for filtering, if you know the name of the attribute you want to select, you can type the first few letters to quickly move the cursor to that item in the menu. -
You can add as many rows of filter criteria as you want.
-
To remove filter criteria, click Remove This Filter Criteria Row for the associated row.
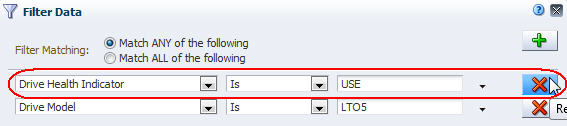
Description of the illustration ''if_filterremove.jpg''
-
-
Verify that your specifications are correct, and then click Apply.
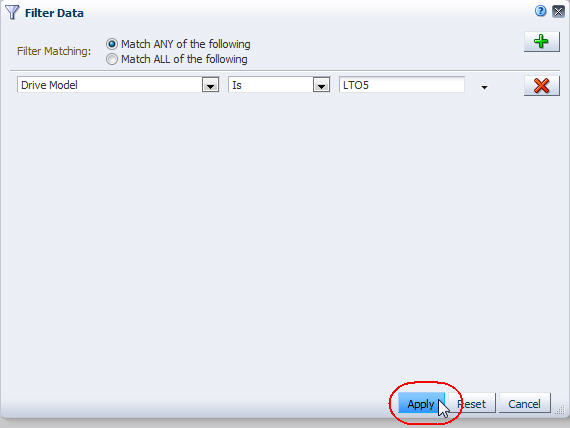
Description of the illustration ''if_filterdataapply.jpg''
The following updates are made to the table:
-
The table displays only the records that match the criteria you have specified.
-
The Applied Filter area indicates the specified criteria.
-
For list view tables, the Table Status Line indicates the number of records.
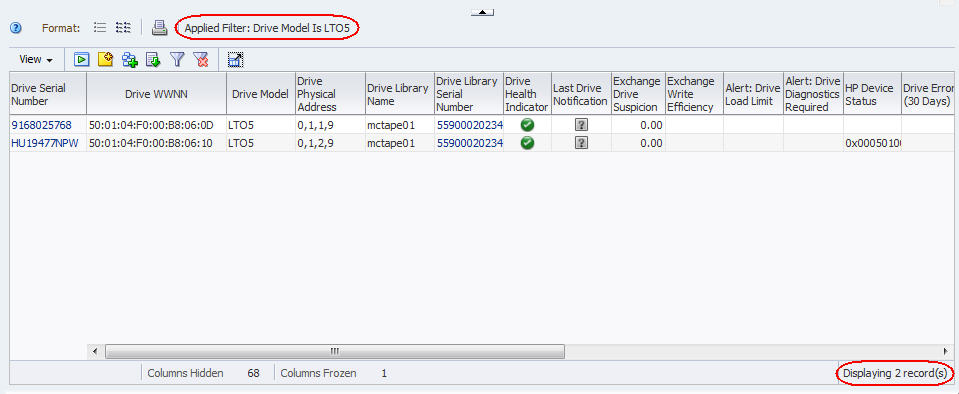
Description of the illustration ''if_filterdataapplied.jpg''
-
-
If the screen is one of a Drives, Media, or All Messages screen pairing, the filter criteria are also applied to its partner. You can navigate to the partner screen to verify this.
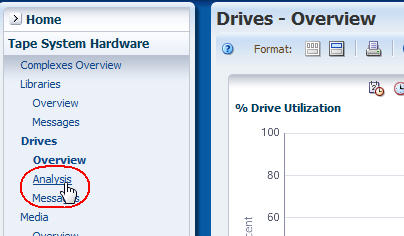
Description of the illustration ''if_filteranlysreturn.jpg''
The Applied Filter area of the tables on both screens indicate the same filter.
Description of the illustration ''if_filterdatastickya.jpg''
Clear the Current Filter
Note:
This procedure applies to both pivot and list view tables.Use this procedure to remove all filter criteria from a table.
Note:
To remove selected filter criteria from a table, see "Use the Filter Data Dialog Box to Change a Table Filter".-
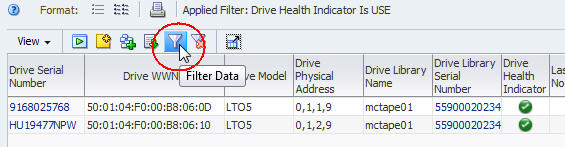
Click Reset Filter in the Table Toolbar.
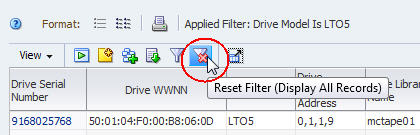
Description of the illustration ''if_filterreseta.jpg''
The following updates are made to the table:
-
All filter criteria are removed from the table so it displays all available records.
-
The Applied Filter area is blank, indicating no filter criteria are currently applied.
-
For list view tables, the Table Status Line indicates the number of records displayed.
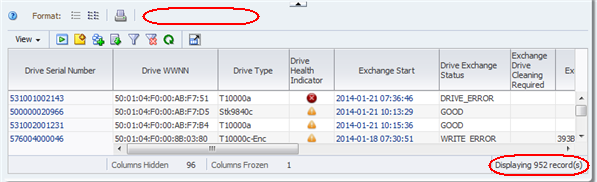
Description of the illustration ''if_filterresetdone.png''
-
Use an Aggregate Count Link to Apply a Filter
Use this procedure to apply a filter to an Overview screen by clicking an aggregate count link in the "partner" Analysis screen pivot table. The resulting display shows detail for the aggregate count.
The aggregate counts in each table cell are the result of the filter criteria intrinsic to each table layer, joined by "AND" statements. Clicking an aggregate count link in a pivot table cell applies the associated filter criteria to the Overview screen.
Note:
The filter applied with this method overrides any filter already applied to the Overview screen.-
Use the Navigation Bar to bring up an Analysis screen.
Description of the illustration ''if_filteranlysreturn.png''
The Media – Analysis screen is used in this example.
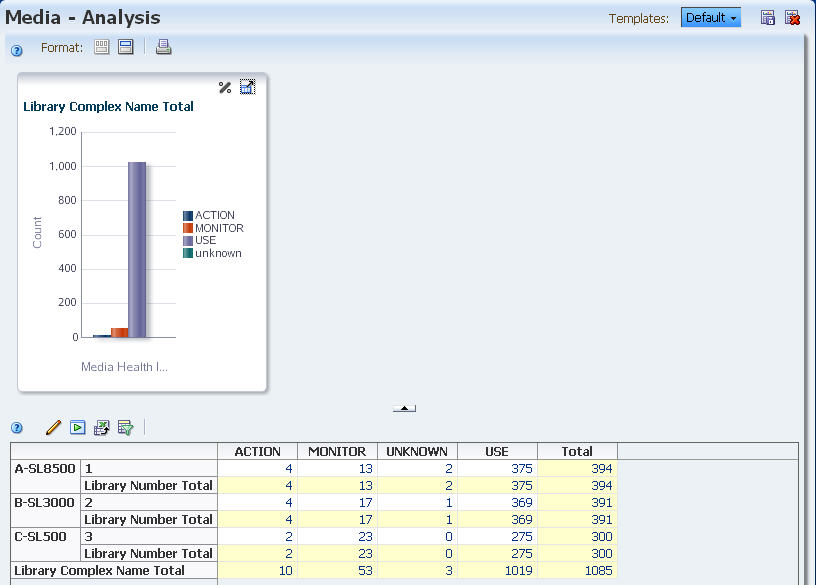
Description of the illustration ''if_filterpivot.jpg''
-
In the pivot table, click an aggregate count link.
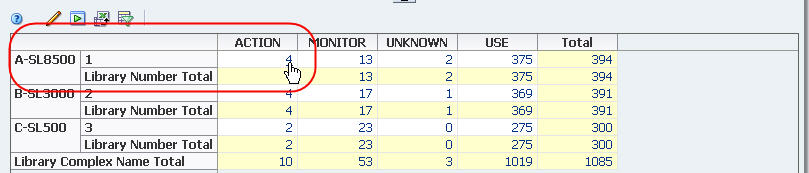
Description of the illustration ''if_filterpivotlink.jpg''
You are taken to the "partner" Overview screen (Media – Overview in this example), and the following updates are made to the list view table:
-
The table displays only the records included in the pivot table aggregate count.
-
The Applied Filter area indicates the filter criteria from the aggregate count.
-
The Table status line indicates the number of records displayed; this number is the same as the aggregate count in the pivot table.
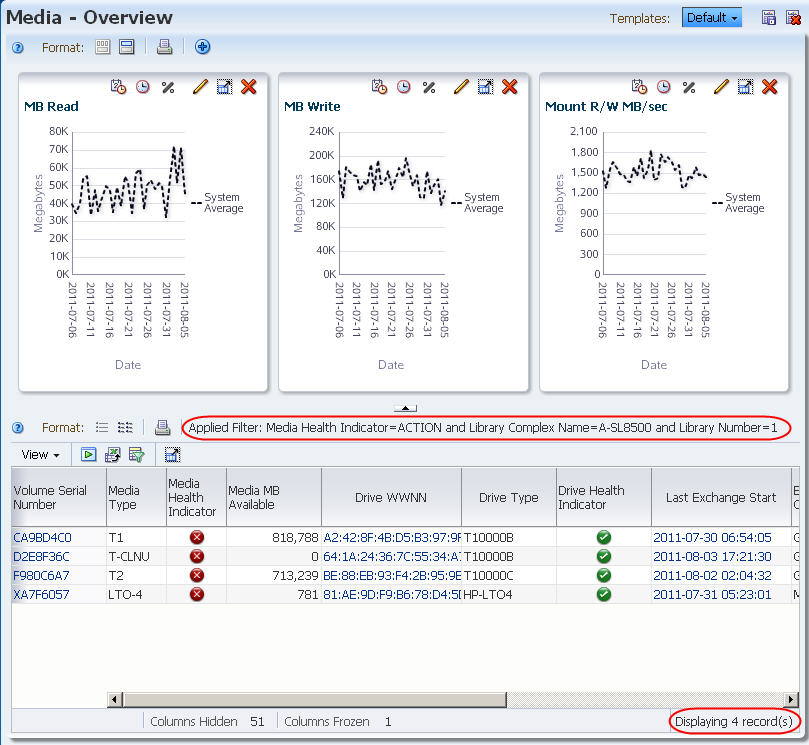
Description of the illustration ''if_filterlinkapplied.jpg''
-
-
Use the Navigation Bar to return to the Analysis screen.
Description of the illustration ''if_filteranlysreturn.jpg''
The filter remains active; therefore, the Analysis screen displays only the records that meet the selection criteria intrinsic to the original aggregate count link.
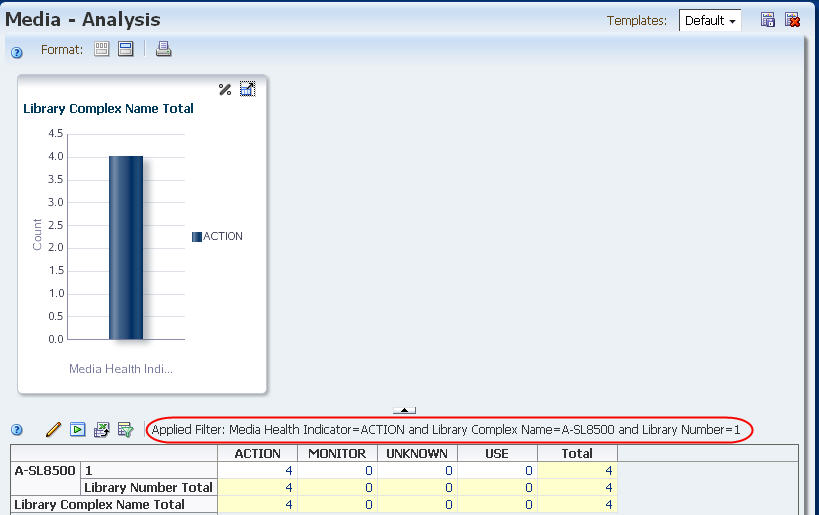
Description of the illustration ''if_filterselectsticky.jpg''
Apply a Filter From the Dashboard
Use this procedure to apply a filter by clicking a section of a bar or pie chart on the Dashboard. You are taken to the corresponding Overview screen, and the filter intrinsic to the bar or pie chart section is applied. This procedure allows you to display detail about data displayed on the Dashboard.
-
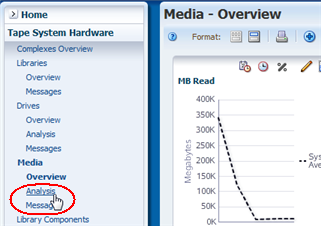
Use the Navigation Bar to go to the Dashboard.
Description of the illustration ''if_dashselect.png''
-
Click a section in a Dashboard bar or pie chart.
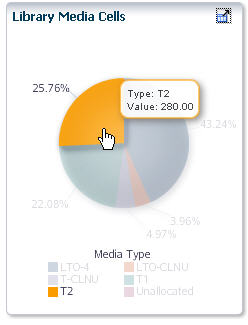
Description of the illustration ''if_dashpieselect.jpg''
You are taken to the corresponding Overview screen (Media – Overview in this example), and the following updates are made to the list view table:
-
The table displays only the records included in the selected Dashboard section.
-
The Applied Filter area indicates the filter criteria from the selected section.
-
The Table status line indicates the number of records displayed; this number is the same as the Value for the selected Dashboard section.
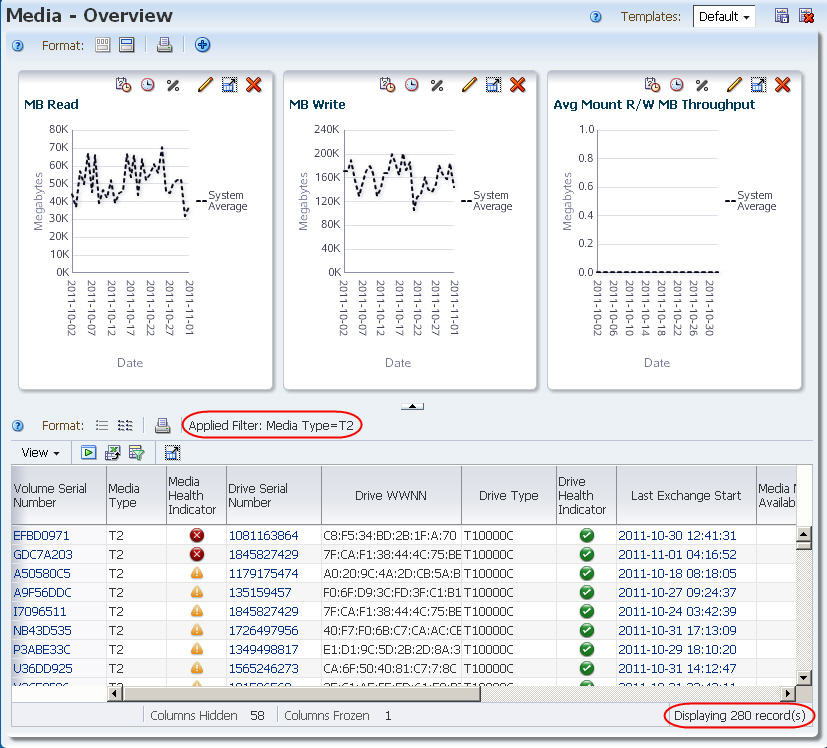
Description of the illustration ''if_dashfilterapplied.jpg''
-
-
Use the Navigation Bar to select the "partner" Analysis screen, if applicable.
Note:
This step applies to Drive, Media, and All Messages screens only.
Description of the illustration ''if_filteranlysreturn.png''
The filter remains active; therefore, the Analysis screen displays only the records that meet the selection criteria intrinsic to the selected bar or pie chart section.
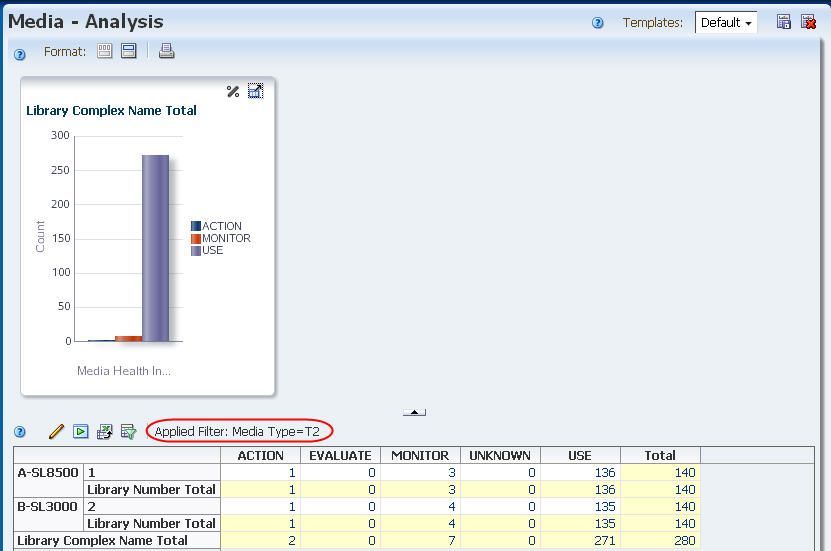
Description of the illustration ''if_dashfiltersticky.jpg''