4 Table Displays
Tables appear in the Main Window of the following types of screens:
-
Dashboard
-
Overview
-
Analysis
This section describes the types of tables available and provides instructions for modifying their display. The following topics are discussed:
Areas of the Main Window
All STA Overview and Analysis screens follow the same general structure and layout. The Main Window is divided into a Graphics Area at the top, and a Table Area at the bottom. The border between the two areas is marked by the Collapse Pane icon, which is always visible, and the Resize control bar, which appears when you move the mouse over the space between the two areas.
he Table Area consists of either a List View table or a pivot table. See the following sections for details:
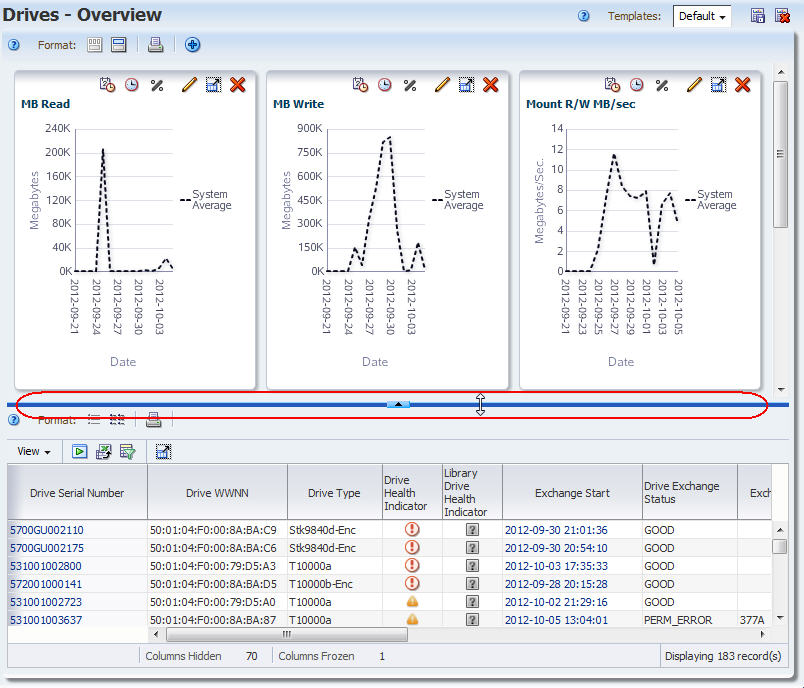
Description of the illustration ''if_mainwindownotes.jpg''
List View Tables
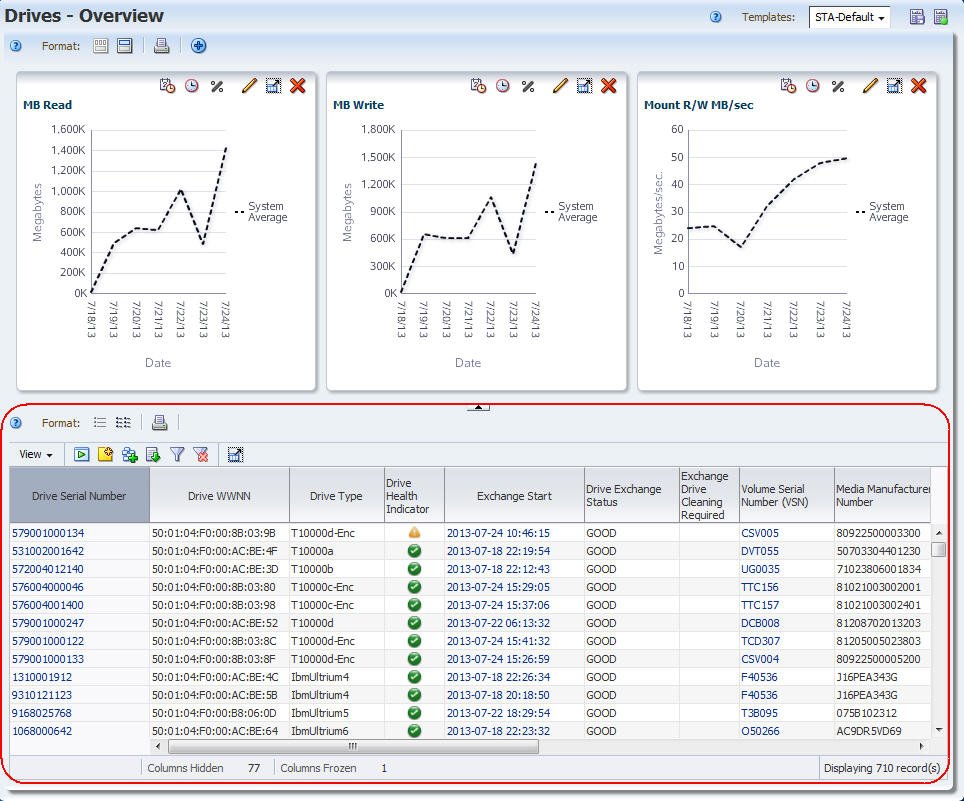
List View tables appear on Overview screens. They display data in rows and columns, with one row for each library resource or event (drive or exchange, for example) and one column for each attribute of that resource.
You can change the display of a List View table by rearranging, sorting, and resizing the columns.
Some List View table cells contain text links. These links provide access to additional details about the selected item(s). See "Resource ID Links" for details.
Note:
Data in STA tables is display only; no modification is allowed.See "List View Table Display Tasks" for details on how you can modify the display of these tables.
Description of the illustration ''if_listviewtable.jpg''
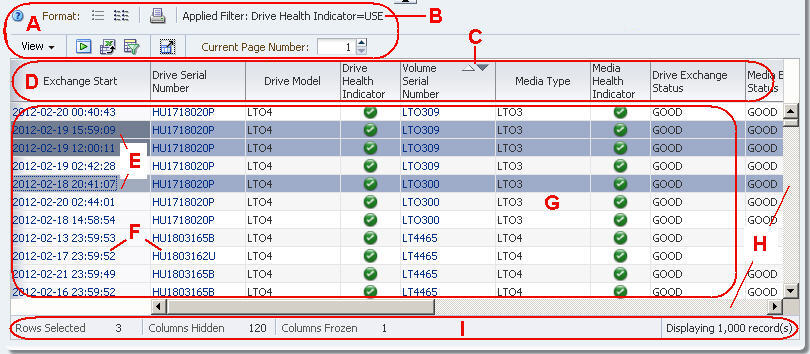
List View Table Layout
Description of the illustration ''if_layoutdata.jpg''
| Item | Name | Description |
|---|---|---|
| A | List View Table Toolbar | Provides direct access to the most frequently used table commands. See "List View Table Toolbar" for descriptions of each icon. |
| B | Applied Filter | Appears only if the data in the table has been filtered. Description of the filter criteria that have been applied. An asterisk (*) next to a filter criterion indicates that it has been filtered exclusively. See the STA User's Guide for details.
Note: Filter descriptions longer than 250 characters are truncated. You can hover the cursor over the text to display a tooltip containing the full description. |
| C | Sorted Column indicator | Appears if the table is sorted by this column. The dark arrowhead indicates the order of the sort (ascending or descending). See "Sort by a Column" for details. |
| D | Column headings | Identifies the resource attribute displayed in the column. |
| E | Selected rows indicator | Highlighted in blue. Some List View Table Toolbar icons become active only when rows are selected. |
| F | Active links | Indicated by blue text. Click the link to display detail for that item. See "Display Detail for One or More Resources" for details. |
| G | Data area | Area where the data cells are displayed. |
| H | Vertical and horizontal scrollbars | Appear only if the table is too large to display in the screen area. Allow you to scroll through the entire table display. |
| I | Table status line | Indicates the number of selected rows, hidden columns, frozen columns, and records displayed. |
List View Table Toolbar
The List View Table Toolbar appears above all List View tables and provides direct access to the most frequently used activities.
Description of the illustration ''if_tabletoolbard.jpg''
| Icon | Name | Description |
|---|---|---|
| Help | Displays help for this area of the screen.
Related Topic: STA User's Guide |
|
| List View | Displays data in a list format, which is the default for List View tables.
Related Topic: "Display Detail for One or More Resources" |
|
| Detail View | Displays detailed data for selected resources in a page format. | |
| Printable Table | Provides a "quick print" function. Displays a printable form of the currently displayed data in a separate browser tab or window.
Related Topic: "Perform a Table "Quick Print"" |
|
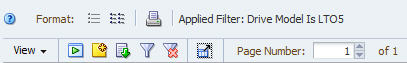
| Applied Filter | Displays filter criteria that have been applied to the table. If the table data is not filtered, this area is blank.
Note: Filter descriptions longer than 250 characters are truncated. You can hover the cursor over the text to display a tooltip containing the full description. Related Topic: STA User's Guide |
|
| View menu | Provides options for modifying the table display, such as sort order and hidden and revealed columns.
Related Topic: "List View Table Display Tasks" |
|
| Apply Selection | Applies the currently selected table rows to the graphs in the Graphics Area.
Related Topic: "Add Library Resources to Graphs" |
|
| Add/Edit Annotation | Allows you to attach a text annotation to this screen record or modify an existing annotation.
Related Topic: "Modify Table Annotations" |
|
| Export | Menu provides options for you to export the currently displayed table data to a XLS, CSV, or PDF file.
Related Topic: "Export Table Data to a Spreadsheet or Document" |
|
| Filter Data | Displays a dialog box that allows you to define, modify, or reset filter criteria and then apply them to the table.
Related Topic: STA User's Guide |
|
| Reset Filter (Display all records) | Allows you to reset the screen filter so all records are displayed.
Related Topic: STA User's Guide |
|
| Detach | Detaches the table from the screen and displays it in a separate window in the browser foreground.
Related Topic: "Detach a Table" |
|
| Page Number | Displays the current table page number and allows you to go directly to a specified page. Appears only for Exchanges, Drive Cleanings, and Messages tables.
Related Topic: "Display a Specific Table Page" |
List View Table Annotations
Table annotations are available for List View tables on the Tape System Hardware and Tape System Activity tabs. They allow users with Operator or Administrator privileges to attach comments to selected records. Users with Viewer privileges can display annotations but not create or modify them. You can apply the same annotation to multiple records at once.
Annotations can be up to 250 characters in length. The information is displayed as ASCII text only—there are no formatting options, such as boldface or color. Also, spacing options, such as forced line feeds, are not preserved. See "Modify Table Annotations" for instructions.
Table annotations are not STA username-specific. Other STA usernames can view and modify annotations you have made.
The table List View shows only the most current annotation for each record, but STA retains a history of all annotation updates. To see a record's full annotation history, use the Detail View—the annotation updates are shown in reverse chronological order, stamped with the STA username and date and time of the change.
Pivot Tables
STA provides real-time advanced data manipulation through pivot tables. Pivot tables appear on Analysis screens, and they show data that is aggregated into different categories, or layers. Layers can be nested within one another along the table column and row edges. By adding and removing layers and nesting layers in different ways, you can break down the table data into different aggregations without the need to open multiple windows or export data to a spreadsheet. For example, you can use pivot tables to look at the health of drives, not just by library location, but also by drive type, firmware level, and many other attributes.
By aggregating data, pivot tables allow you to see data patterns that might not be obvious in a regular List View table. The format of a pivot table is dynamic in that you can change the way the data is organized simply by dragging and dropping—pivoting—the layers from one area to another. Moving a layer within the same edge (shifting layers within the row edge, for example) changes the nesting order. Moving a layer to the opposite edge (moving a layer from row to column edge, for example) adds the layer there.
See "Pivot Table Layout Tasks" for details on how you can modify their display.
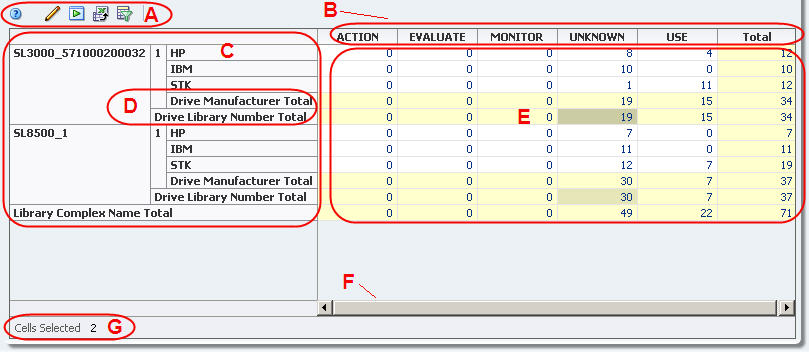
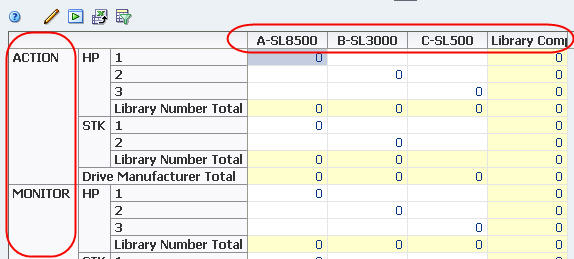
Pivot Table Layout
Description of the illustration ''if_pivlayout.jpg''
| Item | Name | Description |
|---|---|---|
| A | Pivot Table Toolbar | Provides direct access to the most frequently used commands. See "Pivot Table Toolbar" for descriptions of each icon. |
| B | Column layer headings | Arranged along the top edge of the table. Layers are nested from top to bottom within the heading area. Individual heading cells identify the different values for the layer attribute. |
| C | Row layer headings | Arranged along the left edge of the table. Layers are nested from left to right within the heading area. Individual heading cells identify the different values for the layer attribute. |
| D | Layer subtotal | Subtotals are automatically provided for each row and column layer. Subtotal cells are highlighted in light yellow. |
| E | Data area | Area where the data cells are displayed. The data values are aggregate counts and are all active links. Aggregate cells are white. |
| F | Horizontal scrollbar | Appears only if the table is too large to display in the screen area. Allows you to scroll through the entire table display. |
| G | Table status line | Indicates how many rows or cells are selected. |
| n/a | Applied Filter (not shown) | Appears only if the data in the table has been filtered. Indicates the filter criteria that have been applied. See the STA User's Guide for details.
Note: Filter descriptions longer than 250 characters are truncated. You can hover the cursor over the text to display a tooltip containing the full description. |
Pivot Table Toolbar
The Pivot Table Toolbar appears above all pivot tables and provides direct access to the most frequently used pivot table commands.
Description of the illustration ''if_tabletoolbarp.jpg''
| Icon | Name | Description |
|---|---|---|
| Help | Displays help for this area of the screen.
Related Topic: STA User's Guide |
|
| Change Attributes | Displays a dialog box that allows you to show, hide, or reorder attributes in the table.
Related Topic: "Add Library Resources to Graphs" |
|
| Apply Selection | Applies the currently selected table rows to the graphs in the Graphics Area.
Related Topic: "Add Library Resources to Graphs" |
|
| Export | Exports the currently displayed table data to a file that can be viewed and edited with Microsoft Excel.
Related Topic: "Export Table Data to a Spreadsheet or Document" |
|
| Filter Data | Displays a dialog box that allows you to define, modify, or reset filter criteria and then apply them to the table.
Related Topic: STA User's Guide |
|
| Applied Filter | Displays filter criteria that have been applied to the table. If the table data is not filtered, this area is blank.
Note: Filter descriptions longer than 250 characters are truncated. You can hover the cursor over the text to display a tooltip containing the full description. Related Topic: STA User's Guide |
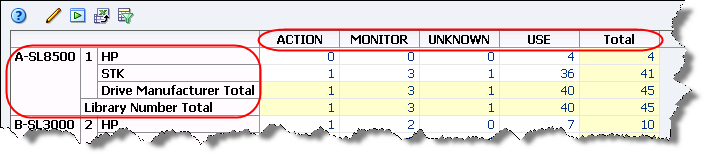
Pivot Table Layers and Intrinsic Filters
Each layer in a pivot table represents filter criteria. Pivot tables can display from two to seven filter criteria. Two is the minimum because there must be one for each table edge.
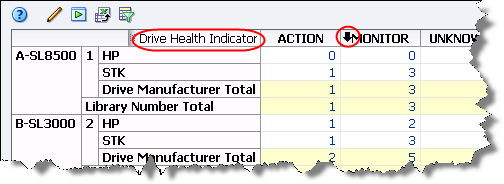
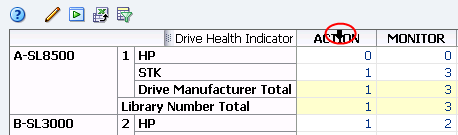
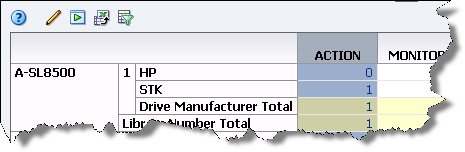
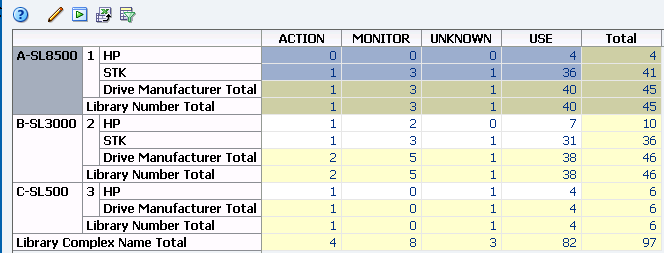
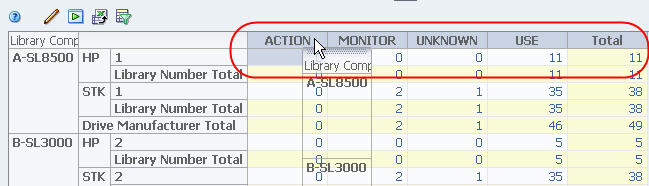
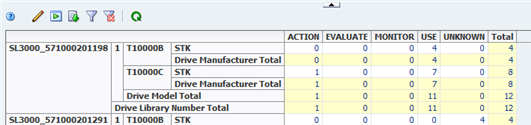
Figure 4-1, is a sample pivot table from the Drives – Analysis screen. It shows the number of occurrences of each drive health indicator (ACTION, MONITOR, and so on), aggregated by drive manufacturer, library, and library complex. A detailed description of each layer follows.
-
There is one column layer on the top edge of the table: Drive Health Indicator.
-
There are three row layers on the left edge of the table: Library Complex, Library Number, and Drive Manufacturer. The layers are nested from left (outer) to right (inner). In this example, Library Complex is the outermost layer, and Drive Manufacturer is the innermost.
-
Individual heading cells identify the different values for the layer attribute. The column layer, Drive Health Indicator, has the following values: ACTION, MONITOR, UNKNOWN, and USE; the outermost row layer, Library Complex Name, has the following values: A-SL8500, B-SL3000, and C-SL500.
-
Counts are automatically subtotaled for each layer, which in this case are Drive Manufacturer Total, Library Number Total, and Library Complex Total.
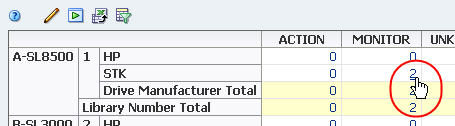
The aggregate counts in each table cell are the result of the filter criteria intrinsic to each table layer, joined by "AND" statements. For example, in Figure 4-1, the table cell at the intersection of the A-SL8500, 1, STK row and MONITOR column has the aggregate count value "3". This value is the result of the following filter criteria:
-
Library Complex Is A-SL8500, AND
-
Library Number Is 1, AND
-
Library Manufacturer Is STK, AND
-
Drive Health Indicator Is MONITOR
The aggregate counts in each pivot table cell are active links. These links provide access to additional details about the items included in the count. For details, see "Aggregate Count Links" and the STA User's Guide.
Best Practices for Table Displays
This section provides tips for using the STA table displays and exporting data.
- Exporting STA data
-
All the Overview screens allow you to export STA data in a variety of formats, including some that work with spreadsheet programs.
- Manipulating data
-
STA provides many built-in features for organizing, filtering, and manipulating data. Be sure to take advantage of these before exporting data. It will make any external work much easier.
List View Table Display Tasks
The following tasks provide instructions for modifying the display of List View tables. See "List View Tables" for a description of the features and benefits of List View tables.
Detach a Table
Detaching a table separates it from the STA screen and displays it in a separate window in the browser foreground. Once you have detached a table, you can resize it and move it anywhere within the browser window.
-
Use either of the following methods to detach the table:
-
By Mouse: Click the Detach icon in the Table Toolbar.
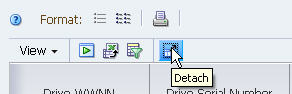
Description of the illustration ''if_datadetachp.jpg''
-
By Menu: In the Table Toolbar, select View, then select Detach.
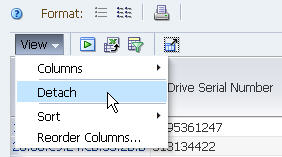
Description of the illustration ''if_datadetachm.jpg''
The table is displayed in a separate window in the screen foreground. The rest of the screen is dimmed in the background. The table title displays "Detached Table".
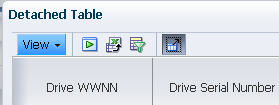
Description of the illustration ''if_datadetached.jpg''
-
-
To restore the table to its normal position, use either of the following methods:
-
By Mouse: Click Close in the Table Toolbar.
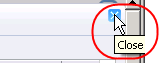
Description of the illustration ''if_dataattachp.png''
-
By Menu: In the Table Toolbar, select View, then select Attach.
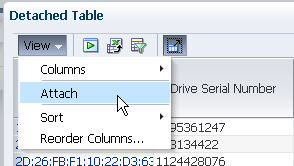
Description of the illustration ''if_dataattachm.jpg''
-
Move a Column
Use this procedure to reorder columns in a table.
Note:
The column on the far-left is fixed and therefore cannot be moved. When you move the mouse over the header of this column, the cursor changes to the Select fixed column cursor.By mouse
-
Click in the heading of the column you want to move.
The entire column is highlighted, indicating it has been selected.
Description of the illustration ''data_colselected.png''
-
Click and drag the column heading; the cursor changes to the Move object cursor.
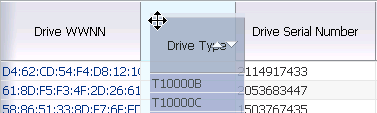
Description of the illustration ''data_dragcolumn.png''
-
Once the column is close to the position you want, release the cursor.
The column snaps into place. You do not need to position it exactly.
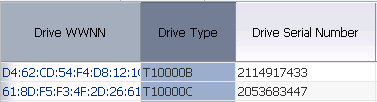
Description of the illustration ''data_movecolumndone.png''
By menu
-
In the Table Toolbar, select View, then select Reorder Columns.
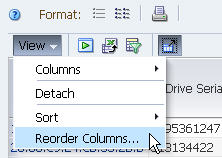
Description of the illustration ''if_viewreorder.jpg''
The Reorder Columns dialog box appears. All revealed, movable columns are listed in their current order on the screen. Fixed and hidden columns are not listed.
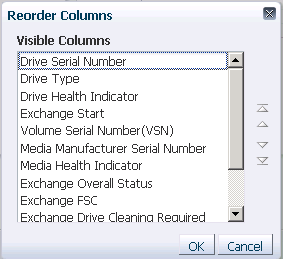
Description of the illustration ''data_reordercol.png''
-
In the list, select the columns you want to move. This dialog box supports Multi-select.
Description of the illustration ''data_reorderdselect.png''
-
Click one of the arrows on the right side of the screen to move the items.
Arrows Description 
Move the selected item(s) up or down, one place at a time. 
Move the selected item(s) to the top or bottom of the list. Moving items up the list causes the columns to be moved to the left in the table display; moving them down the list causes the columns to be moved to the right.
-
Repeat this process until the Visible Columns list is arranged the way you want, and then click OK.

Description of the illustration ''data_reorderdok.png''
The columns are reordered according to your selections.
Description of the illustration ''data_reorderddone.png''
Change the Width of a Column
Use this procedure to adjust the width of a table column.
By mouse
-
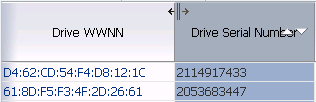
Move the mouse over the right-hand border of the column heading until the Resize column cursor appears.
Note:
Columns are resized from the right side only.Note:
You cannot resize a column from the data rows area.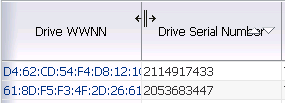
Description of the illustration ''data_resizecolcursor.png''
Note:
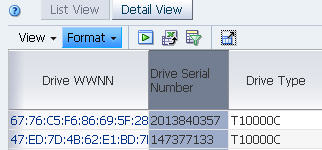
In this example, the Drive WWNN column will be resized, and the width of the Drive Serial Number column will not change. -
Click and drag the border, as follows:
-
To make the column narrower, drag to the left.
-
To make the column wider, drag to the right.
A dotted vertical line appears to indicate the pending width. You can move the border back and forth as much as you want until you get the right width.
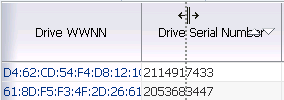
Description of the illustration ''data_resizedrag.png''
-
When the column is the width you want, release the cursor.
The column is resized. All other columns retain their original widths.
Description of the illustration ''data_resizedone.png''
-
By menu
-
Right-click the heading of the column you want to resize, and select Resize Columns.
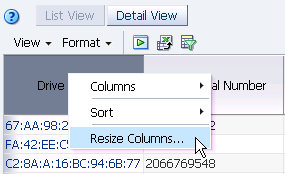
Description of the illustration ''data_resizecol.png''
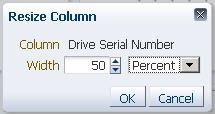
The Resize Column dialog box appears, displaying the current width of the column.
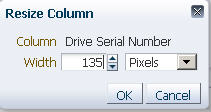
Description of the illustration ''if_resizecold.jpg''
-
Complete the dialog box in either absolute or relative units.
-
For absolute units, do the following:
-
In the menu, select Pixels.
-
In the Width field, enter the number of pixels for the new width.
Note:
You can also use the spinbox up-arrow and down-arrow to increase or decrease the value in the Width field.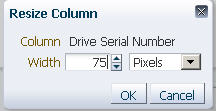
Description of the illustration ''if_resizecolpix.jpg''
-
-
For relative units, do the following:
-
In the menu, select Percent.
-
In the Width field, enter the percent change you want to make to the current column width.
Note:
You can also use the spinbox up- and down-arrows to increase or decrease the value in the Width field.This percentage will be multiplied by the current width to calculate the new width. For example: an entry of 200 doubles the current width; an entry of 25 reduces the current width to one-quarter of what it is now.
Description of the illustration ''if_resizecolperc.jpg''
-
-
-
Verify the settings are the way you want, and then click OK.
The column is resized. All other columns retain their original widths.
Description of the illustration ''if_resizecoldone.jpg''
Sort by a Column
Use this procedure to sort the table by a single column. To do a nested sort using multiple columns, see "Sort by Multiple Columns".
Note:
For screens that include a Page Number field (Exchanges, Drive Cleanings, and Messages), the sort applies only to the records displayed on the current page.By mouse
Note:
This method can be used for all columns in the table but the first one. To change the sort order for the first column, you must use the menu method. See "By menu", below.-
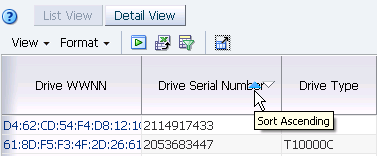
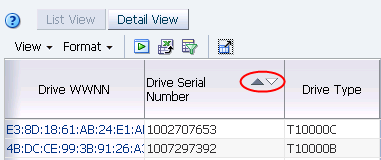
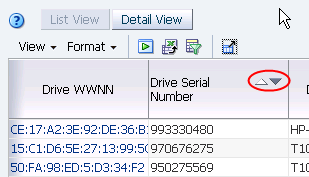
Move the mouse over the heading of the column you want to sort until the sort arrowheads appear.
Description of the illustration ''data_sortcol.png''
-
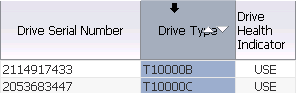
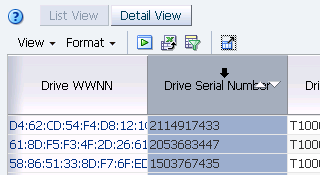
Click either the Ascending or Descending arrowhead, depending on the order you want the data to be sorted. In this example, the Ascending arrow is selected.
Description of the illustration ''data_sorta.png''
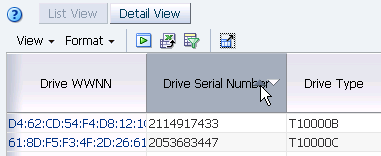
The table data is resorted according to your selection, and the Sorted Column indicator highlights the sort order (ascending, in this example).
Description of the illustration ''data_sortadone.png''
By menu
You can use this method for all columns in the table, including the first one.
-
Click in the heading of the column you want to sort.
The entire column is highlighted, indicating it has been selected.
Description of the illustration ''data_colselect.png''
-
Make the menu selection using either of the following methods:
-
Right-click the column heading and select Sort, then Ascending, or Sort, then Descending.
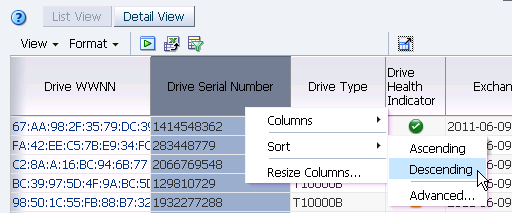
Description of the illustration ''data_rightsortd.png''
-
In the Table Toolbar, select View, then Sort, then Ascending, or select View, then Sort, then Descending.
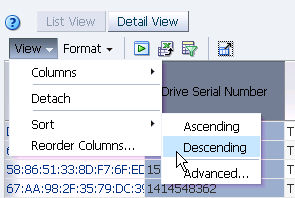
Description of the illustration ''data_viewsortd.png''
-
-
The table data is resorted according to your selection, and the Sorted Column indicator highlights the sort order (descending, in this example).
Description of the illustration ''data_sortddone.png''
Sort by Multiple Columns
Use this procedure to do a nested sort, using up to three columns.
Note:
For screens that include a Page Number field (Exchanges, Drive Cleanings, and Messages), the sort applies only to the records displayed on the current page.Note:
This activity can only be done by menu, not by mouse.-
Make the menu selection using either of the following methods:
-
In the Table Toolbar, select View, then Sort, then Advanced.
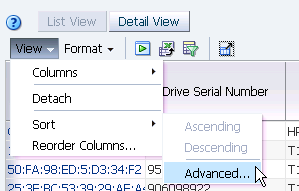
Description of the illustration ''data_viewsortadv.png''
-
Right-click in any column heading and select Sort, then Advanced.
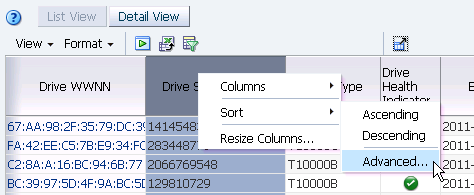
Description of the illustration ''data_rightsortadv.png''
The Advanced Sort dialog box appears.
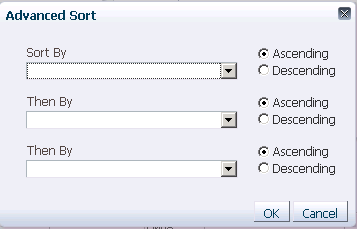
Description of the illustration ''data_advsortblank.png''
-
-
In the Sort By menu, select the column for the primary sort. If a default value has been supplied, you can override it.
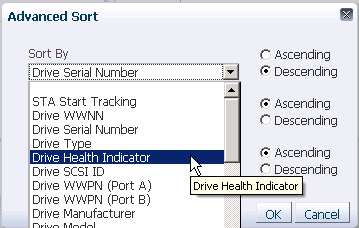
Description of the illustration ''data_advsortby.png''
-
Select either the Ascending or Descending options to indicate the sort order you want to use.
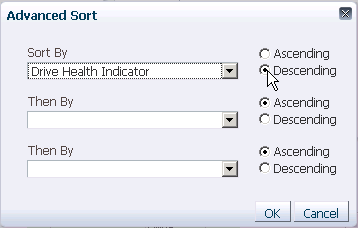
Description of the illustration ''data_advsortdescend.png''
-
Repeat this process for the remaining fields on the screen to indicate the criteria for up to two additional nested sorts. Click OK.
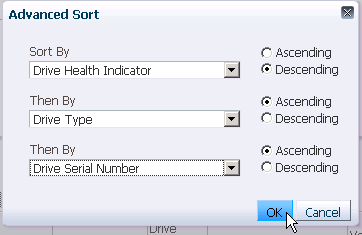
Description of the illustration ''data_advsortall.png''
The table data is sorted according to your selections, and the column headers indicate the sort criteria.
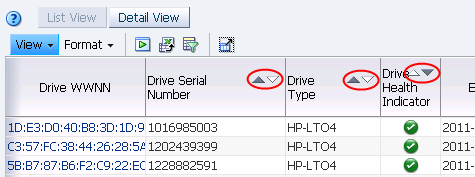
Description of the illustration ''data_advsortdone.png''
Hide and Reveal Columns
Use this procedure to change which columns are revealed in a table and which are hidden.
Note:
This task can done only by menu, not by mouse.-
Display the table column list using either of the following methods:
-
In the Table Toolbar, select View, then select Columns.
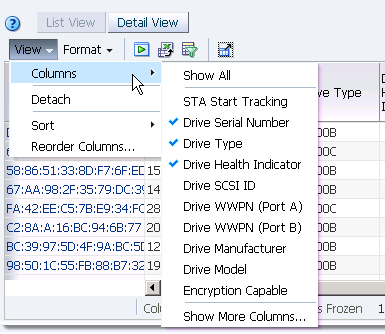
Description of the illustration ''data_colshow.png''
-
Right-click any column heading and select Columns.
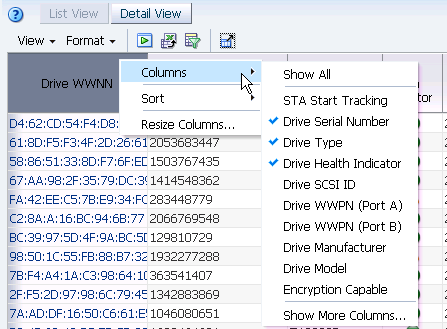
Description of the illustration ''data_colshowr.png''
The menu displays a list of available columns in alphabetical order; up to 10 items are shown in this list. The columns currently included in the table are indicated by check marks.
-
-
To change the table display, do one of the following:
-
Select Show All to add all columns to the table. See Step 7.
Note:
This will result in a very wide table. -
Select a column on the list to add it to the table, or deselect a column to remove it. See Step 7.
-
Select Show More Columns to display the complete list of all columns available for the table. See Step 3.
-
-
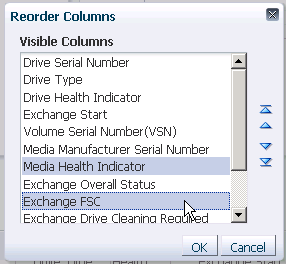
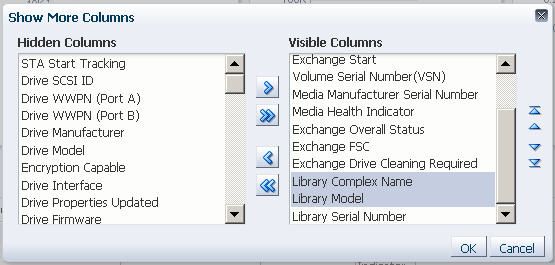
The Show More Columns dialog box appears.
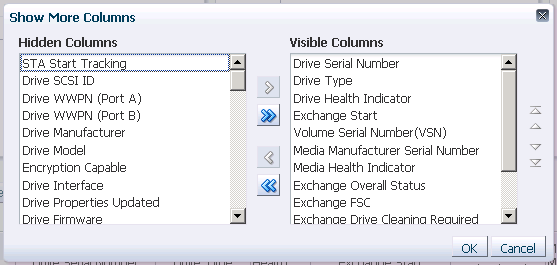
Description of the illustration ''data_colshowmore.png''
The Visible Columns list identifies the columns currently included in the table and their order. The Hidden Columns list identifies columns that are currently hidden; they are listed in the order defined in the current template.
-
Arrange the columns so that the ones you want to display are included in the Visible Columns list and the ones you want to remove are in the Hidden Columns list.
-
Select the columns you want to move from one list to the other. This dialog box supports Multi-select.
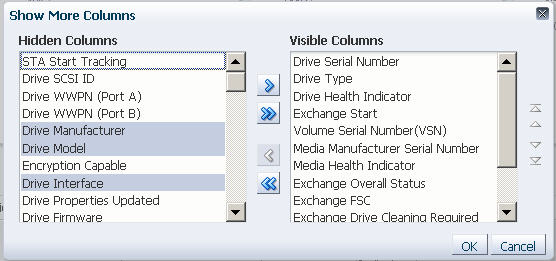
Description of the illustration ''if_showmoreselect.jpg''
-
Click an arrow to move the items, as follows:
Arrows Description 
Move the selected item(s) to the indicated list. 
Move all items from one list to the other. -
Repeat this process until both lists include the items you want.
-
-
Optionally, you can reorder the items in the Visible Columns list by using the reorder arrows on the right side of the dialog box.
Moving items up the list causes the columns to be moved to the left in the table display; moving them down the list causes the columns to be moved to the right.
-
Select the items you want to move. This dialog box supports Multi-select.
Description of the illustration ''if_visiblecolselect.jpg''
-
Click an arrow to move the items, as follows:
Arrows Description Move the selected item(s) up or down, one place at a time. Move the selected item(s) to the top or bottom of the list. -
Repeat this process until the Visible Columns list is arranged the way you want.
-
-
Verify that the dialog box is arranged the way you want, and then click OK.
-
The table display is updated according to your selections.
Display a Specific Table Page
Use this procedure to go directly to a specific page on the Libraries – Messages, Drives – Messages, Media – Messages, Alerts Overview, Exchanges Overview, Drive Cleanings Overview, and All Messages Overview screens.
Because a large number of exchanges and alert messages can be generated in a short time, these screens can display many records. The records are therefore grouped into "pages"; each page consists of 1,000 records sorted as follows:
-
Exchanges Overview and Drive Cleanings Overview screens — Reverse order of "Exchange Start" time (most recent exchanges first)
-
Messages screens — Reverse order of "Date SNMP Trap Received" time (most recent traps first)
Note:
This activity can be done only by mouse, not by menu.-
Move the cursor over the record count area on the right side of the Table Status line.
The cursor changes from the default pointer to a text pointer.
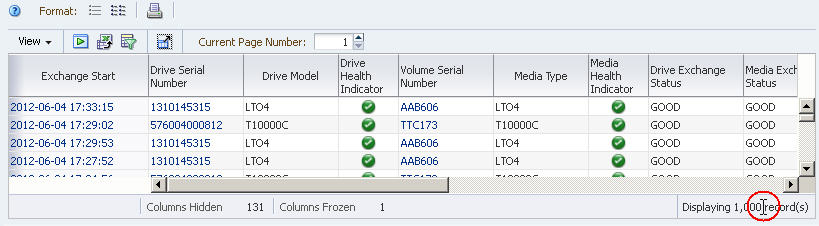
Description of the illustration ''if_tblreccountselect.jpg''
-
Click anywhere within the record count area.
A message appears indicating the total number of records in the table.
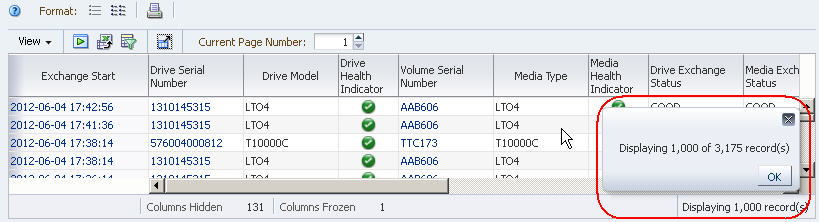
Description of the illustration ''if_tblrectotal.jpg''
-
Click OK to dismiss the message.
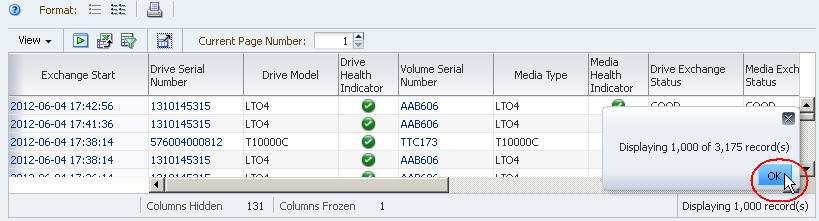
Description of the illustration ''if_tblrectotalok.jpg''
-
In the Page Number field in the Table Toolbar, enter the page number you want to display and then press Enter.
The specified table page is displayed.
Note:
Each page but the last contains 1,000 records. Therefore, each page but the last indicates "Displaying 1,000 records" in the record count area of the Table Status Line. The examples below show pages 3 and 4 of a table containing 3,185 total records.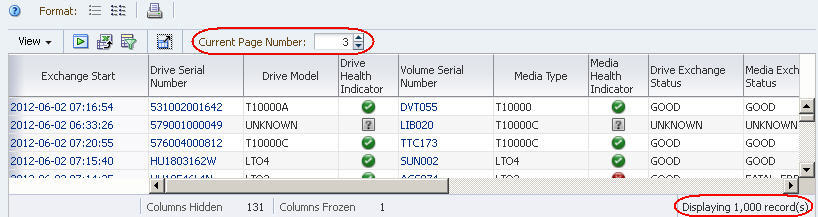
Description of the illustration ''if_tblpagenbr3.jpg''
Display Detail for One or More Resources
Use this procedure to display detailed information for one or more resources.
-
Select the resource(s) you want to display, as follows:
-
To display detail for just one resource, click the active link. Active links are indicated by blue text.
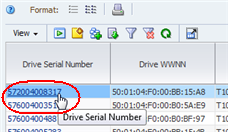
Description of the illustration ''data_link.png''
-
To display detail for multiple resources, use Multi-select to select the rows the resources are in, and then click Detail View. (See "Multi-select" for details.)
Note:
To select a row, click in any column except one that contains an active link; if you click in a column with an active link, you will activate the link.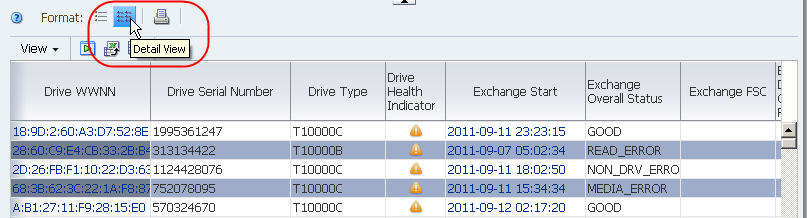
Description of the illustration ''if_detailselectmult.jpg''
-
-
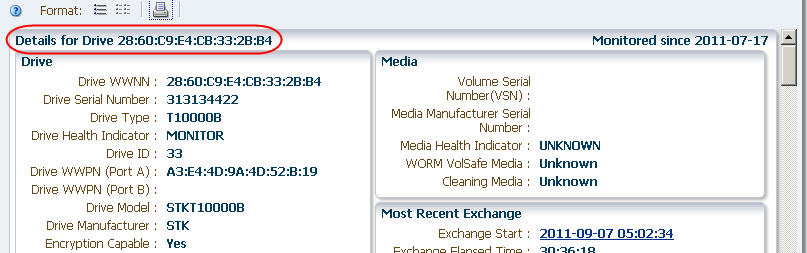
The Detail View screen appears.
If you have selected multiple resources, they are displayed, in order of ID. The ID is displayed in the header of each record. Use the scrollbar to see all the resources.
Description of the illustration ''if_detailmult.jpg''
-
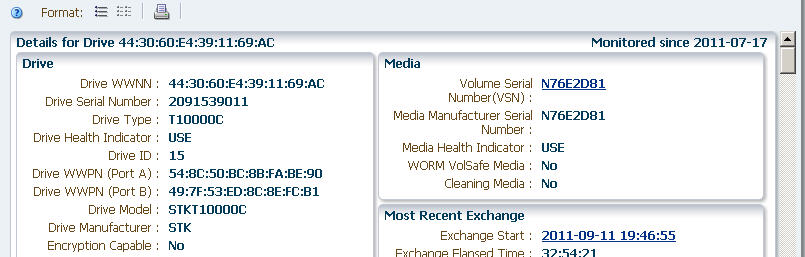
You can follow any active links on this screen to get to additional information.
On this screen, active links are indicated by underlined blue text. In this example, the Volume Serial Number and Exchange Start fields are active links.
See "Use Links to Navigate" for additional information.
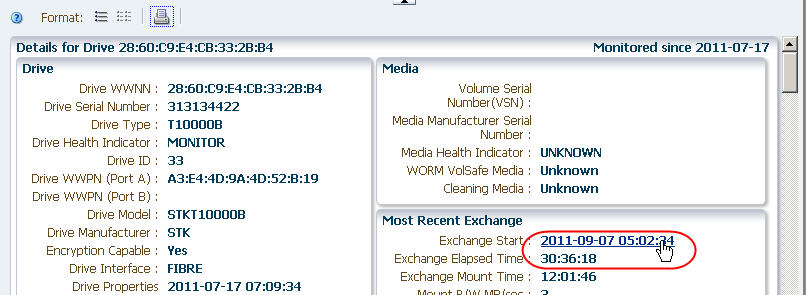
Description of the illustration ''if_detailsingle.jpg''
-
To return to the List View table, click List View.
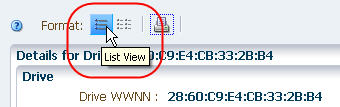
Description of the illustration ''if_listviewselect.jpg''
Modify Table Annotations
Note:
This procedure requires Operator privileges or above.Use this procedure to add or change annotations for selected table records. You can annotate as many records at one time as you want. See "List View Table Annotations" for additional information about annotations.
-
Select the table rows for which you want to add or modify an annotation. To annotate multiple resources, use Multi-select to select the rows. (See "Multi-select" for details.)
Note:
To select a row, click in any column except one that contains an active link; if you click in a column with an active link, you will activate the link. -
Click Add/Edit Annotation in the Table Toolbar.
The Add/Edit Annotation dialog box appears.
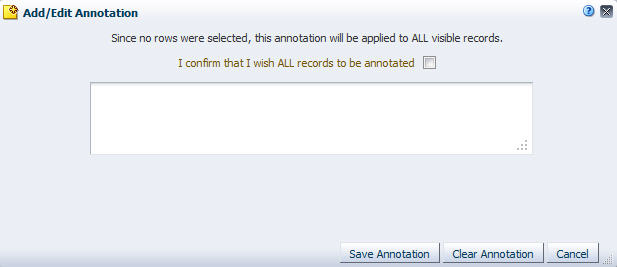
Description of the illustration ''if_tableannotall.jpg''
-
If you did not select any table records in the first step, the dialog box displays a message that any modifications you make will be applied to all displayed table records. If a filter has been applied to the table, the annotation applies only to the records that match the specified criteria, including records currently scrolled off the visible portion of the screen.
-
To update all displayed records, select the check box to confirm.
-
If you do not want to update all displayed records, click Cancel to dismiss the dialog box.
-
-
Complete the dialog box as follows:
-
To add text to the annotation, type up to 250 characters in the text field, and then click Save Annotation.
-
To clear all text in the annotation, click Clear Annotation.
-
To cancel the annotation update, click Cancel.
The annotation is updated according to your selections.
-
Perform a Table "Quick Print"
Use this procedure to perform a "quick print" of currently displayed table data.
Note:
For the List View, this function provides just a snapshot of the current display in the table area; as such, only a subset of table records and columns may be included. To print a true rendering of all table data, it is recommended that you export the table data to a file and print from there. See "Export Table Data to a Spreadsheet or Document".Note:
For the Detail View, this function includes all data in the table area.Note:
Depending on the width of the display, you may need to specify landscape layout when you print.-
Display the data that you want to print, as follows:
-
To print data in the List View format, scroll to the area of the table that you want to print.
Note:
This step is necessary because the quick print function displays only a subset of table records, starting with the first row displayed on the screen.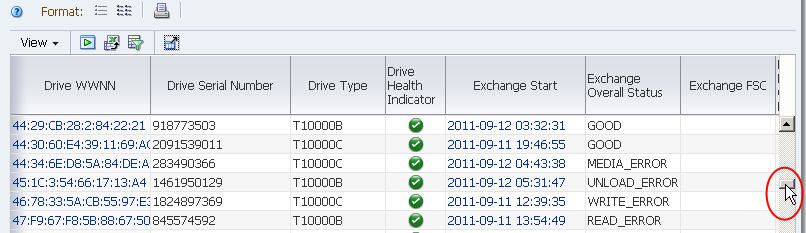
Description of the illustration ''if_tablescroll.jpg''
-
To print data in the Detail View format, select the library resources you want to print and click the Detail View icon. See "Display Detail for One or More Resources" for details.
Description of the illustration ''if_tblprintdetail.jpg''
-
-
Click Printable Table on the List View Table Toolbar.
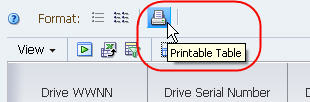
Description of the illustration ''if_tableprintable.jpg''
A new tab is created in your browser window, showing the table data in a printable format.
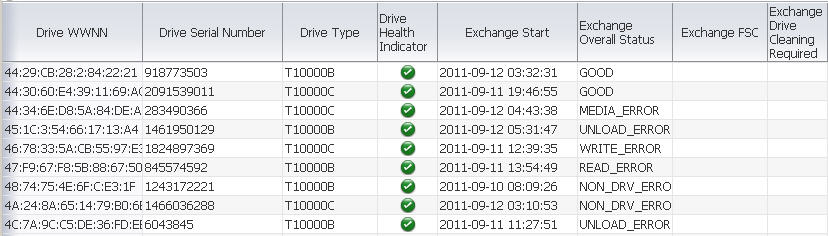
Description of the illustration ''if_tblprintabletab.jpg''
-
You can use your browser's standard Print function to send this display to a printer.
Refresh the Table Display
Use this procedure to update the List View table display to show new records.
-
Click Refresh Table in the Table Toolbar.
The table display is updated with the latest data.
Pivot Table Layout Tasks
The following tasks provide instructions for modifying the layout of pivot tables to aggregate data in different ways. See "Pivot Tables" for a description of the features and benefits of pivot tables.
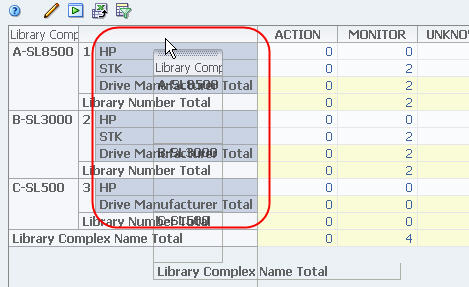
Display the Name of a Layer
Use this procedure to display the name of the attribute that is displayed in a pivot table layer.
-
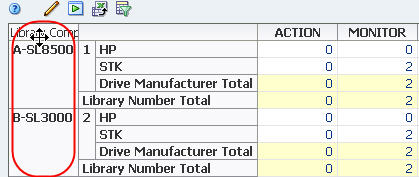
Move the mouse over a row or column heading cell until the Select row or Select column cursor appears. See "Cursor Shapes" for details.
The name is displayed in the layer border, as follows:
-
Column layer borders are directly to the left of the layer:
Description of the illustration ''piv_clayertitle.png''
-
Row layer borders are directly above the layer:
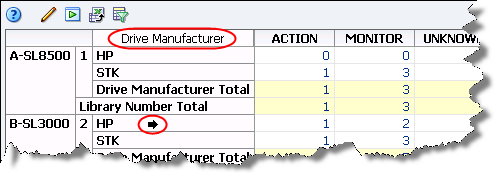
Description of the illustration ''piv_rlayertitle.png''
Note:
The name is truncated if the heading cell is not wide enough to display the entire name. To display the entire name, you can hover over the layer border until the tooltip appears.
-
Change the Width of a Column or a Row Header
Use this procedure to change the width of a column or a row layer header.
By mouse
-
Move the mouse over the right-hand border of the column or row header until the Resize column cursor appears.
Note:
Columns are resized from the right side only.Note:
You cannot resize a column from the data rows area.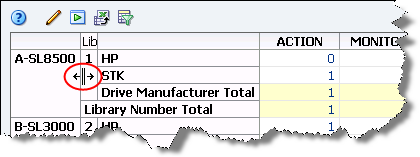
Description of the illustration ''piv_resizecolcursor.png''
Note:
In this example, the Library Complex Name column will be resized, and the width of the Library Number column will not change. -
Click and drag the border, as follows:
-
To make the column narrower, drag to the left.
-
To make the column wider, drag to the right.
A dotted vertical line appears to indicate the pending width. You can move the border back and forth as much as you want until you get the right width.
Description of the illustration ''piv_resizedrag.png''
-
-
When the column is the width you want, release the cursor.
The column is resized. All other columns retain their original widths.
Description of the illustration ''piv_resizedone.png''
By menu
-
Position the cursor within the header of the column you want to resize, until the Select column or Select row cursor appears.
Description of the illustration ''piv_selectcolcursor.png''
-
Right-click and select Width.
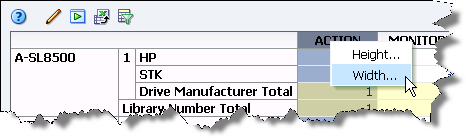
Description of the illustration ''piv_resizewidth.png''
The Width dialog box appears, displaying the current width of the column.
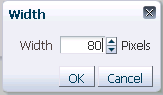
Description of the illustration ''piv_widthd.png''
-
In the Width field, enter the number of pixels for the new width.
Note:
You can also use the spinbox up- and down-arrows to increase or decrease the value in the Width field.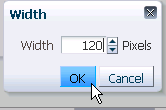
Description of the illustration ''piv_widthdok.png''
-
Verify the settings are the way you want, and then click OK.
The column is resized. All other columns retain their original widths.
Description of the illustration ''piv_resizewidthdone.png''
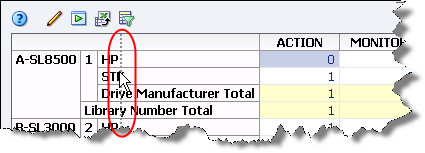
Change the Height of a Row
Use this procedure to change the height of a row or a column layer header.
By mouse
-
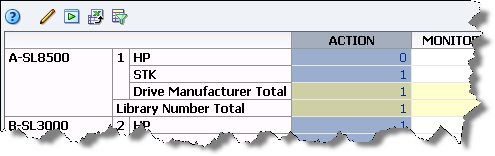
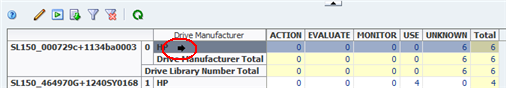
Move the mouse over the lower border of the row or column header until the Resize row cursor appears.
Note:
You cannot resize a row from within the data area.Note:
Rows are resized from the bottom only; therefore, in this example, the HP row will be resized, not the STK row.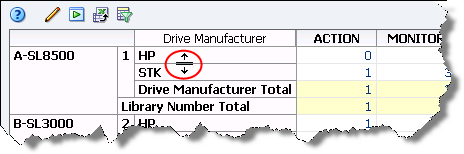
Description of the illustration ''piv_resizerowcursor.png''
-
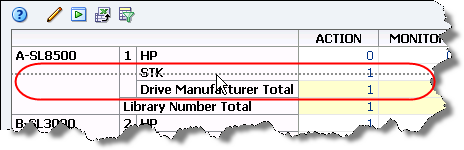
Click and drag the border, as follows:
-
To make the row taller, drag down.
-
To make the row shorter, drag up.
A dotted horizontal line appears to indicate the pending height. You can move the border up and down as much as you want until you get the right height.
Description of the illustration ''piv_resizerowdrag.png''
-
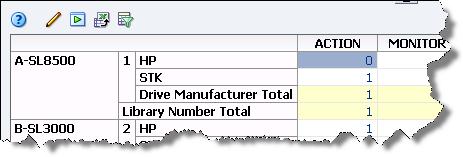
-
When the row is the height you want, release the cursor.
The row is resized. All other rows retain their original heights.
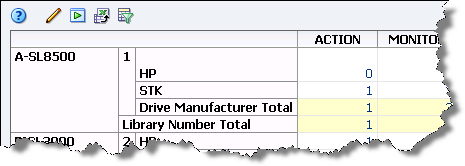
Description of the illustration ''piv_resizerowdone.png''
By menu
-
Position the cursor within the header of the row you want to resize, until the Select row or Select column cursor appears.
Description of the illustration ''piv_selectrowcursor.png''
-
Right-click and select Height.
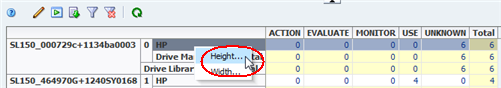
Description of the illustration ''piv_resizeheight.png''
The Height dialog box appears, displaying the current height of the row.
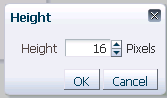
Description of the illustration ''piv_heightd.png''
-
In the Height field, enter the number of pixels for the new height.
Note:
You can also use the spinbox up- and down-arrows to increase or decrease the value in the Height field.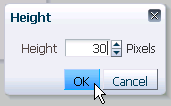
Description of the illustration ''piv_heightdok.png''
-
Verify the settings are the way you want, and then click OK.
The row is resized, and all other rows retain their original heights.
Description of the illustration ''piv_heightdone.png''
Display Detail for an Aggregate Count
Use this procedure to display detail for the resources included in an aggregate count. Each aggregate count includes a filter, which is based on selection criteria represented by the pivot table edges.
-
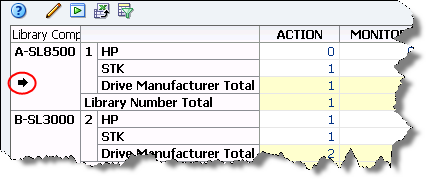
Click the active link of the aggregate count you want to display. Active links are indicated by blue text.
Description of the illustration ''if_pivlink.jpg''
You are taken to the associated Overview screen, and the filter intrinsic to the aggregate count is applied to the data in the List View table. See the STA User's Guide for details.
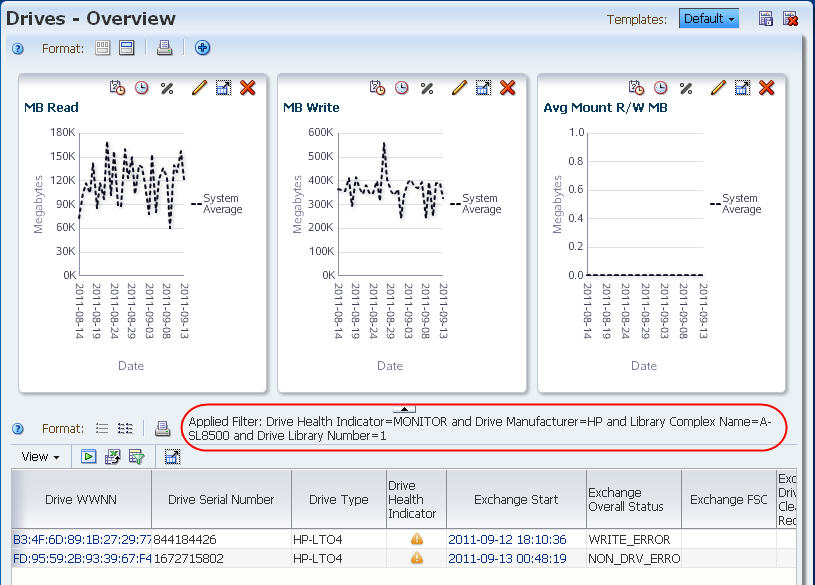
Description of the illustration ''if_detailaggrct.jpg''
-
You can follow any active links on this screen to get to additional information.
Select a Row Layer
You can select one or more row layers at a time. The data cells belonging to the selected layer(s) are highlighted; this can serve as a visual aid to help you see data patterns.
-
Move the mouse over a row layer heading until the cursor changes to the Select row cursor.
Description of the illustration ''piv_rlayercursor.png''
-
Click the header to select the entire layer. You can select multiple layers with Multi-select.
The cells in the selected layer(s) are highlighted as follows:
-
Aggregate count cells are highlighted in blue.
-
Summary cells are highlighted in gray.
Description of the illustration ''piv_rlayerselect.png''
-
Shift Layers on the Same Edge
Use this procedure to shift the nesting level of layers on the same edge.
By mouse
-
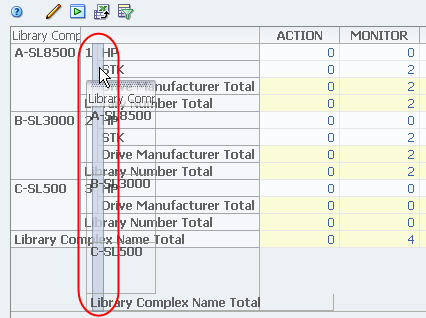
Move the mouse over the border of the heading you want to move, until the Move object cursor appears.
Description of the illustration ''if_moverow.jpg''
-
Click and drag the layer over a layer separator until the separator is highlighted.
Description of the illustration ''if_rowinsert.jpg''
When you release the cursor, the table is reorganized and the aggregate counts in the data cells are re-calculated. In this example, the Library Complex layer has been inserted between the Library Number and Drive Manufacturer layers.
Description of the illustration ''if_rowinserted.jpg''
Swap Layers on the Same Edge
Use this procedure to swap two layers on the same edge.
By mouse
-
Move the mouse over the border of the heading you want to move, until the Move object cursor appears.
Description of the illustration ''if_moverow.jpg''
-
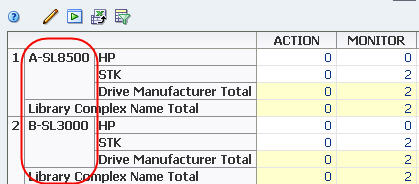
Click and drag the first layer over the second layer until that layer's headings are highlighted.
Description of the illustration ''if_rowswap.jpg''
When you release the cursor, the table is reorganized and the aggregate counts in the data cells are re-calculated. In this example, the Library Complex layer has been swapped with the Drive Manufacturer layer.
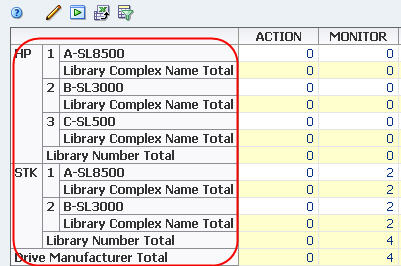
Description of the illustration ''if_rowswapped.jpg''
Move a Layer to the Opposite Edge
Use this procedure to move a layer from one edge to the other.
By mouse
-
Move the mouse over the border of the heading you want to move, until the Move object cursor appears.
Description of the illustration ''if_moverow.jpg''
-
Click and drag the layer over a layer separator on the opposite edge until the separator is highlighted.
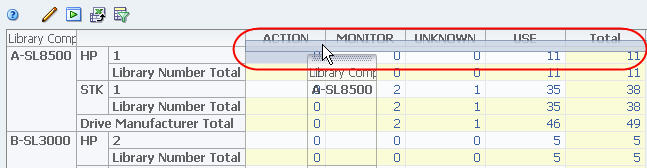
Description of the illustration ''if_rowinsertopp.jpg''
When you release the cursor, the table is reorganized and the aggregate counts in the data cells are re-calculated. In this example, the Library Complex layer has been inserted below the Drive Health Indicator layer on the column edge.
Description of the illustration ''if_rowinsertedopp.jpg''
Swap Layers on Opposite Edges
Use this procedure to swap layers on opposite edges.
By mouse
-
Move the mouse over the border of the heading you want to move, until the Move object cursor appears.
Description of the illustration ''if_moverow.jpg''
-
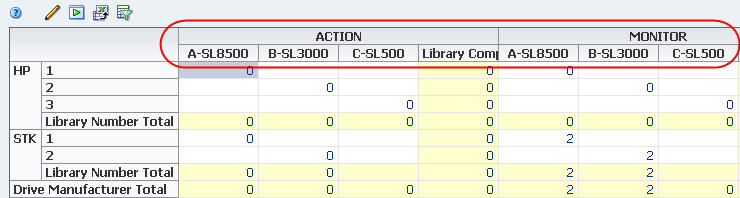
Click and drag the layer over a layer on the opposite edge, until the second layer's headings are highlighted.
Description of the illustration ''if_rowswapopp.jpg''
When you release the cursor, the table is reorganized and the aggregate counts in the data cells are re-calculated. In this example, the Library Complex layer has been swapped with the Drive Health Indicator layer.
Description of the illustration ''if_rowswappedopp.jpg''
Change Table Attributes and Their Nesting Order
Use this procedure to change the attributes displayed in a pivot table. You can add and remove attributes in the table and change the order in which they are nested.
Note:
Pivot tables can include between two and seven attributes.-
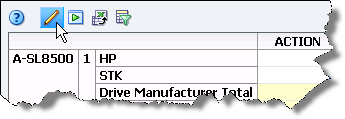
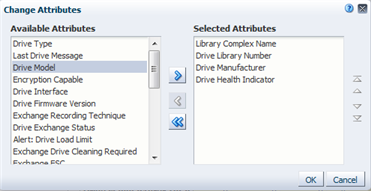
In the Pivot Table Toolbar, click Change Attributes.
Description of the illustration ''piv_changeattrib.png''
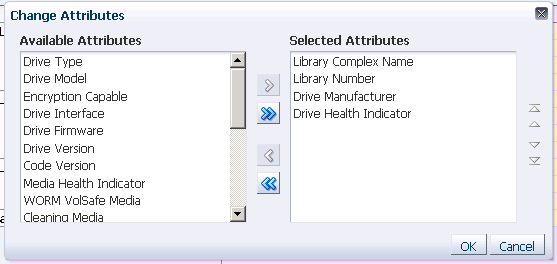
The Change Attributes dialog box appears. The Selected Attributes list identifies the attributes currently included in the pivot table and their order. The Available Attributes list identifies attributes that are currently hidden.
Description of the illustration ''piv_changeattribd.png''
-
Arrange the attributes so that the ones you want to display are included in the Selected Attributes list and the ones you want to remove are in the Available Attributes list.
Note:
The Selected Attributes list must include a minimum of two and a maximum of seven attributes.-
Select the attributes you want to move from one list to the other. This dialog box supports Multi-select.
-
Click an arrow to move the items, as follows:
Arrows Description Move the selected item(s) to the indicated list. Move all items from one list to the other. -
Repeat this process until both lists include the items you want.
-
-
Optionally, you can reorder the items in the Selected Attributes list by using the reorder arrows on the right side of the dialog box.
By default, the last attribute in the Selected Attributes list appears on the column edge of the table. The other attribute(s) appear on the row edge, nested in the order they appear in the list; the top attribute is the outer layer.
-
Select the items you want to move. This dialog box supports Multi-select.
Description of the illustration ''piv_changeattribselect.png''
-
Click an arrow to move the items, as follows:
Arrows Description Move the selected item(s) up or down, one place at a time. Move the selected item(s) to the top or bottom of the list. -
Repeat this process until the Selected Attributes list is arranged the way you want.
-
-
Verify that the dialog box is arranged the way you want, and then click OK.
The pivot table is updated according to your selections.
Description of the illustration ''piv_changeattribdone.png''
Table Data Export Tasks
The following tasks provide instructions for exporting data from List View or pivot tables.
Export Table Data to a Spreadsheet or Document
Note:
This procedure applies to both pivot and List View tables.Use this procedure to export an STA table to your local computer. You can save pivot table data as a .xls file, and List View tables as any of the following formats:
-
XLS – The file is given a .xls extension, but the data is actually saved in HTML format. The file can be opened with either a browser or a spreadsheet application, such as Microsoft Excel. See "Display an Exported .xls File" for options on viewing and editing a file saved in this format.
-
CSV – Comma Separated Values file, which can be opened with a variety of spreadsheet applications.
-
PDF – Portable Document Format file, which can be opened with Adobe Reader.
Before performing this procedure you need to set up the table so it includes all the data you want to export. The exported data includes all resources and attributes included in the table, as follows:
-
If you have applied a filter to the table, the spreadsheet includes only the records that match the criteria you have specified.
-
Data records and attributes currently scrolled off the visible portion of the screen are included.
-
Hidden attributes are not included.
-
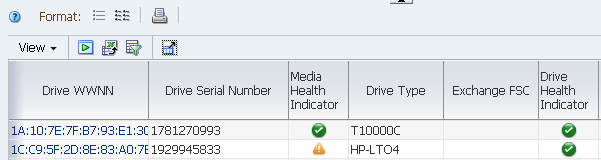
Set up the table so it displays all the data you want to export.
Note:
This procedure uses a List View table, but you could also use a pivot table.A filter is applied in this example.
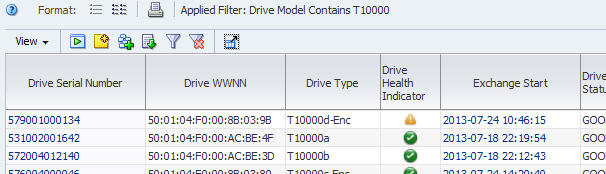
Description of the illustration ''if_exportbefore.jpg''
-
Click Export in the Table Toolbar, and select the format to which you want to save the file.
Note:
For pivot tables, the only available format is .xls.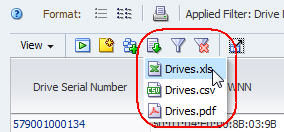
Description of the illustration ''if_tblexport.jpg''
The file is downloaded to your computer according to your browser settings. See your browser documentation for details. Following is an example of a dialog box you might see on a computer running Windows, in which the file will be saved with a .xls extension.
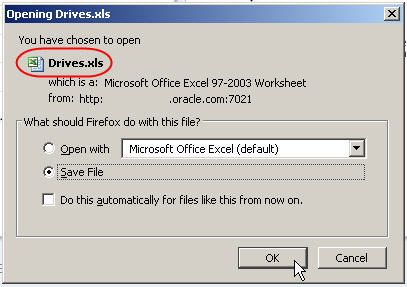
Description of the illustration ''if_tblexportdialog.jpg''
Note:
If you are exporting a large amount of data, it may take several minutes to create the file. Depending on the selected export format and your browser settings, you may not receive any screen feedback while the file is being created. -
If you exported to a .xls file, proceed to "Display an Exported .xls File" for instructions on viewing and editing the file.
Display an Exported .xls File
Use this procedure to view and optionally edit a .xls file you have created with "Export Table Data to a Spreadsheet or Document". The file is given a .xls extension, but the data is actually in HTML format. As a result, you can display the file using either of the following options:
Display the Spreadsheet With Excel
Because the file is saved with a .xls extension, you can easily open it in Microsoft Excel and perform spreadsheet functions on the data.
-
Keep the .xls extension on the file, and open it in Excel or a compatible spreadsheet application.
An informational message is displayed. This message is normal, and it appears because the file is actually in HTML format.

Description of the illustration ''if_tblexportissue.jpg''
-
Click Yes to open the file.
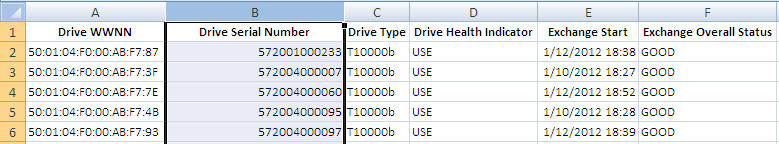
The file is displayed as an Excel spreadsheet. Depending on a variety of details, including the length of the numbers and the position of the data in the table, Excel may or may not convert some cells to scientific notation. This is an Excel formatting issue only and does not affect the integrity of the underlying data.
In the following example, the cells in the "Drive Serial Number" column are displayed in scientific notation.
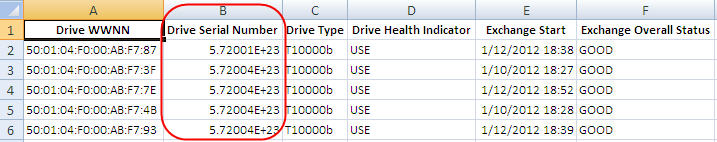
Description of the illustration ''if_tblcolsci.jpg''
-
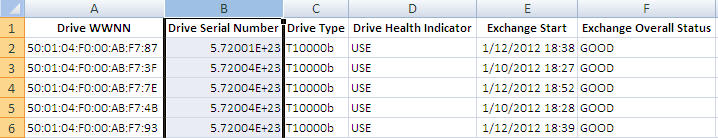
To correct formatting issues with numeric data, perform the following steps:
-
Select the column header to highlight the entire column.
Description of the illustration ''if_tblcolsciselect.jpg''
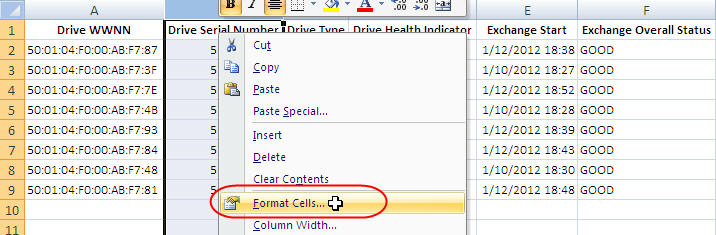
-
Right-click the column and select Format Cells.
Description of the illustration ''if_tblcolscireformat.jpg''
-
In the Format Cells dialog box, select Number in the Category column.
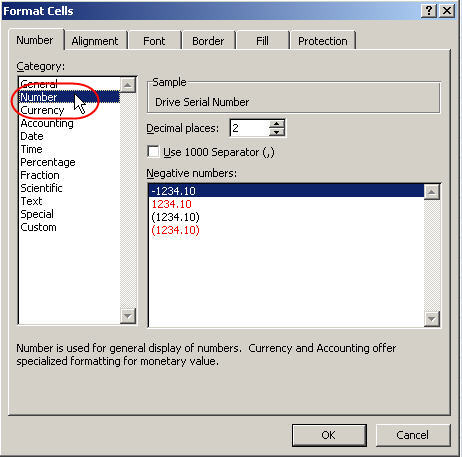
Description of the illustration ''if_tblcolsciformatd.jpg''
-
In the Decimal places field, type "0".
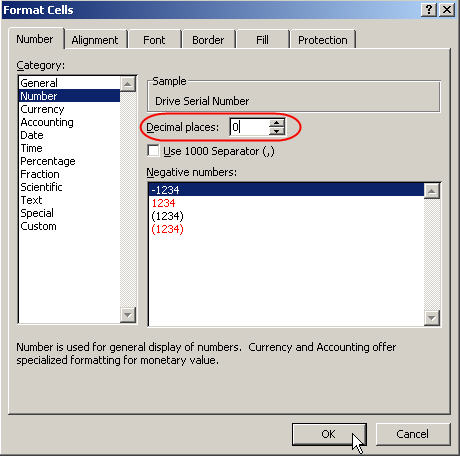
Description of the illustration ''if_tblcolscidec.jpg''
-
Leave all other fields as is, and click OK to save the changes.
The cells are reformatted in standard notation.
Description of the illustration ''if_tblcolscidone.jpg''
-
-
See the Microsoft Excel documentation for information about the various functions you can perform on the data in the spreadsheet.
Display the Spreadsheet in a Browser
Because the file is in HTML format, you can display it in a browser window. Using this procedure, you can view and print the data, but you cannot modify it.
-
Change the .xls file extension to .htm or .html.
-
Open the file in your browser.
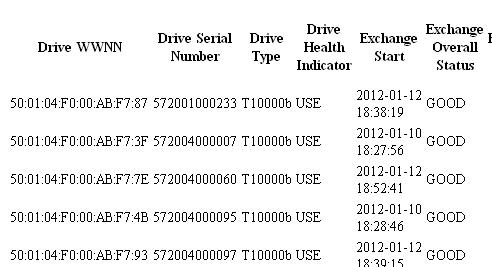
Description of the illustration ''if_tblexportbrowser.jpg''